. 2020 Apr 8;147(7):dev186957.
doi: 10.1242/dev.186957.

Oriented basement membrane fibrils provide a memory for F-actin planar polarization via the Dystrophin-Dystroglycan complex during tissue elongation

Affiliations

Oriented basement membrane fibrils provide a memory for F-actin planar polarization via the Dystrophin-Dystroglycan complex during tissue elongation

Fabiana Cerqueira Campos et al. Development. .

Abstract

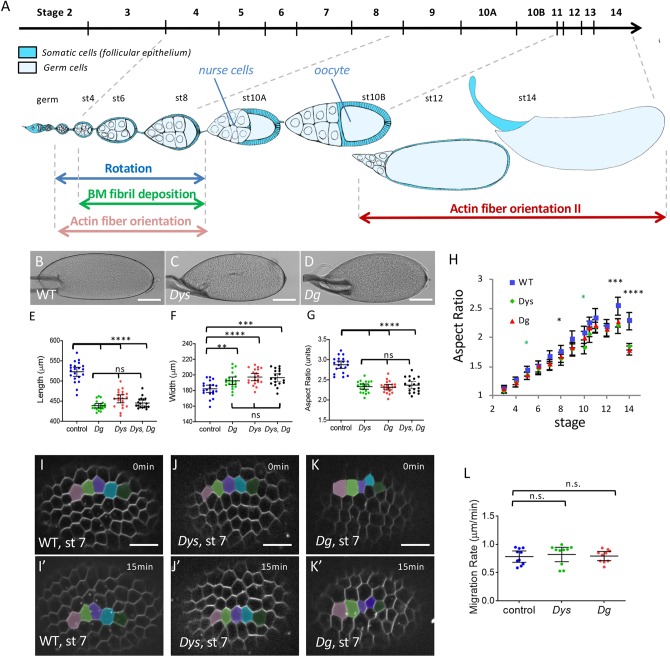
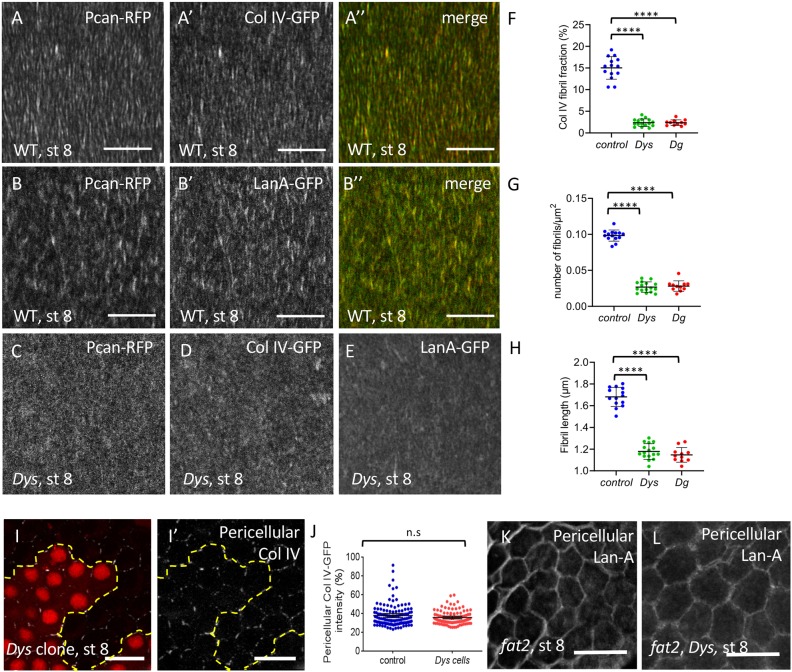
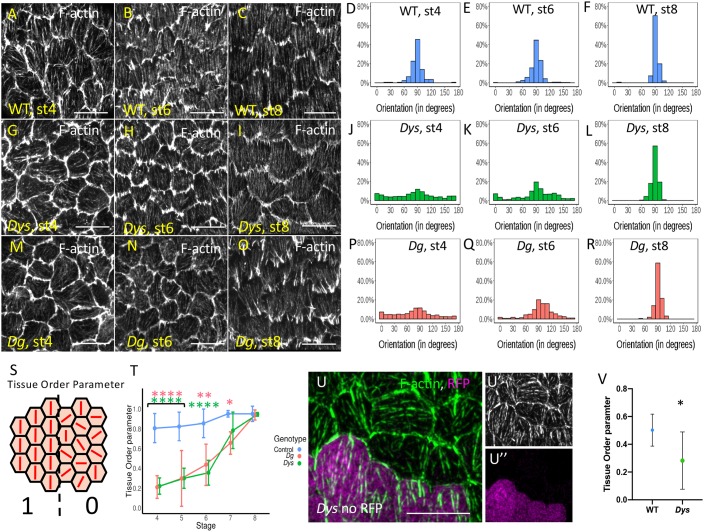
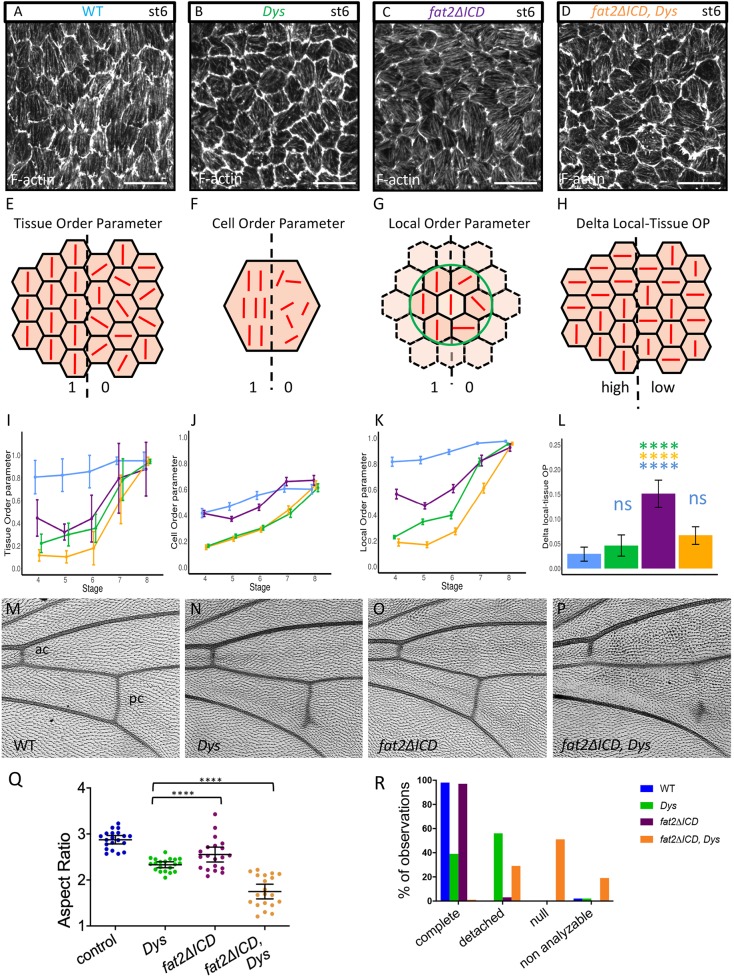
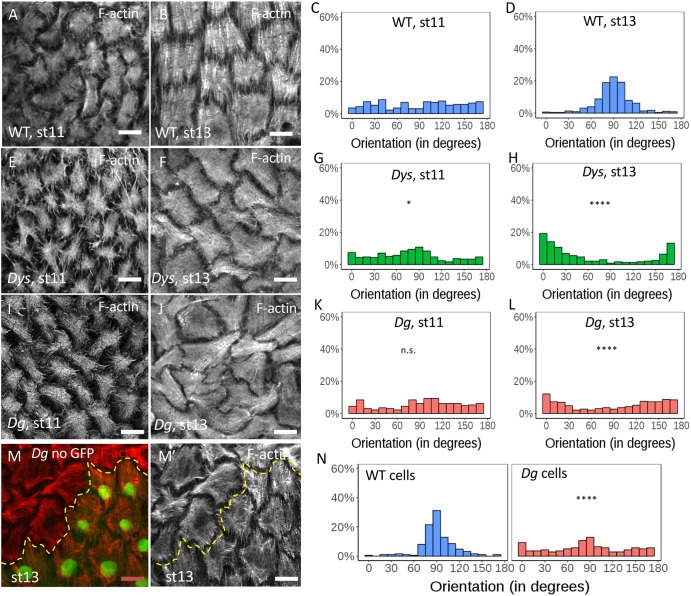
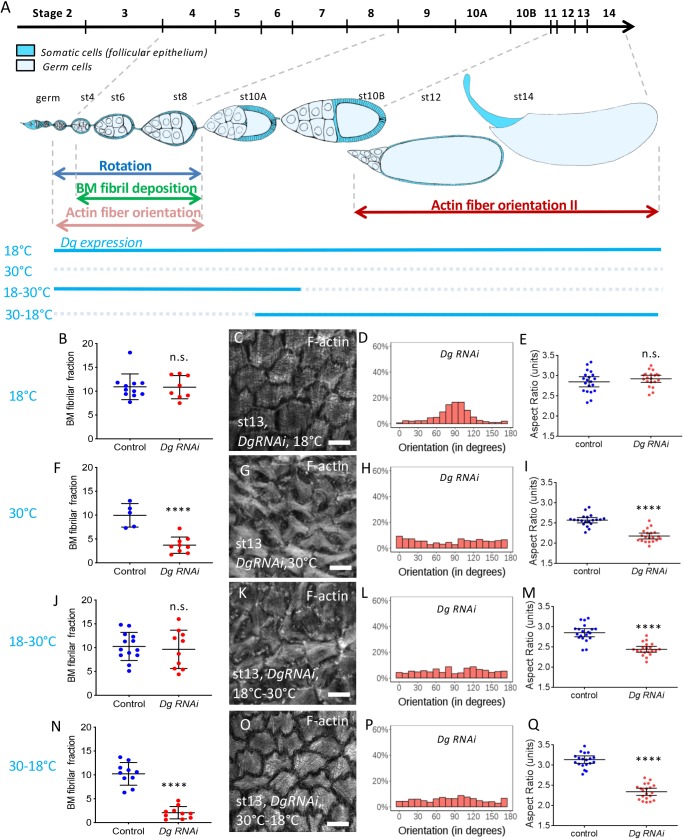
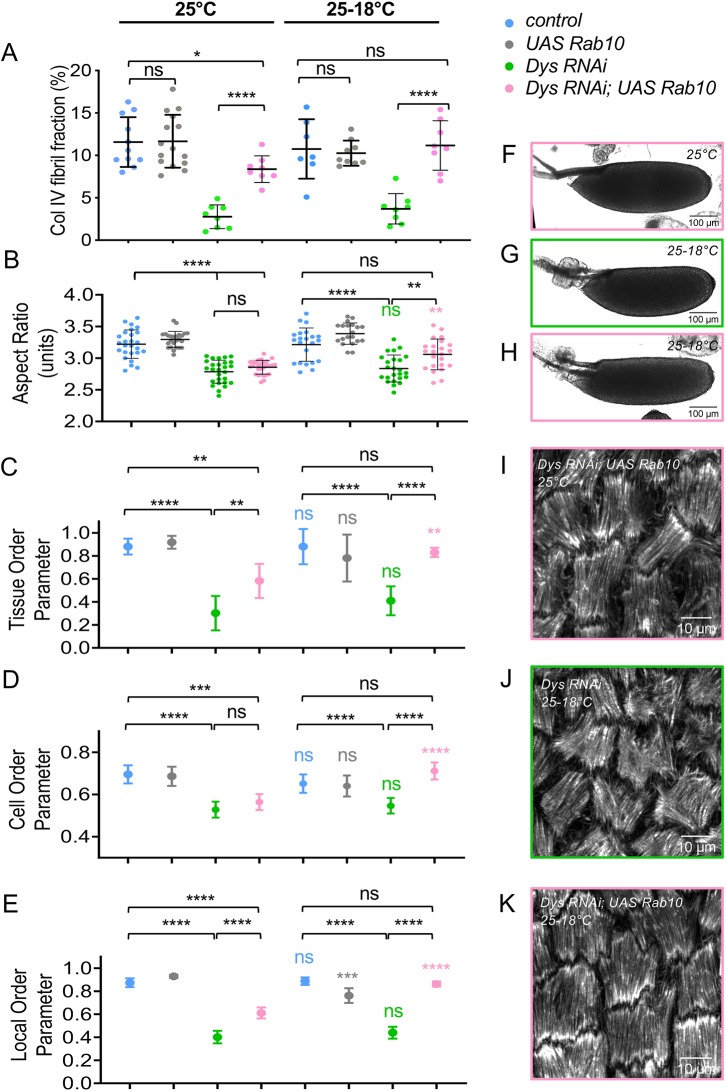
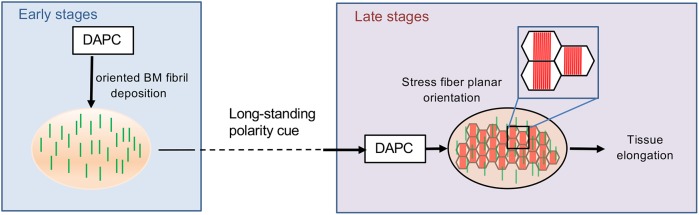
How extracellular matrix contributes to tissue morphogenesis is still an open question. In the Drosophila ovarian follicle, it has been proposed that after Fat2-dependent planar polarization of the follicle cell basal domain, oriented basement membrane (BM) fibrils and F-actin stress fibers constrain follicle growth, promoting its axial elongation. However, the relationship between BM fibrils and stress fibers and their respective impact on elongation are unclear. We found that Dystroglycan (Dg) and Dystrophin (Dys) are involved in BM fibril deposition. Moreover, they also orient stress fibers, by acting locally and in parallel to Fat2. Importantly, Dg-Dys complex-mediated cell-autonomous control of F-actin fiber orientation relies on the preceding BM fibril deposition, indicating two distinct but interdependent functions. Thus, the Dg-Dys complex works as a crucial organizer of the epithelial basal domain, regulating both F-actin and BM. Furthermore, BM fibrils act as a persistent cue for the orientation of stress fibers that are the main effector of elongation.

Keywords: Basement membrane; Drosophila; Dystroglycan; Dystrophin; Extracellular matrix; Morphogenesis; Planar cell polarity; Tissue elongation.


Conflict of interest statement

Competing interestsThe authors declare no competing or financial interests.

Figures

Fig. 1.
Fig. 1.
The DAPC is involved in follicle elongation but not rotation. (A) Scheme of an ovariole with the main events involved in follicle elongation. The top line indicates the time scale of the different developmental stages. The ovariole is oriented anterior to posterior (germ, germarium). Each follicle is composed of a germline cyst surrounded by the follicular epithelium. Rotation occurs from very early to stage 8. It promotes F-actin fiber orientation and allows polarized BM fibril deposition, both perpendicularly to the elongation axis. At stage 11, actin fibers lose their orientation and then progressively reorient (orientation II). (B-D) Representative mature eggs from WT (B), DysE17/Exel6184 (C) and DgO46/O83 females (D). Scale bars: 100 μm. (E-G) Quantification of the length (E), the width (F) and the aspect-ratio (G) for mature eggs from WT, DysE17/ Exel6184, DgO46/O83 mutant and DysE17/ Exel6184; DgO46/O83 double-mutant females (n>18 eggs). (H) Elongation kinetics of WT, DysE17/Exel6184 and DgO46/O83 mutant follicles (n>6 follicles for each point, green asterisks for Dys, black asterisks for Dys and Dg). There are two series of value for stage 10, corresponding to stage 10A and 10B. (I-K′) Images of rotation movies of stage 7 WT (I,I′), DysE17/ Exel6184 (J,J′) and DgO46/O83 (K,K′) mutant follicles. Scale bars: 10 μm. (L) Rotation velocity of WT, DysE17/Exel6184 and DgO46/O83 mutant stage 7 follicles (n>8 follicles). For all panels, error bars represent s.d.; *P<0.01, **P<0.005, ***P<0.001, ****P<0.0001 (unpaired t-test). n.s., not significant.
Fig. 2.
Fig. 2.
The DAPC is important for BM fibril deposition. (A-B″) Basal view of WT (w1118) follicle ECM at stage 8 visualized with Pcan-RFP and ColIV-GFP (A) or Pcan-RFP and LanA-GFP (B). (C-E) Basal view of DysE17/Exel6184 follicles expressing Pcan-RFP (C), ColIV-GFP (D) and LanA-GFP (E). (F-H) Quantification of the BM fibril fraction (F), fibril numbers (G) and fibril length (H) at stage 8 in WT, DysE17/Exel6184 and DgO86/O43 mutant follicles (n>10 follicles). (I,I′) Mutant clones for DysExel6184 marked by the absence of RFP and stained to detect pericellular ColIV. Dashed line indicates the border between WT and mutant cells. (J) Quantification of pericellular ColIV intensity around WT and Dys mutant cells (n>20 cells). (K,L) Accumulation of pericellular LanA in fat2 (K) and fat2, Dys (L) mutant follicles. For all panels, error bars represent s.d.; ****P<0.0001 (unpaired t-test). n.s., not significant. Scale bars: 10 µm.
Fig. 3.
Fig. 3.
Stress fiber orientation delay in DAPC mutants during early stages. (A-R) Representative images of basal F-actin in WT (w1118) (A-C), DysE17/Exe6184 (G-I) and DgO86/O43 (M-O) follicles at stage 4, 6 and 8 and quantification of the corresponding angular distribution (D-F,J-L,P-R). (S) Illustration of Tissue OP: if all the cells have the same orientation Tissue OP is equal to one, if orientation is random Tissue OP is equal to zero. (T) Tissue OP analysis of control, DysE17/Exel6184 and DgO46/O83 follicles. A two-way ANOVA was performed, followed by applicable post-hoc pairwise comparisons (Tukey). (U-U″) F-actin in a mutant clone for DysExel6184 marked by the absence of RFP (purple) at stage 5. Note the cell-autonomous effect on stress fiber orientation. (V) Tissue OP quantification DysExel6184 mutant clones and surrounding WT cells at stage 5. Error bars represent s.d. (n>7 follicles for each stage and each genotype). *P<0.01, **P<0.005, ****P<0.0001. Scale bars: 10 µm.
Fig. 4.
Fig. 4.
Genetic interaction between fat2 and Dys. (A-D) Representative images of stress fibers at stage 6 of WT (A), DysE17/Exel6184 mutant (B), fat2-DeltaICD mutant (C) and Dys, fat2-DeltaICD double mutant (D). Genotype color code is conserved on all panels. (E-H) Schemes explaining the different parameters that are analyzed in I-L: (E,I) Tissue OP (n>7 follicles for each stage and each genotype); (F,J) Cell OP; (G,K) Local OP; (H,L) difference between Local and Tissue OPs (n>171 cells for each stage and each genotype). (I-L) A two-way ANOVA was performed, followed by applicable post-hoc pairwise comparisons (Tukey). P-values between the different genotypes for I,J,K are indicated in Table S3. (M-P) Representative images of wing veins of WT (M), DysE17/Exel6184 mutant (N), fat2-DeltaICD mutant (O) and Dys, fat2-DeltaICD double mutant (P). ac, anterior crossvein; pc, posterior crossvein. (Q) Quantification of egg elongation for the indicated genotypes (n>20 eggs for each genotype, unpaired t-test). (R) Quantification of wing defects observed in the different genotypes on the pc. ‘Non analyzable’ corresponds to wrinkled or misfolded wings for which crossveins cannot be observed (n=40 wings). For all panels, error bars represent s.d.; ****P<0.0001. Scale bars: 10 µm.
Fig. 5.
Fig. 5.
Stress fiber orientation defect in DAPC mutants during late stages. (A-L) Representative images of basal F-actin in WT (A,B), DysE17/Exe6184 (E,F) and DgO86/O43(I,J) follicles at stages 11 and 13 and quantification of the corresponding angular distribution (C,D,G,H,K,L) (n>5 follicles). (M-N) Representative image of basal F-actin in Dg mutant clone marked by the absence of GFP (M,M′) and quantification of the corresponding angular distribution of stress fibers in the mutant cells and the neighboring WT cells (N) (n>5 clones ). Angular distribution was compared with that of WT at same stage (and statistically analyzed as described in the Materials and Methods); *P<0.01, ****P<0.0001. n.s., not significant. Scale bars: 10 µm.
Fig. 6.
Fig. 6.
The DAPC is required at two time frames for follicle elongation. (A) Scheme of an ovariole with the main events involved in follicle elongation. The top line indicates the time scale of the different developmental stages. The ovariole is oriented anterior to posterior (germ, germarium). The level of endogenous Dg is temporally controlled by the temperature (blue lines). (B,F,J,N) Quantification of the BM fibril fraction of Dg RNAi stage 12 follicles expressing ColIV-GFP in the indicated condition compared with control performed in the same temperature condition (n>5 follicles). (C,D,G,H,K,L,O,P) Representative images of basal F-actin of Dg RNAi stage 13 follicles in the indicated condition (C,G,K,O) and quantification of the corresponding angular distribution (D,H,L,P) (n>5 follicles). (E,I,M,Q) Aspect-ratio quantification of temporally controlled Dg RNAi mature compared with control performed in the same temperature condition (n>20 eggs). For all panels, error bars represent s.d.; ****P<0.0001 (unpaired t-test). n.s., not significant. Scale bars: 10 µm.
Fig. 7.
Fig. 7.
BM fibrils provide a cue for DAPC-dependent F-actin orientation. (A) Quantification of the BM fibril fraction at stage 8 for the indicated genotypes at 25°C (n>8). (B-E) For the indicated genotypes, without (25°C) or with (25-18°C) a switch to non-permissive temperature, quantification of the aspect-ratio of mature eggs (B), the Tissue-OP (n>7 follicles) (C), the Cell-OP (D), and the Local-OP at stage 13 (n>45 cells) (E). (A,B) unpaired t-test; (C-E) two-way ANOVA performed, followed by applicable post-hoc pairwise comparisons (Tukey). (F-K) Representative images of mature eggs (F-H) and of stress fibers (I-K) at stage 13 for the indicated genotypes without (25°C) or with (25-18°C) a switch to non-permissive temperature. For all panels, error bars represent s.d.; *P<0.01, **P<0.005, ***P<0.001, ****P<0.0001. Colored asterisks (or ns) correspond to the statistical test for the same genotype between 25°C and 25-18°C conditions. ns, not significant.
Fig. 8.
Fig. 8.
Dual function of the DAPC during elongation revealing that BM fibrils work as a persistent planar polarity cue. During the early stages (4-8) the DAPC participates in the formation of oriented BM fibrils perpendicular to the follicle elongation axis. These fibrils are maintained during follicle development including stages with intense morphogenetic processes unrelated to elongation (stages 9-11). At late stages, cells use the persistent BM fibrils as a signal to guide the planar orientation of the stress fibers. This event depends on a distinct second function of the DAPC. The stress fibers are the main mechanical effector of follicle elongation.

References

    1. Alégot H., Pouchin P., Bardot O. and Mirouse V. (2018). Jak-Stat pathway induces Drosophila follicle elongation by a gradient of apical contractility. Elife 7, e32943 10.7554/eLife.32943.034 - DOI - PMC - PubMed
    1. Aurich F. and Dahmann C. (2016). A mutation in fat2 uncouples tissue elongation from global tissue rotation. Cell Rep 14, 2503-2510. 10.1016/j.celrep.2016.02.044 - DOI - PubMed
    1. Barlan K., Cetera M. and Horne-Badovinac S. (2017). Fat2 and lar define a basally localized planar signaling system controlling collective cell migration. Dev. Cell 40, 467-477.e5. 10.1016/j.devcel.2017.02.003 - DOI - PMC - PubMed
    1. Barresi R. and Campbell K. P. (2006). Dystroglycan: from biosynthesis to pathogenesis of human disease. J. Cell Sci. 119, 199-207. 10.1242/jcs.02814 - DOI - PubMed
    1. Bateman J., Reddy R. S., Saito H. and Van Vactor D. (2001). The receptor tyrosine phosphatase Dlar and integrins organize actin filaments in the Drosophila follicular epithelium. Curr. Biol. 11, 1317-1327. 10.1016/S0960-9822(01)00420-1 - DOI - PubMed

Publication types

MeSH terms

LinkOut - more resources