Comment
. 2020 Jun 15;80(12):2484-2497.
doi: 10.1158/0008-5472.CAN-19-1892. Epub 2020 Mar 10.

TAp63-Regulated miRNAs Suppress Cutaneous Squamous Cell Carcinoma through Inhibition of a Network of Cell-Cycle Genes

Affiliations
Comment

TAp63-Regulated miRNAs Suppress Cutaneous Squamous Cell Carcinoma through Inhibition of a Network of Cell-Cycle Genes

Andrew John Davis et al. Cancer Res. .

Abstract

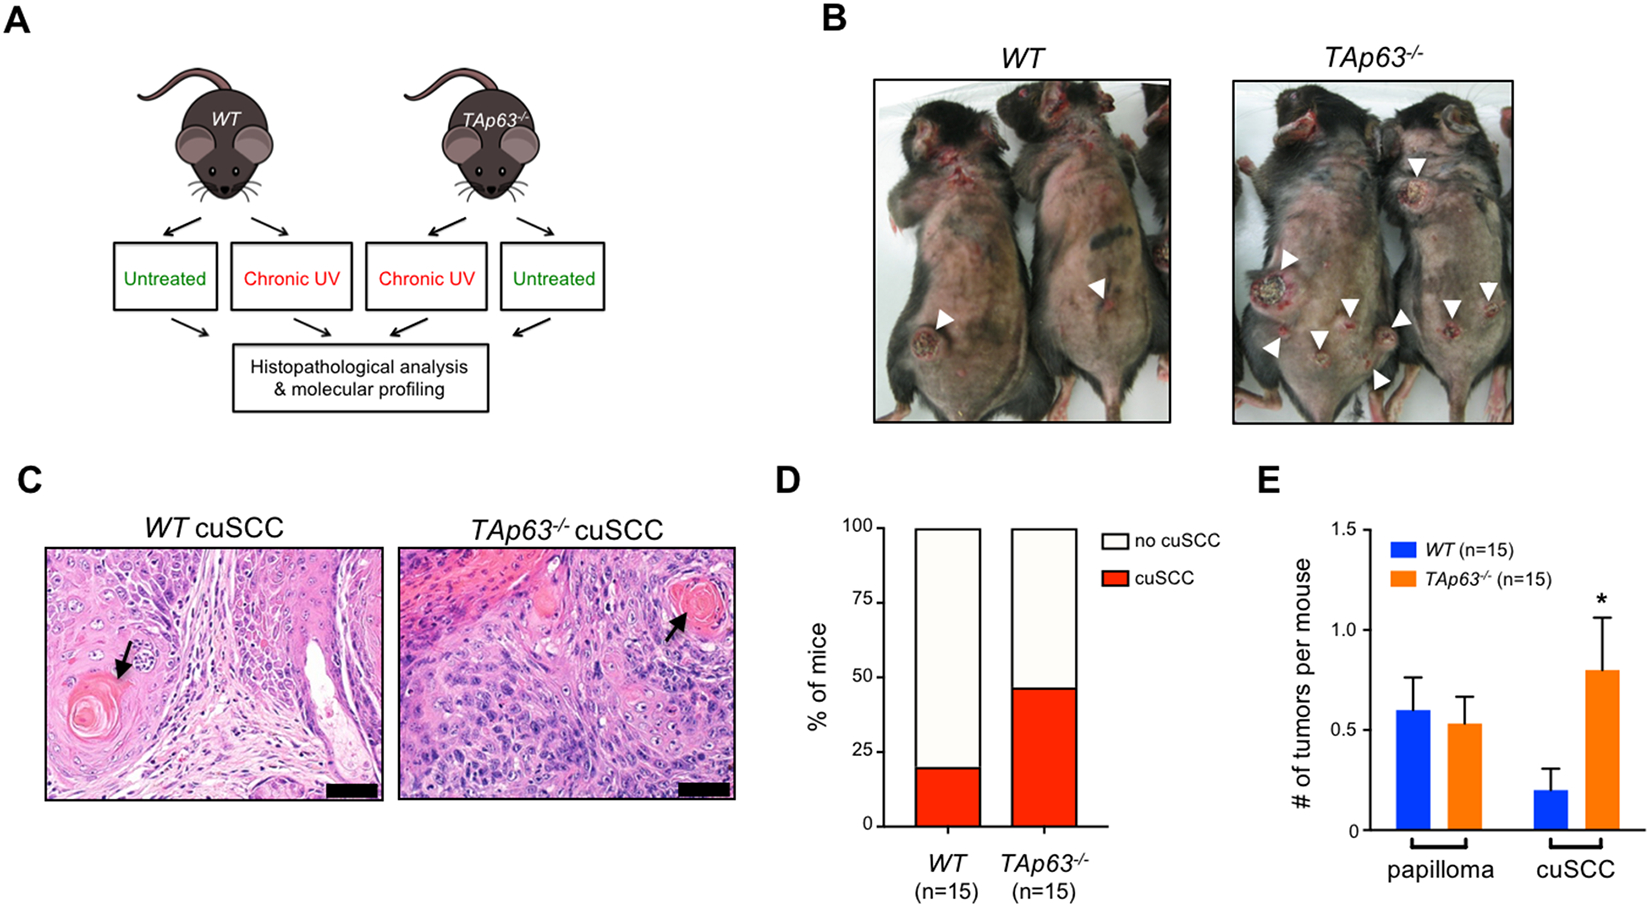
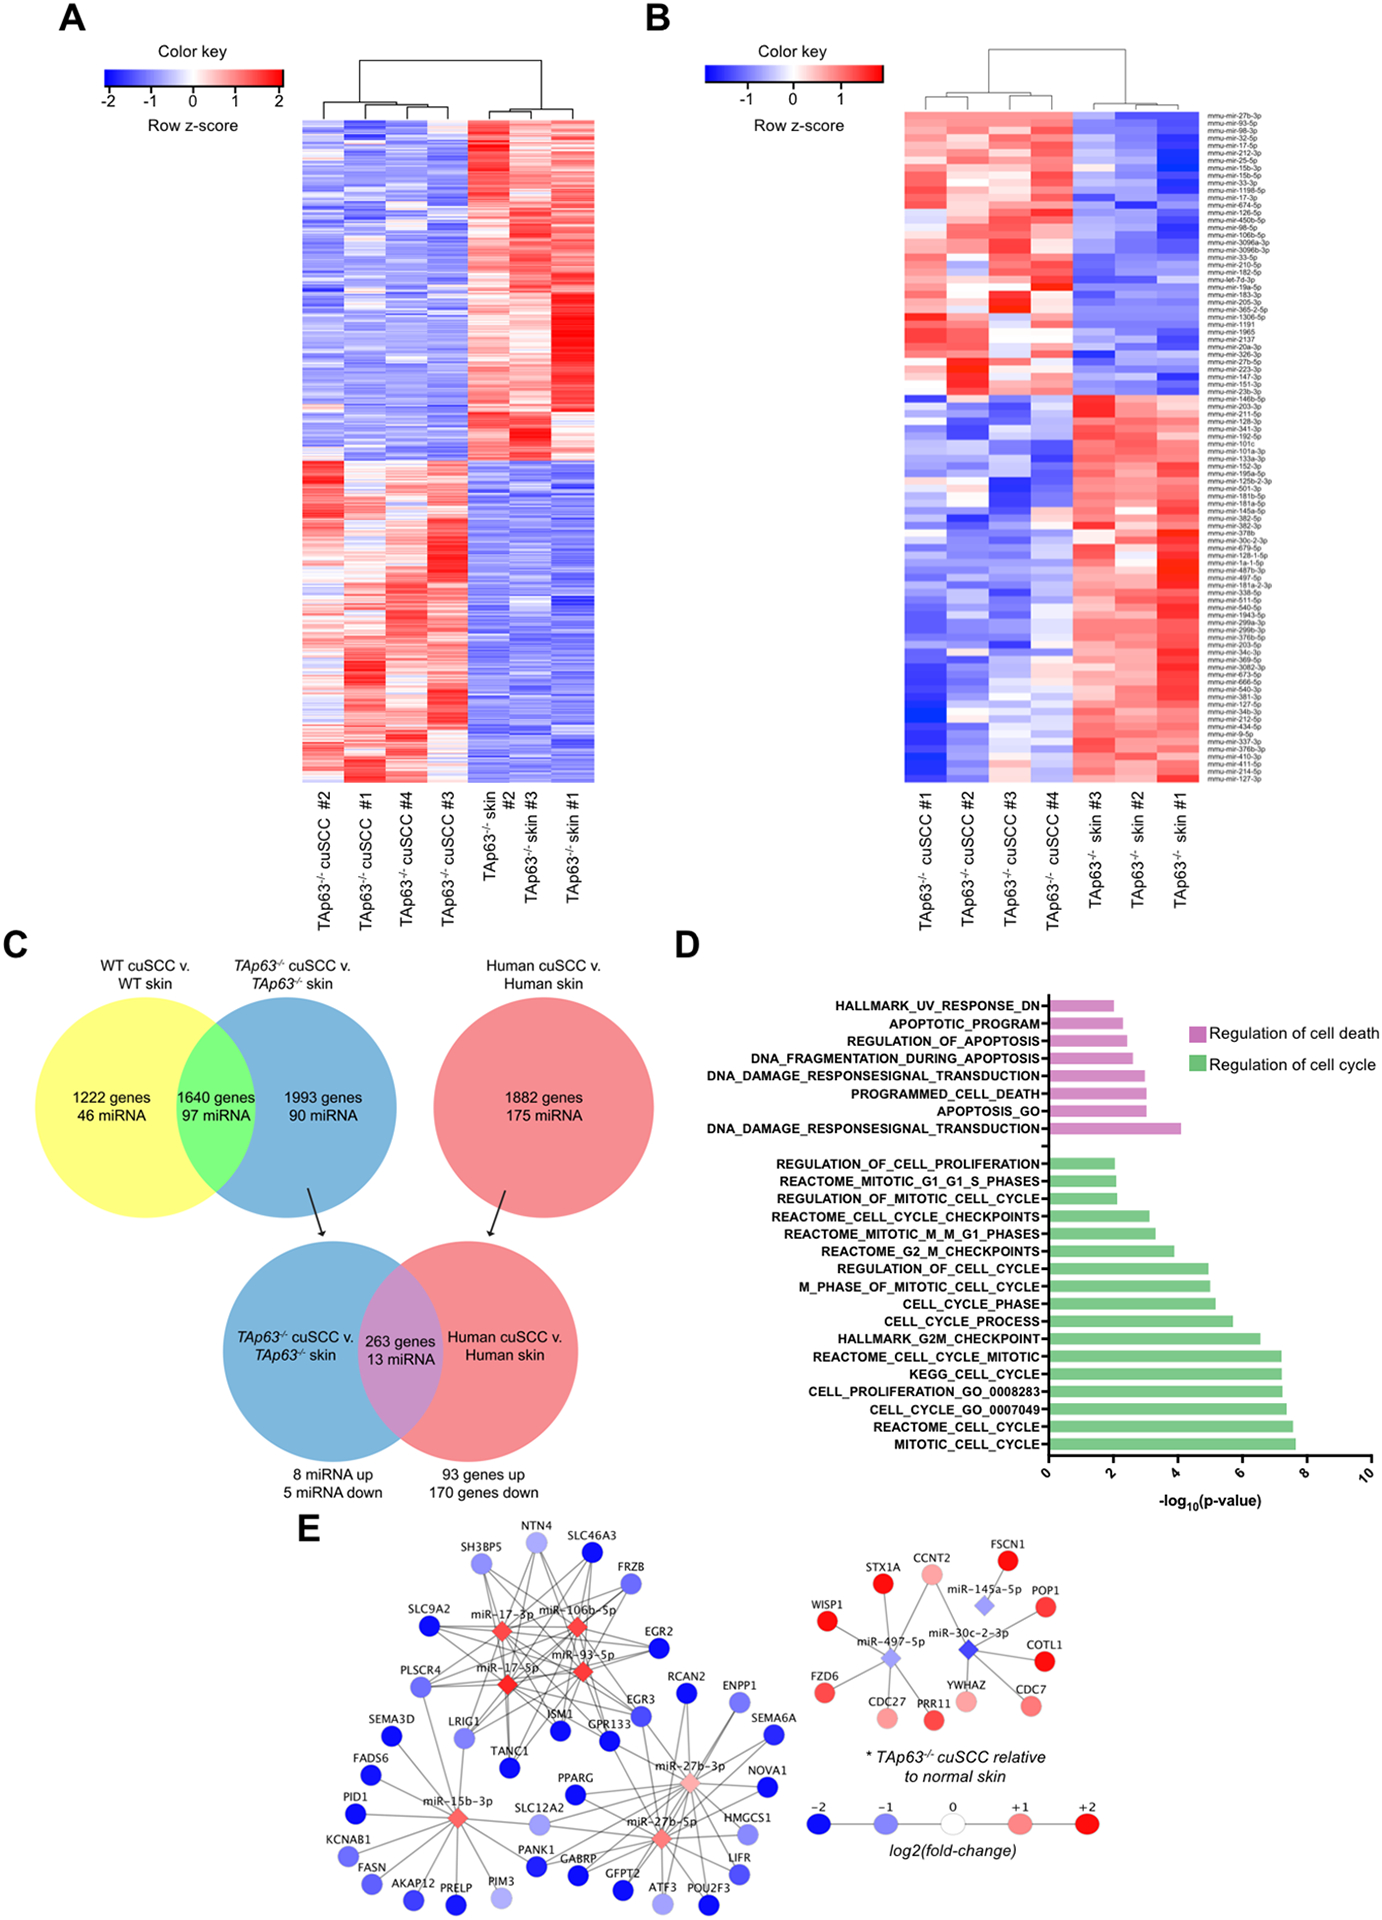
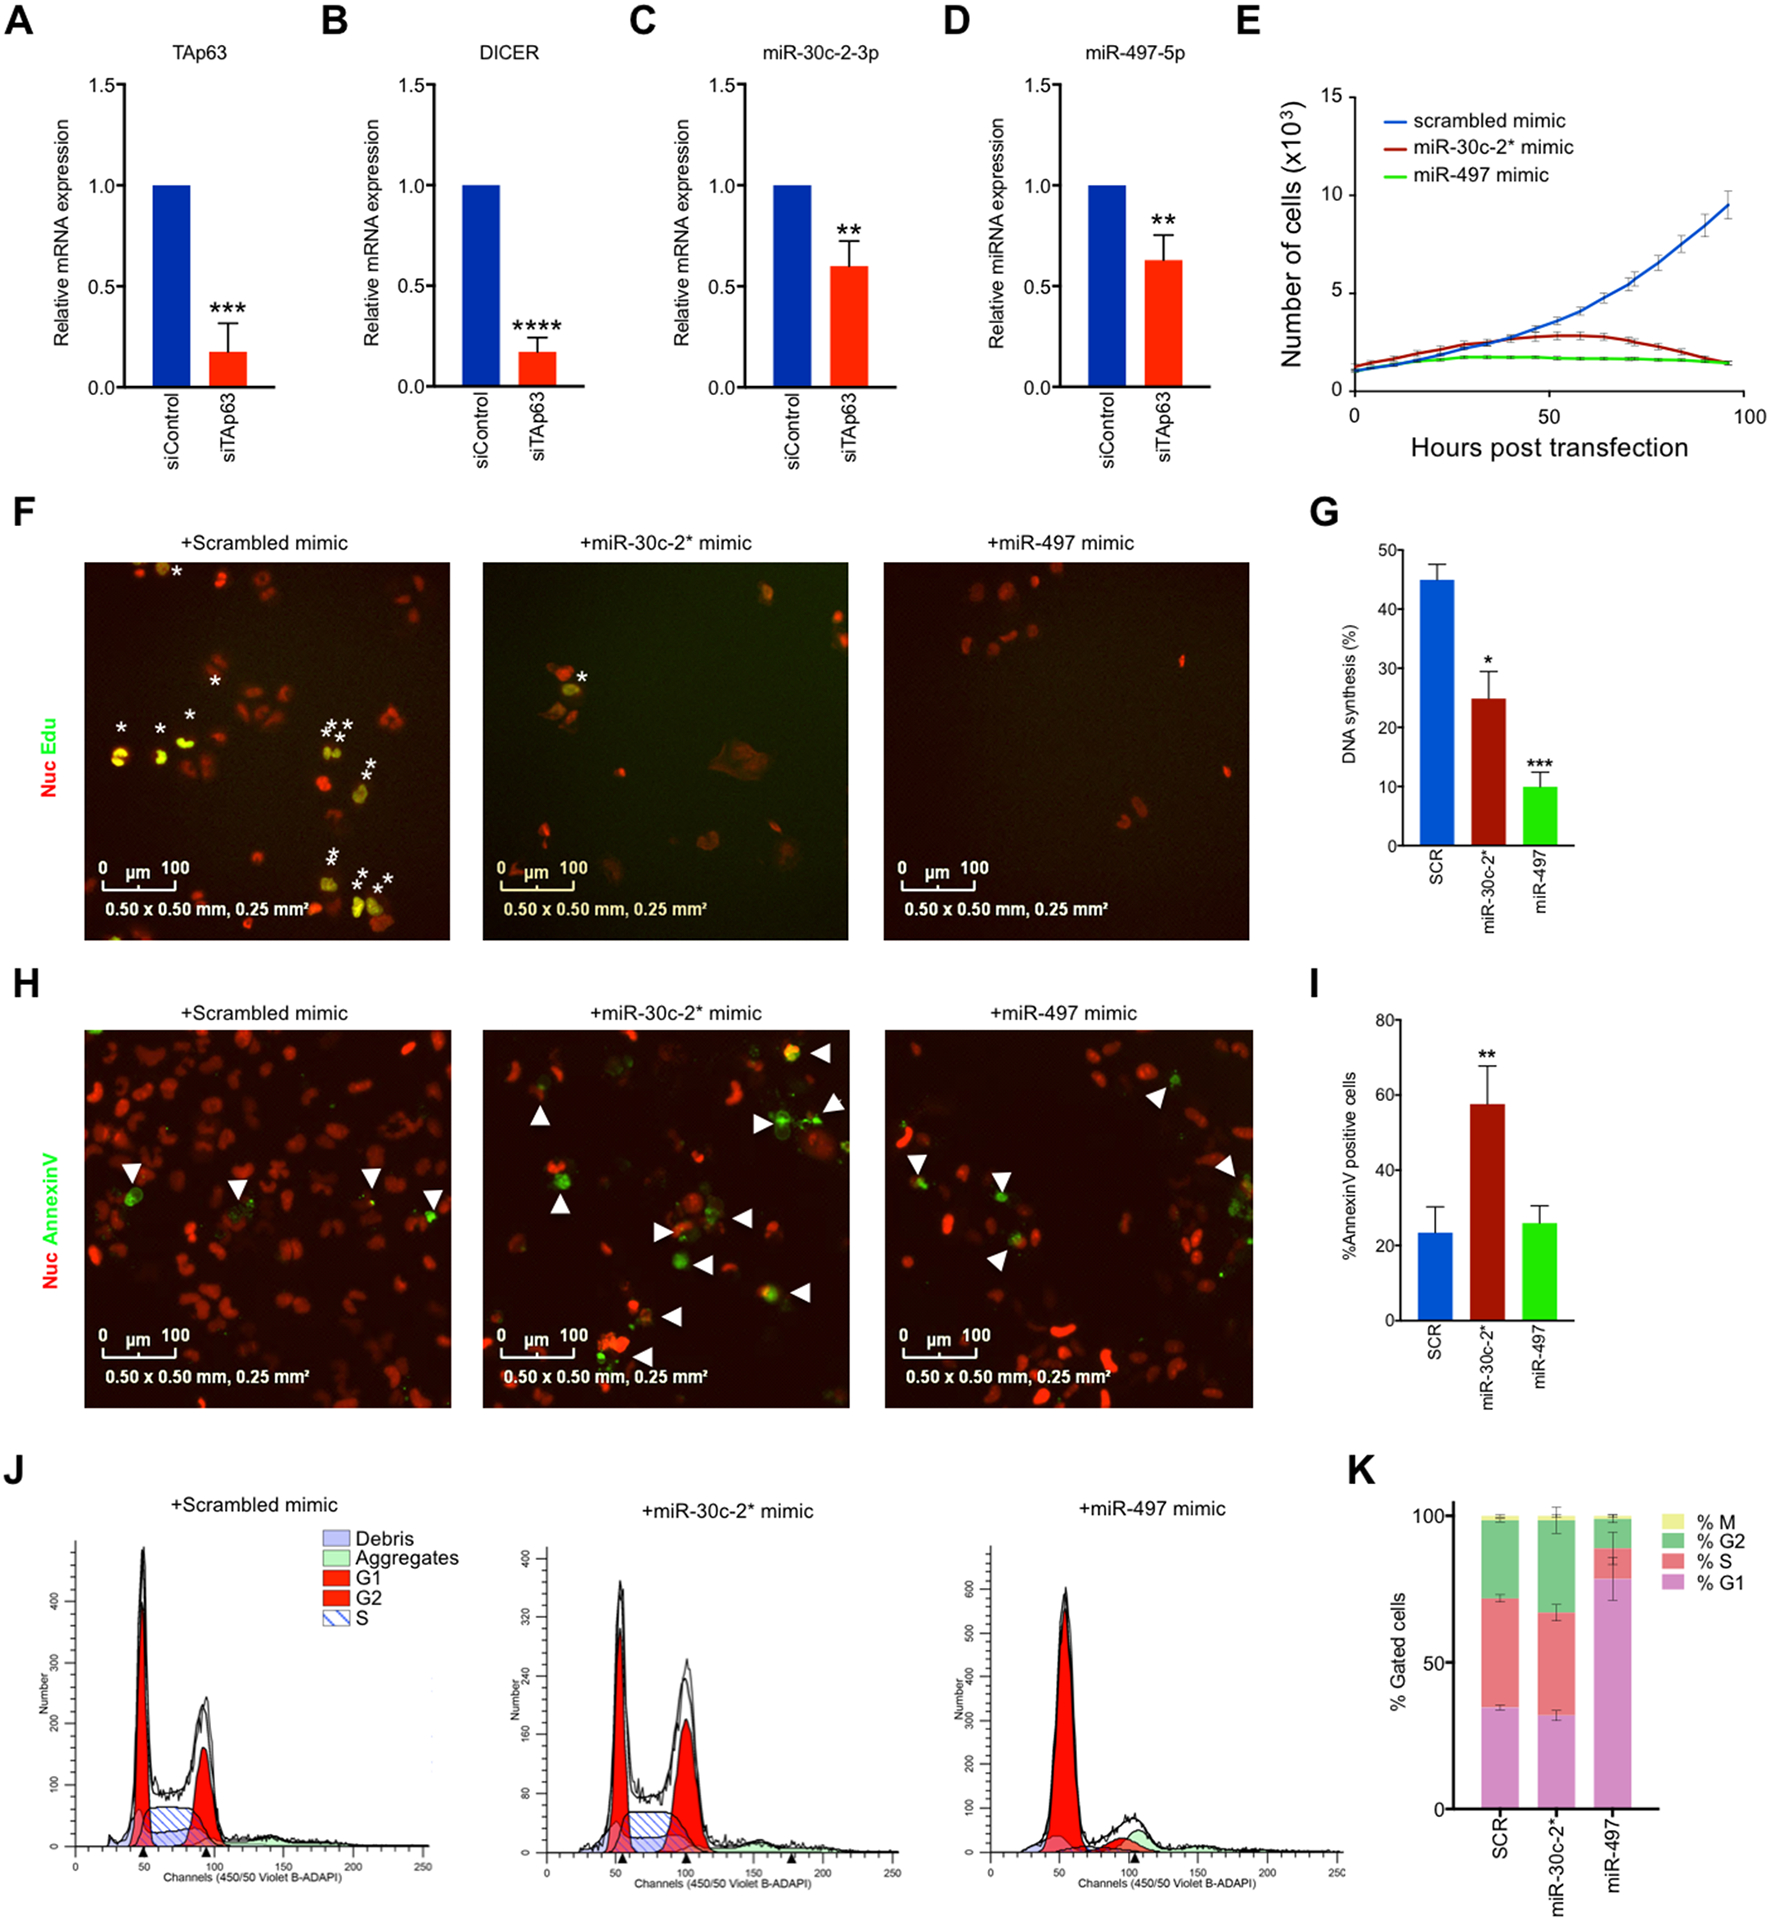
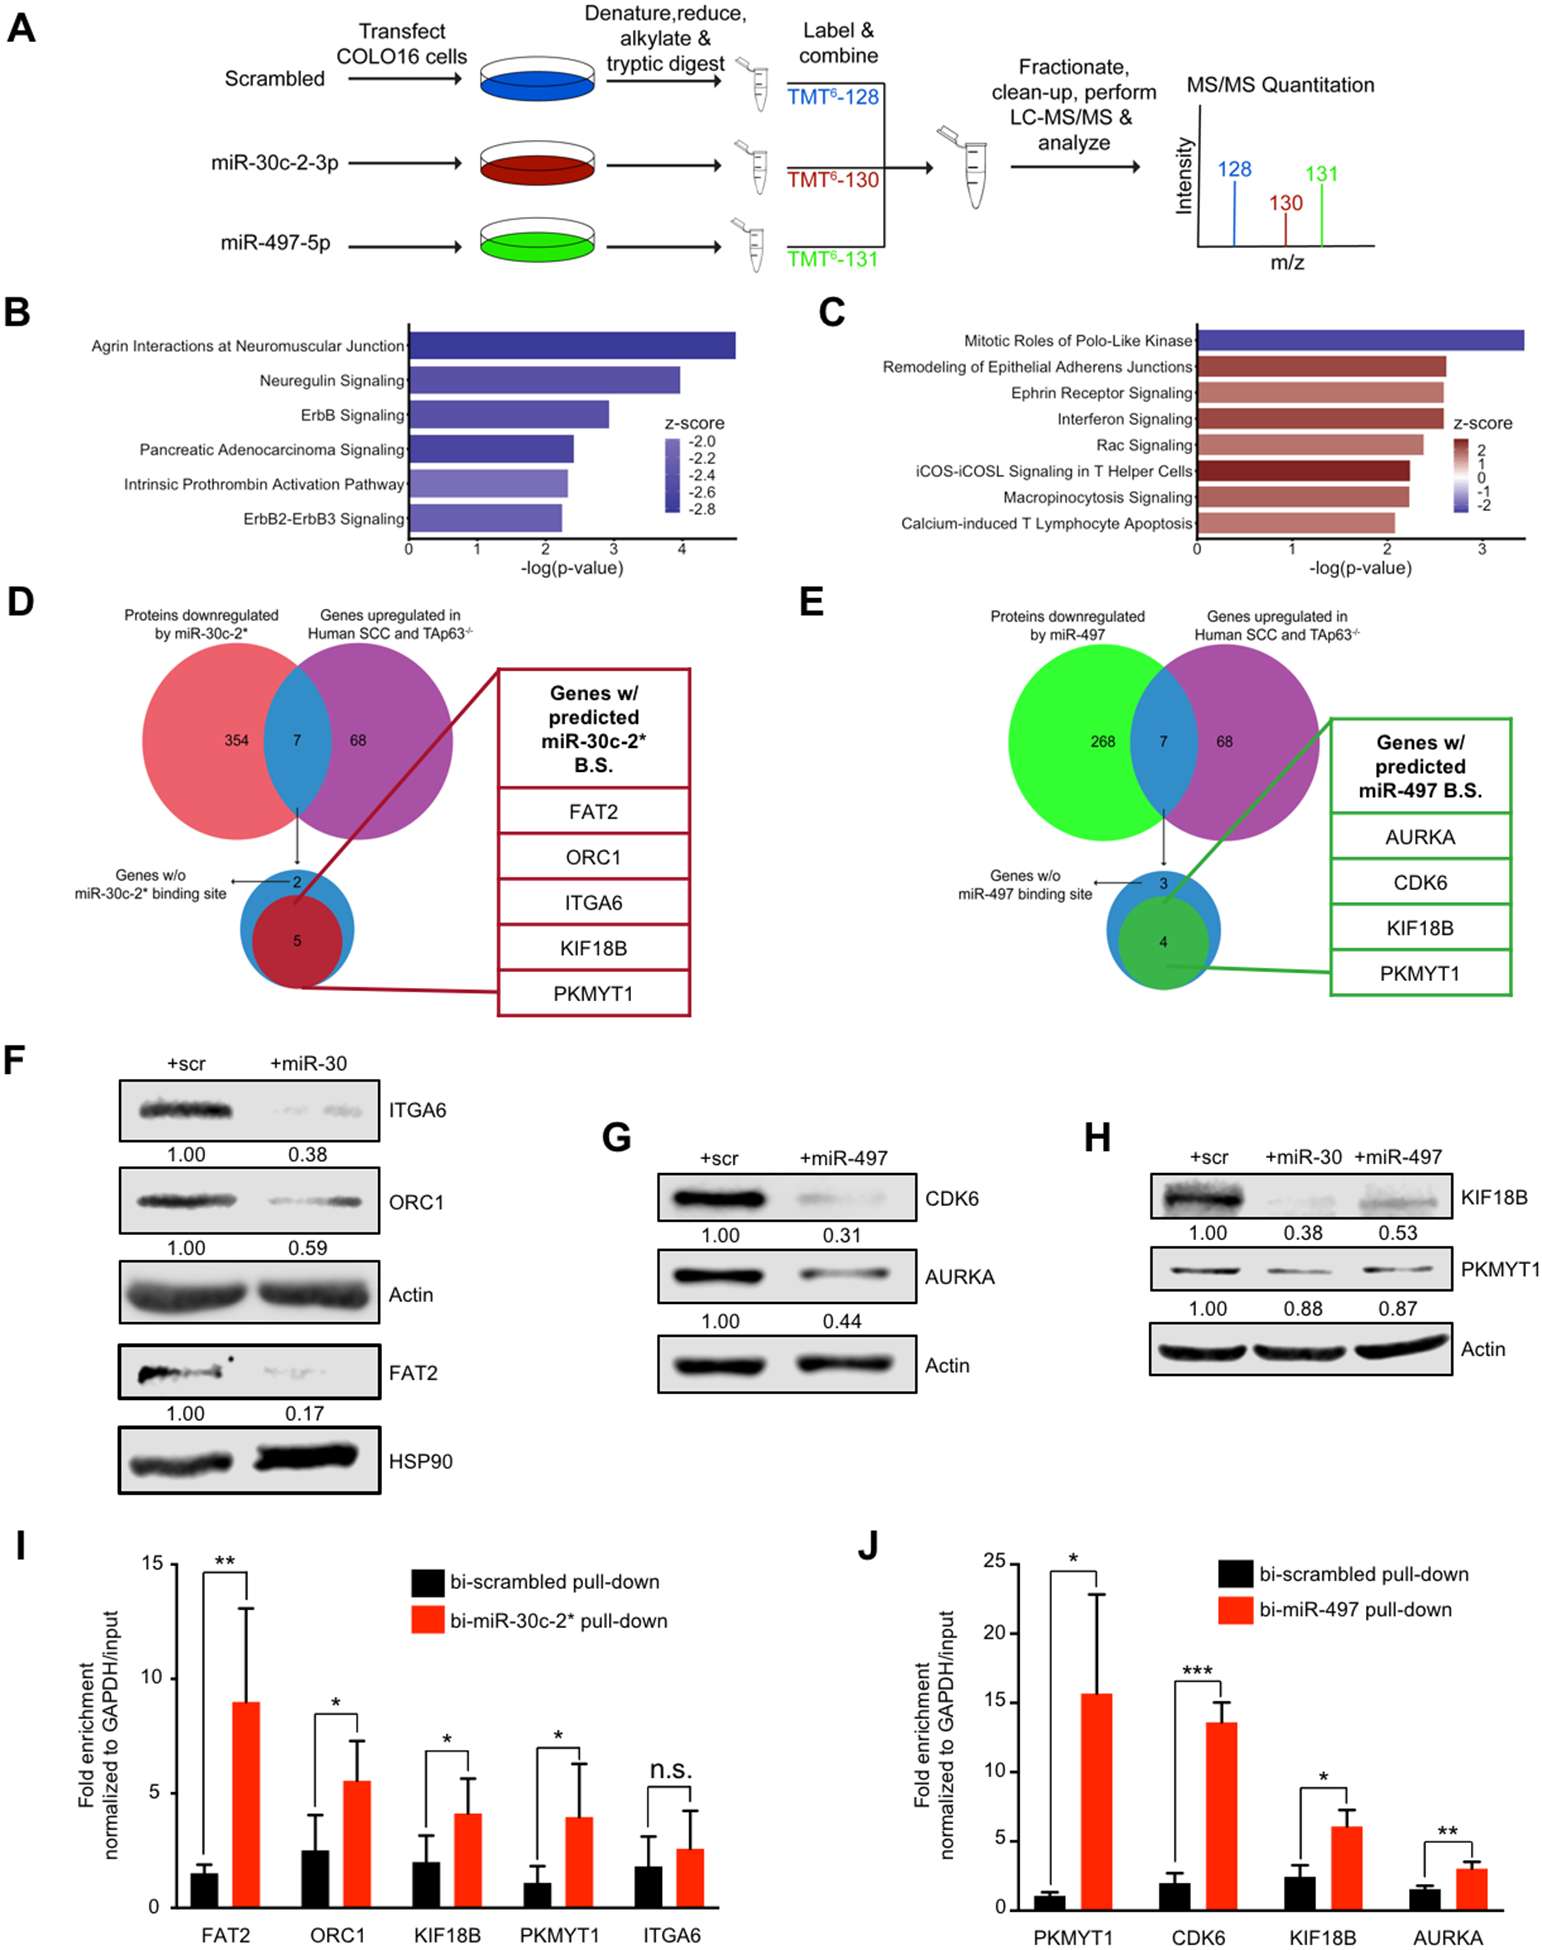
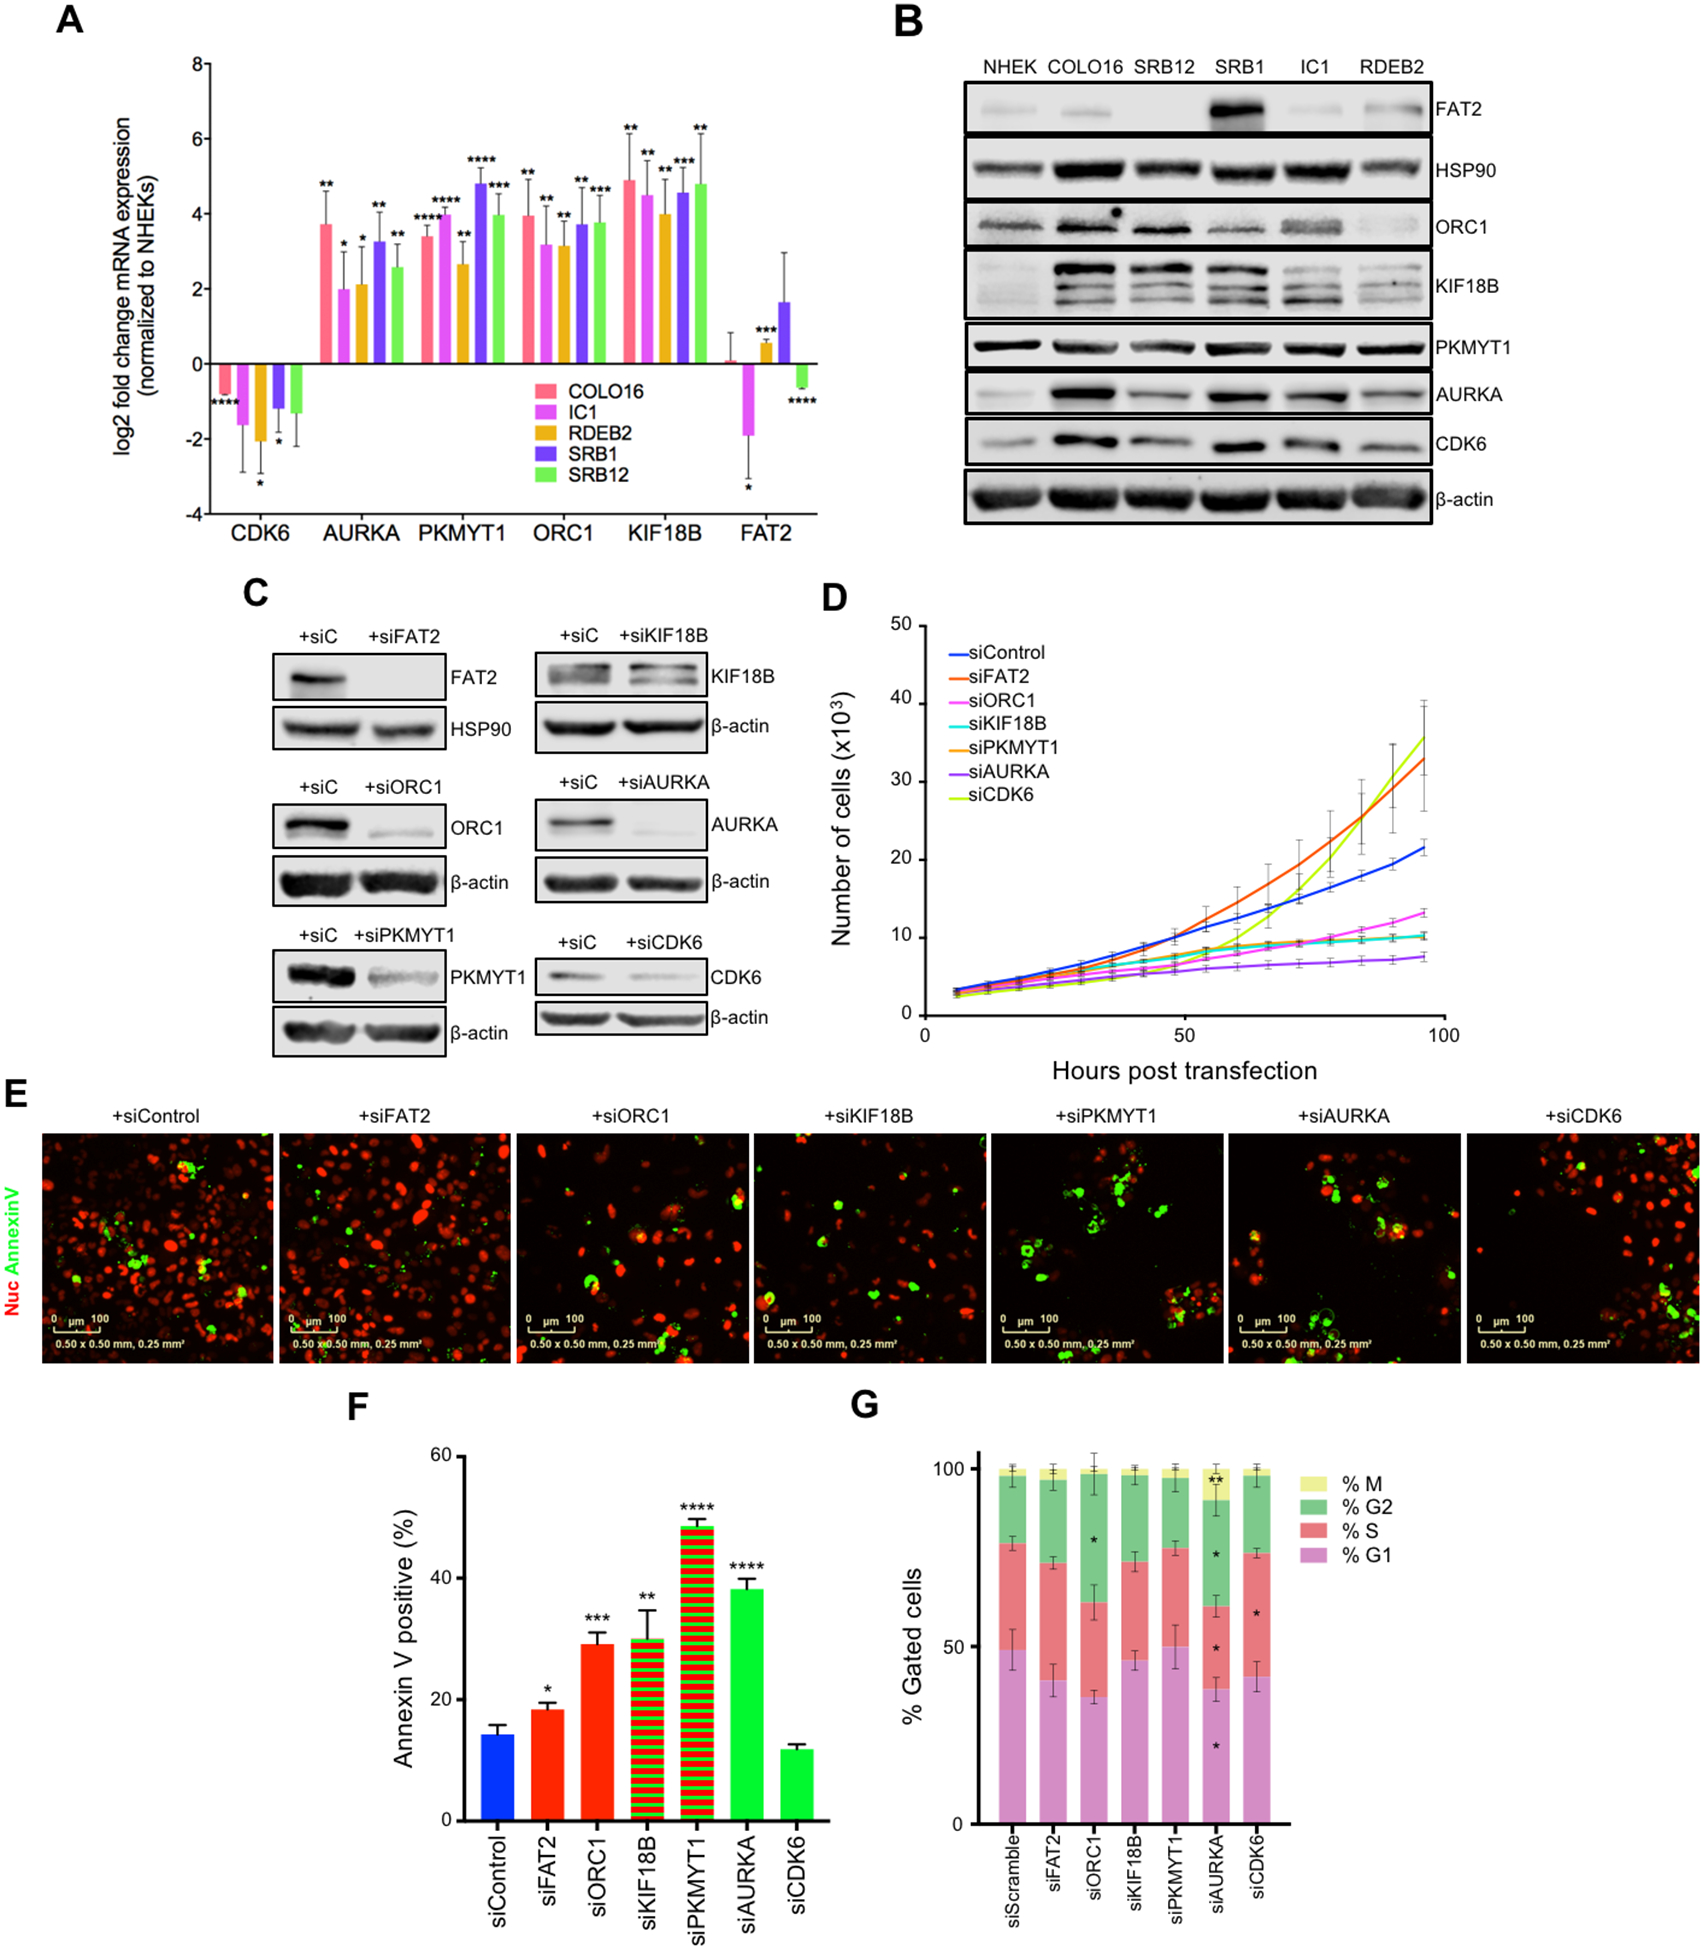
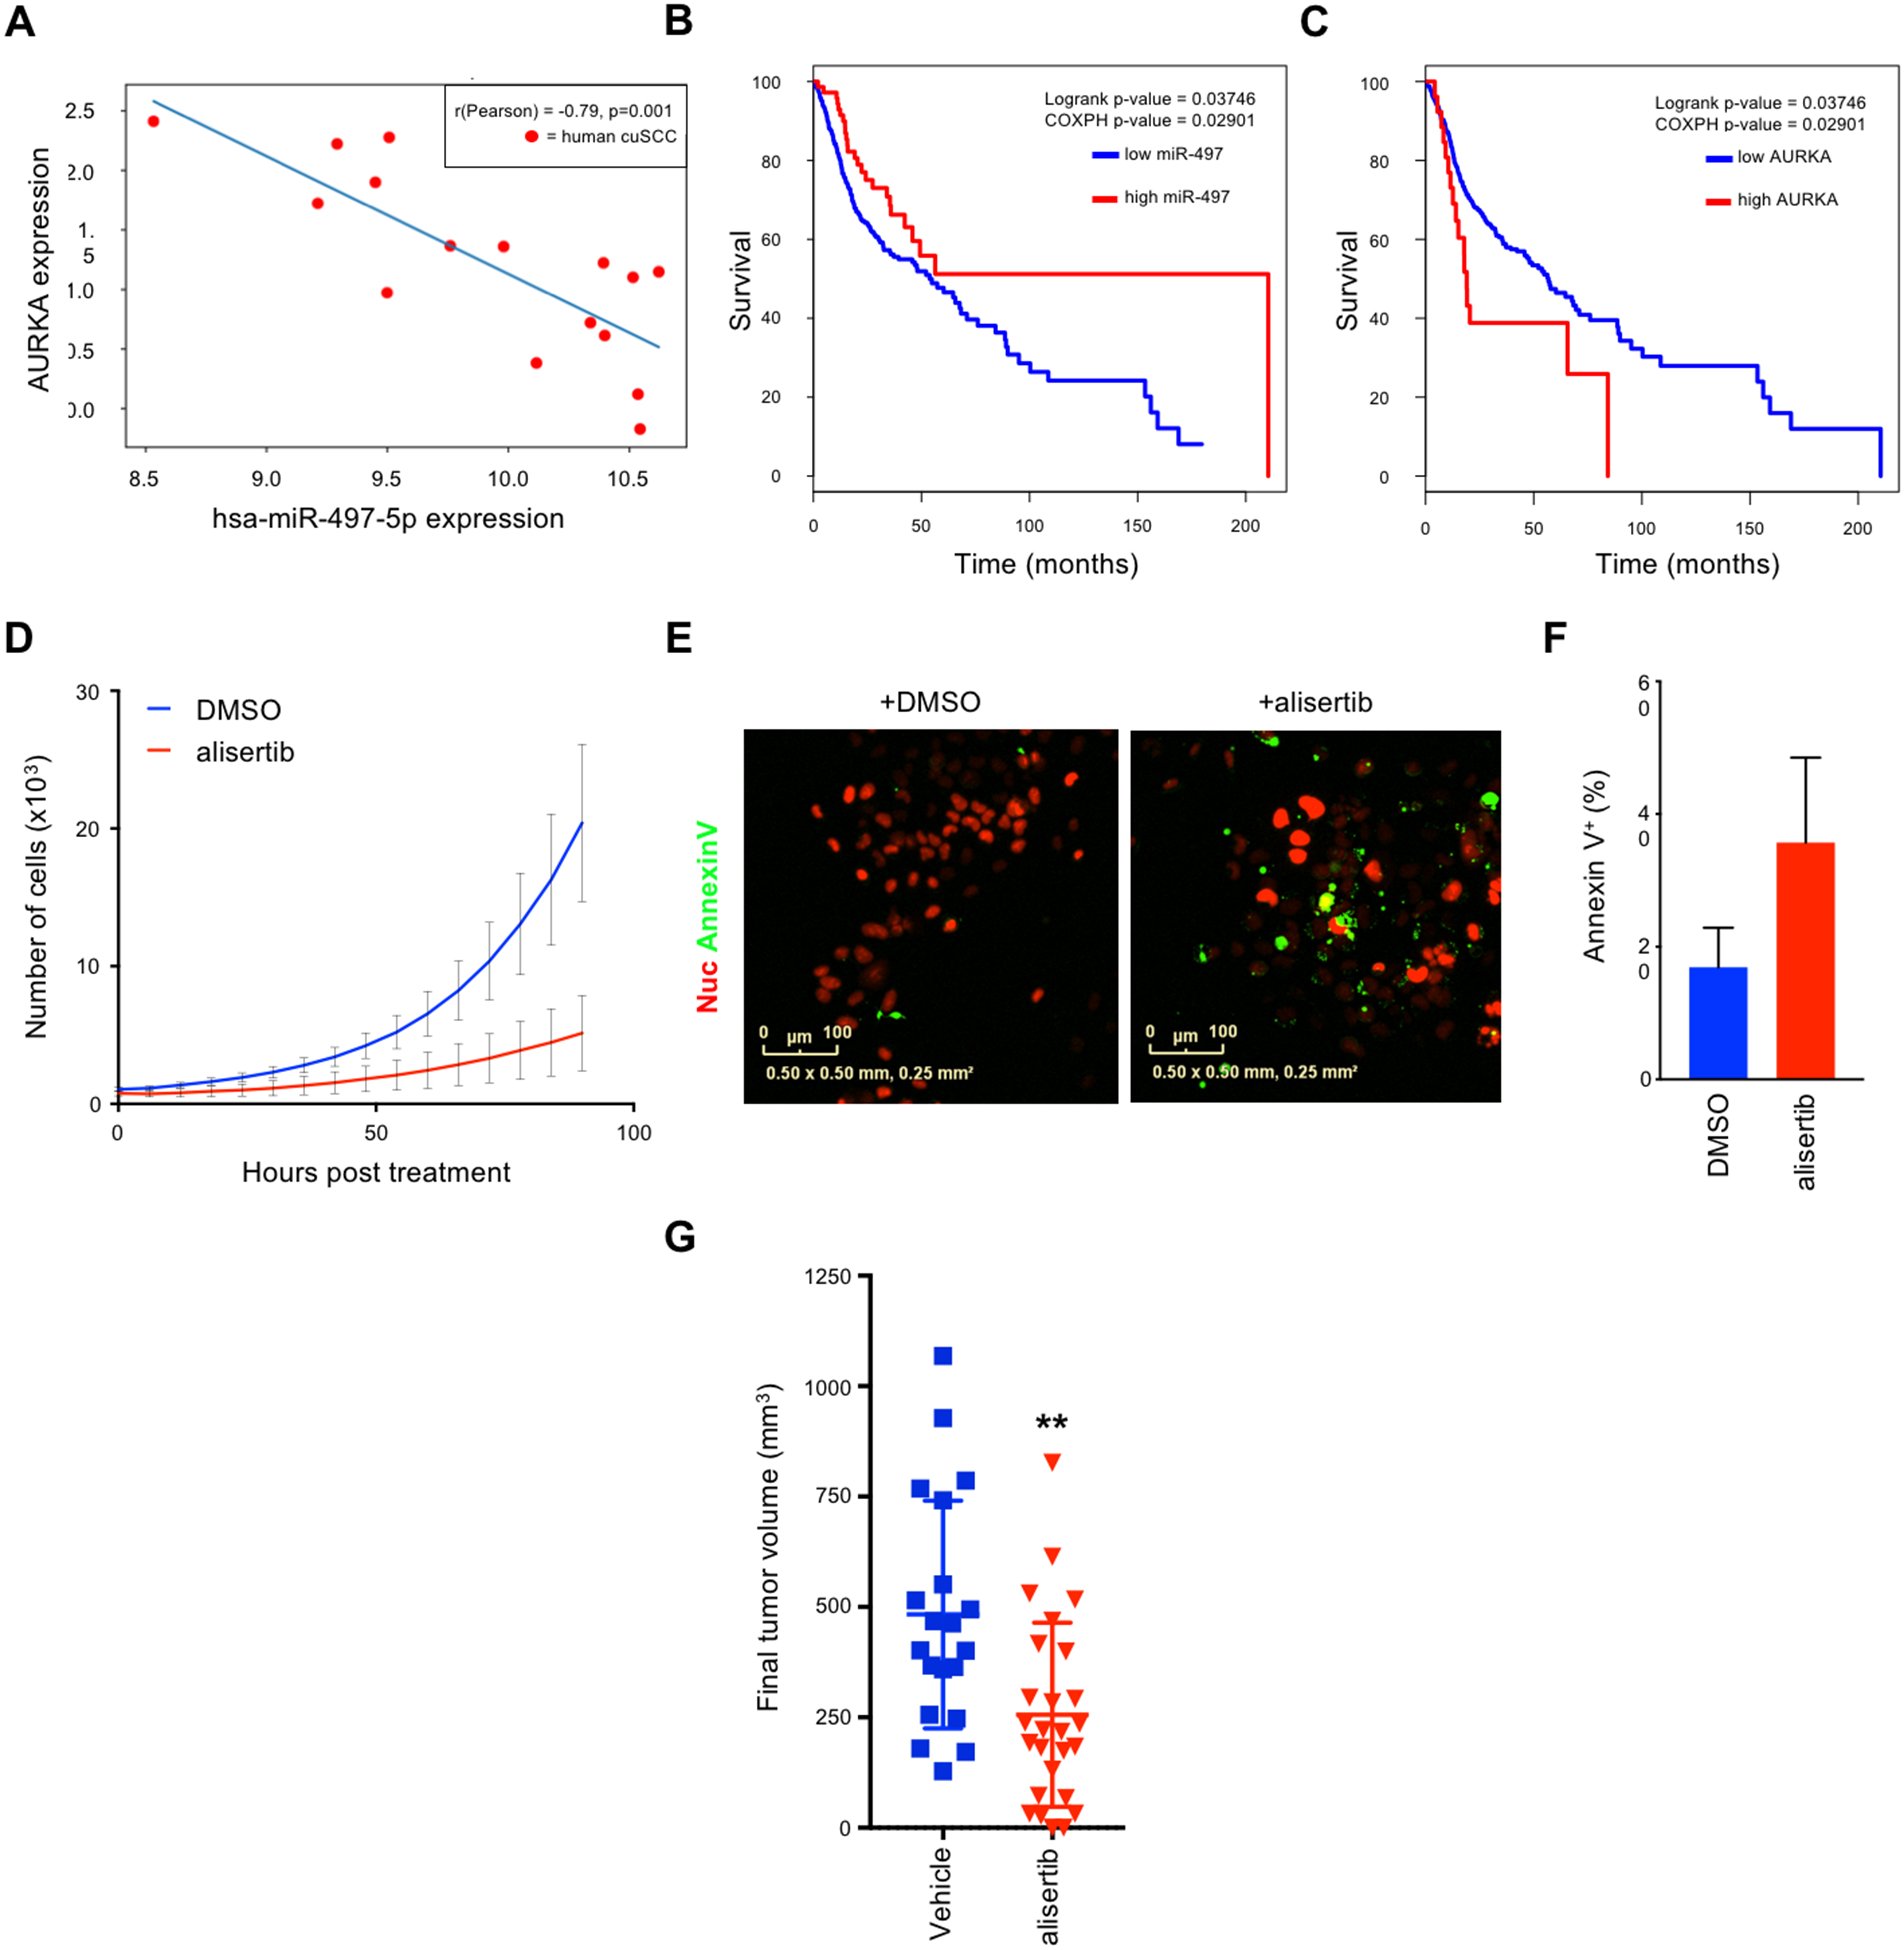
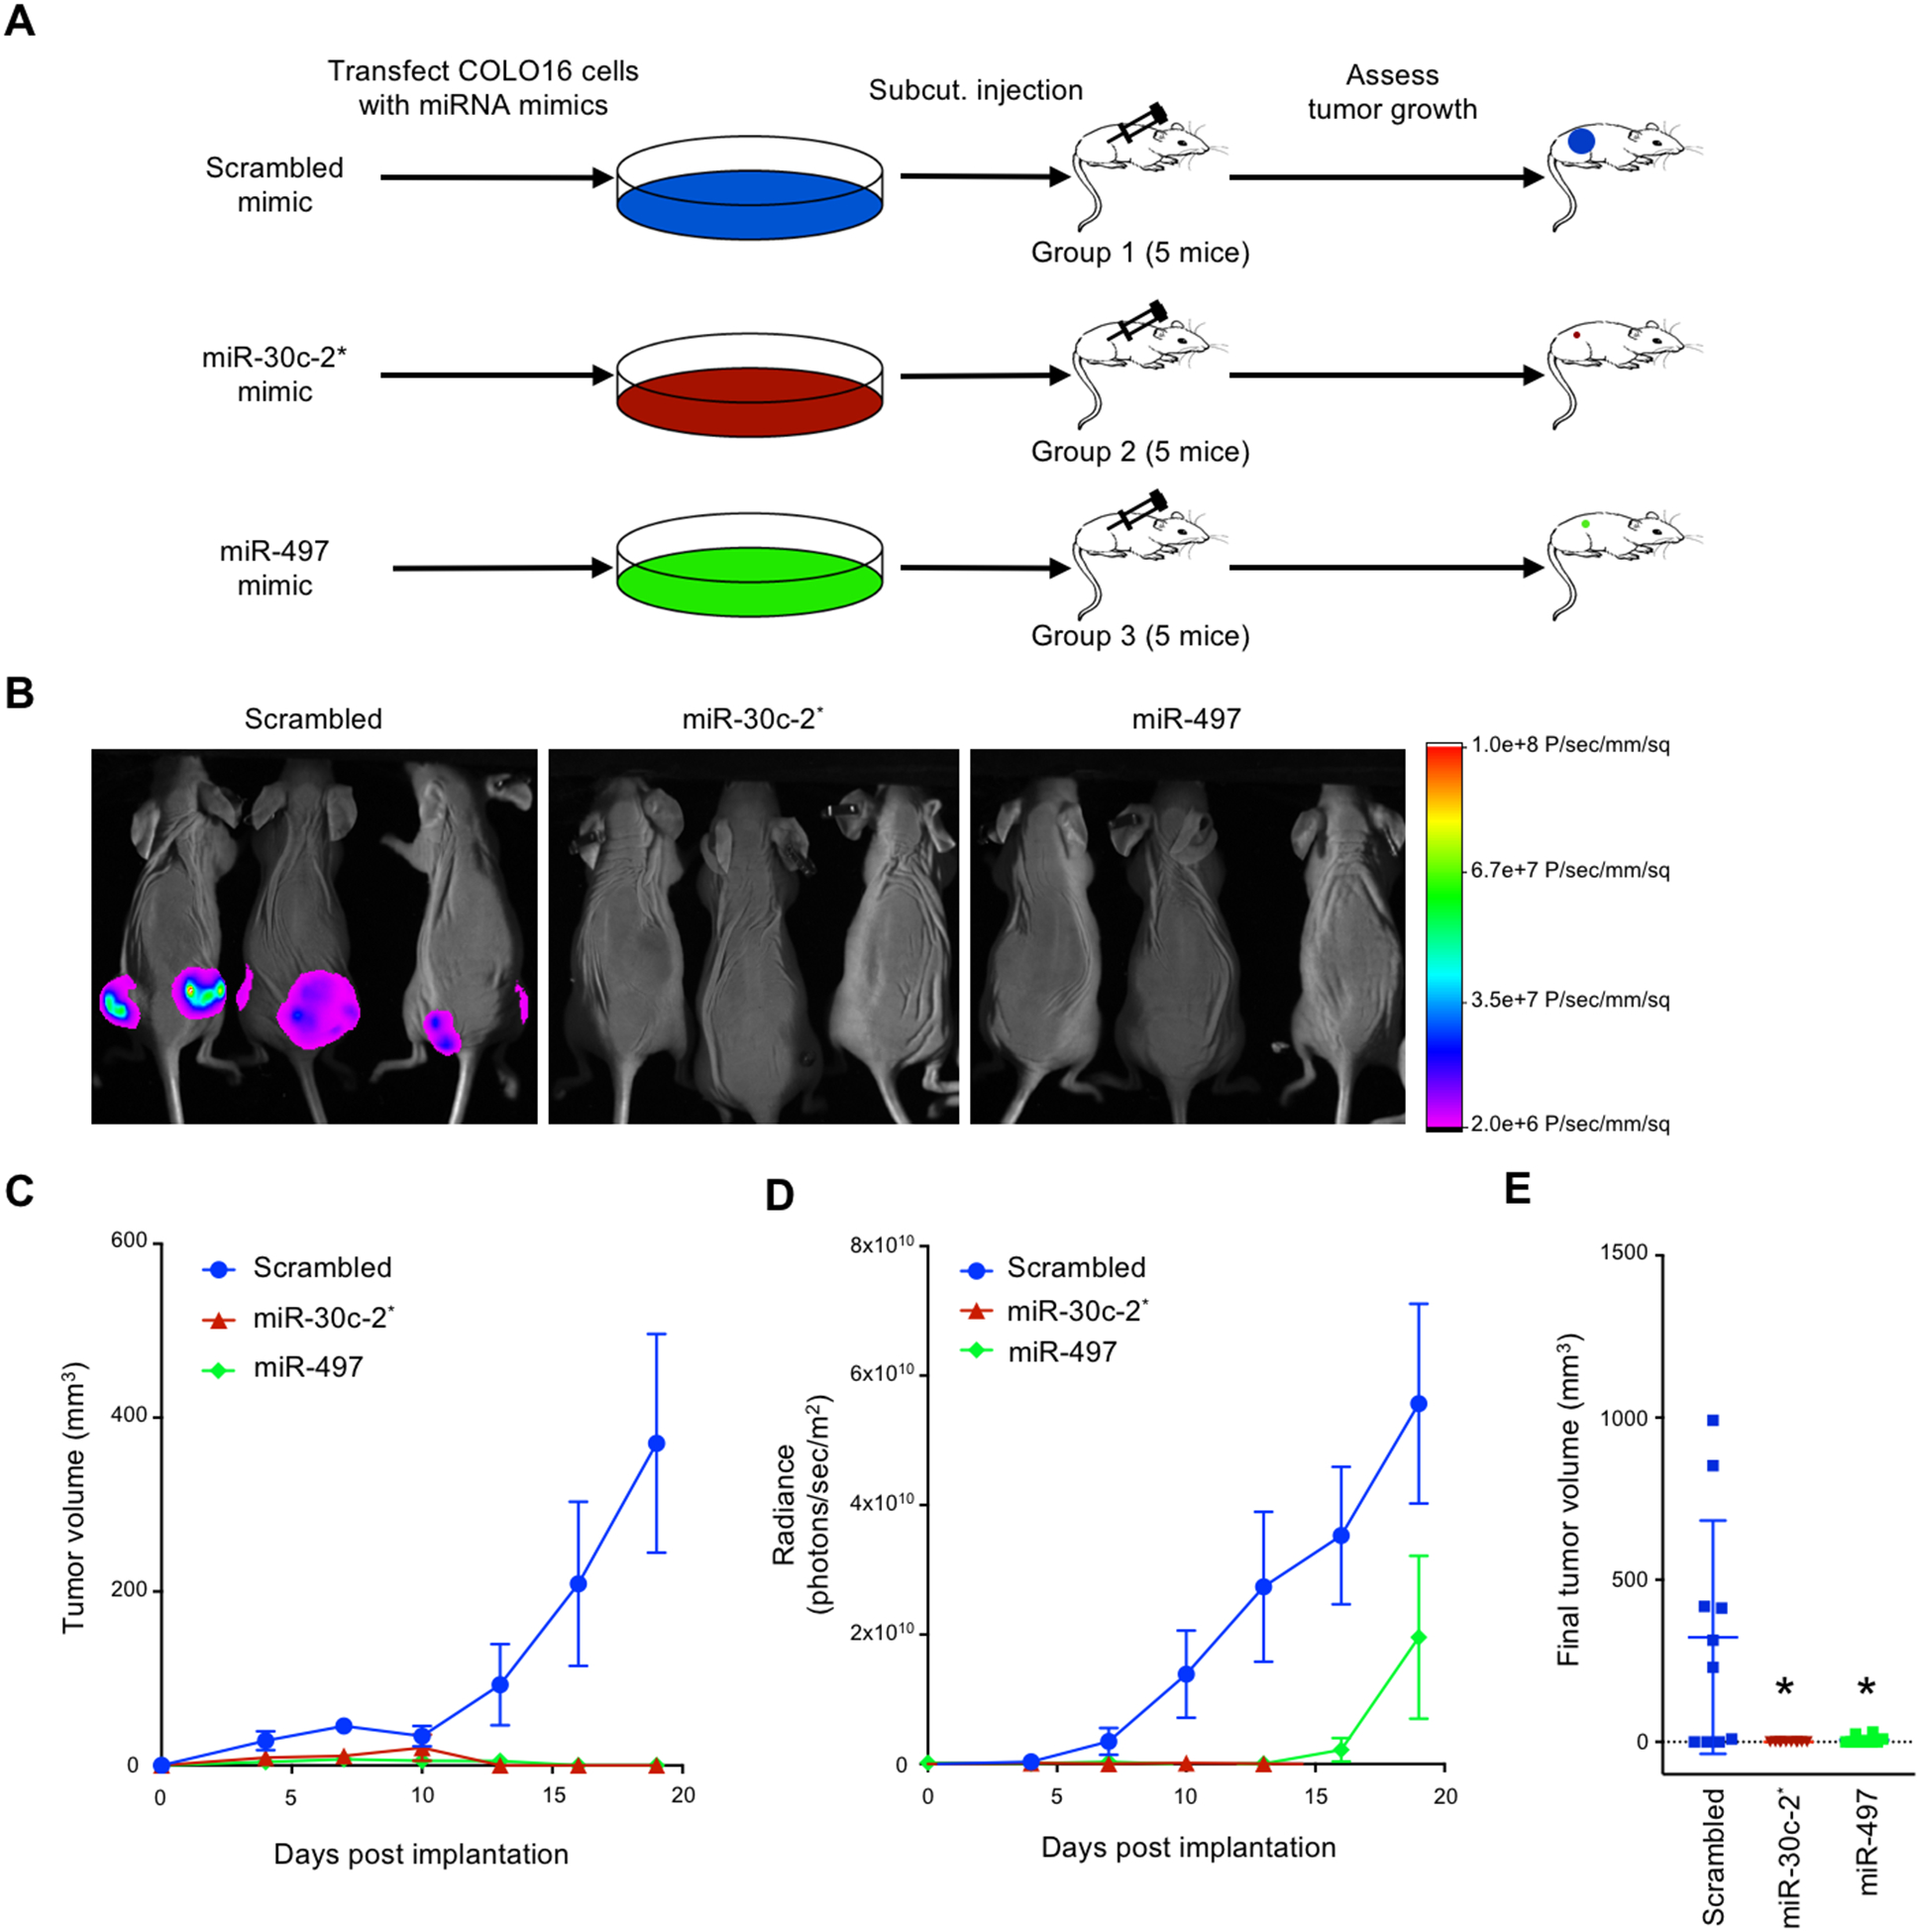
TAp63 is a p53 family member and potent tumor and metastasis suppressor. Here, we show that TAp63-/- mice exhibit an increased susceptibility to ultraviolet radiation-induced cutaneous squamous cell carcinoma (cuSCC). A human-to-mouse comparison of cuSCC tumors identified miR-30c-2* and miR-497 as underexpressed in TAp63-deficient cuSCC. Reintroduction of these miRNAs significantly inhibited the growth of cuSCC cell lines and tumors. Proteomic profiling of cells expressing either miRNA showed downregulation of cell-cycle progression and mitosis-associated proteins. A mouse to human and cross-platform comparison of RNA-sequencing and proteomics data identified a 7-gene signature, including AURKA, KIF18B, PKMYT1, and ORC1, which were overexpressed in cuSCC. Knockdown of these factors in cuSCC cell lines suppressed tumor cell proliferation and induced apoptosis. In addition, selective inhibition of AURKA suppressed cuSCC cell proliferation, induced apoptosis, and showed antitumor effects in vivo. Finally, treatment with miR-30c-2* or miR-497 miRNA mimics was highly effective in suppressing cuSCC growth in vivo. Our data establish TAp63 as an essential regulator of novel miRNAs that can be therapeutically targeted for potent suppression of cuSCC. SIGNIFICANCE: This study provides preclinical evidence for the use of miR-30c-2*/miR-497 delivery and AURKA inhibition in the treatment of cuSCC, which currently has no FDA-approved targeted therapies.See related commentary by Parrales and Iwakuma, p. 2439.


Conflict of interest statement

Conflict of interest: The authors have declared that no conflict of interest exists.

Figures

Figure 1:
Figure 1:
Loss of TAp63 promotes UVR-induced tumorigenesis. A, WT and TAp63−/− mice treated with UVR (5kJ/m2, 3x a week, for up to 60 weeks) (n=15 mice per group). B, Tumors from irradiated mice. White arrowheads indicate the presence of cuSCC. C, H&E stained cross-sections of well-differentiated cuSCC tumors from the indicated genotypes. Keratin pearls (black arrow) indicate squamous differentiation. Scale bars: 50 μm. D, Quantification of mice harboring cuSCC for both genotypes. E, The average number of pre-malignant papillomas and cuSCCs per mouse was quantified for each genotype. * p<0.05, Student’s t test (two-tailed).
Figure 2.
Figure 2.
TAp63-deficient tumors exhibit deregulated mRNA and microRNA expression. A-B, Hierarchical clustering analysis based on differentially expressed mRNAs (A) and microRNAs (B) in TAp63−/− cuSCC vs. TAp63−/− skin samples. Each row represents a single mRNA or microRNA, while each column represents a sample. The Pearson correlation matrix is shown on top. The color scale illustrates the relative expression levels of mRNAs and microRNAs across each sample. Blue shades correspond to reduced expression and red shades represent increased expression levels. C, Comparison of the TAp63−/− cuSCC signature and human cuSCC identified similar differential expression of the indicated number of microRNAs and mRNAs. D, Pathway analysis of the overlapping targets (purple) identified in (C). E, Functional pair analysis identified a conserved microRNA/mRNA regulatory network in both TAp63−/− murine cuSCC and human cuSCC. Shown are microRNAs with fold change>1.5 in both comparisons.
Figure 3.
Figure 3.
TAp63-regulated miR-30c-2* and miR-497–5p suppresses cuSCC through induction of cell death and cell cycle arrest. A-B, SYBR green qRTPCR of TAp63 (A) and Dicer (B) in NHEKs following transfection with the indicated siRNAs. C-D, Taqman qRTPCR of miR-30c-2* C, and miR-497–5p D in NHEKs following transfection with the indicated siRNAs. E, Representative growth curve of nucRed-mCherry-labeled COLO16 cells transfected with the indicated microRNA mimics. F-G, Immunofluorescence (F) and quantification (G) for Annexin V-488 (green)-positive nucRed-mCherry-labeled COLO16 cells transfected with the indicated microRNA mimics. H-I, Immunofluorescence (H) images and quantification (I) for Edu (green) incorporation in COLO16 cells transfected with the indicated microRNA mimics following a 3 hour Edu pulse. NucRed® dead 647 (red) was used as a counterstain. J-K, Cell cycle profiles (J) and quantification (K) of COLO16 cells 48 hours after transfection with the indicated microRNA mimic as measured by FACS analysis. M phase was measured as the percentage of cells staining positive for Histone H3-pS28-AF647. Data shown are mean ± SD, n=3, unless noted otherwise. * p<0.05, ** p<0.01, ***p<0.001, Student’s t test (two-tailed).
Figure 4.
Figure 4.
Proteogenomic analysis identifies multiple direct mRNA targets for miR-30c-2* and miR-497. A, Schematic representation of experimental design. COLO16 cells transfected with the indicated microRNA mimic were collected, denatured, and subjected to tryptic digest prior to labeling of each sample with the indicated tandem mass tag (TMT). Labeled peptides were then combined, fractionated and subjected to LC-MS/MS analysis to identify differentially expressed proteins. B-C, Ingenuity Pathway Analysis (IPA) of underexpressed proteins (fold change<0.67) in cells transfected with miR-30c-2–3p (B) and miR-497–5p (C) compared to scrambled control. The canonical pathways shown exhibited a -log(p-value) > 2, and an absolute z-score > 1.5. A positive (orange bars) or negative (blue bars) z-score indicates that pathway activity is predicted to be increased or reduced following overexpression of the corresponding microRNA mimic. D-E, Comparison of significantly underexpressed proteins following transfection with miR-30c-2* (D) and miR-497 (E) with the overexpressed mRNAs in murine TAp63−/− cuSCC and human cuSCC by RNA-Seq. Overlapping targets were examined for the presence of MREs for miR-30c-2* and miR-497. Note that KIF18B and PKMYT1 were found to be predicted targets of both miR-30c-2* and miR-497–5p and were underexpressed in both proteomics experiments. F-H, Western blot analysis for the indicated proteins following transfection with mimics of miR-30c-2* (F), miR-497 (G), and both miRs (H). I-J, COLO16 cells were transfected with the indicated biotinylated microRNA mimics (bi-miR) and collected 24 hrs after transfection. Fold enrichment for the indicated targets in the streptavidin pull-down of bi-miR-30c-2* (n=5) (I) and bi-miR-497–5p (n=3) (J) was calculated using qRT-PCR. Data shown represent the mean ± SD of at least 3 independent experiments, unless noted otherwise. * p<0.05, ** p<0.01, *** p<0.001, n.s. = not significant, Student’s t test (two-tailed).
Figure 5:
Figure 5:
Inhibition of mIR-30c-2* and miR-497–5p targets affects cuSCC cell proliferation and survival. (A) SYBR green qRT-PCR of the validated miR-30c-2* and miR-497 targets in NHEKs and the cuSCC cell lines COLO16, SRB12, SRB1, IC1, and RDEB2. (B) Representative results of Western blotting of the validated miR-30c-2* and miR-497 targets in the same cell lines as in (A). (C) Western blotting of the indicated targets following siRNA-mediated knockdown in COLO16 cells. (D-F) COLO16 cells stably expressing nuclear mCherry transfected with the indicated siRNAs, incubated with Annexin V-488, and scanned every 4 hours using the Incucyte® high-content live-cell imaging platform. (D) Growth curve of COLO16 cells transfected with the indicated siRNAs. (E and F) Immunofluorescence (E) and quantification (F) for annexin V-488 (green)-positive cells transfected with the indicated siRNAs. (G) Cell cycle profiles of COLO16 cells were assessed by FACS 48 hours after siRNA transfection. Data shown are mean ± SD, of at least 3 independent experiments. * p<0.05, ** p<0.01, ***p<0.001, Student’s t test (two-tailed).
Figure 6:
Figure 6:
AURKA is a viable therapeutic target in cuSCC. A, Correlation analysis of miR-497 and AURKA in human cuSCC tumors. Pearson’s correlation coefficient (r) values and p values are listed. B-C, Kaplan-Meier survival curves from HNSC patients with high vs. low expression of miR-497 (B) and AURKA (C). D-F, COLO16 cells stably expressing nuclear mCherry treated with DMSO vs. alisertib (12nM), incubated with Annexin V-488, and scanned every 6 hours using the Incucyte® high-content live-cell imaging platform. D, Growth curve of COLO16 cells treated with alisertib vs. DMSO. E-F, Immunofluorescence (E) and quantification (F) for annexin V-488 (green)-positive cells following treatment with alisertib or DMSO. G, Final tumor volumes of xenograft mouse models composed of COLO16 cells subcutaneously injected into both flanks of athymic nu/nu mice. Tumor bearing mice were randomized into 2 groups and subsequently treated daily with either vehicle or alisertib (30mg/kg) via oral gavage. Data shown are mean ± SD, n=20 and 26 for vehicle and alisertib treated mice, ** p<0.01, Student’s t test (two-tailed).
Figure 7:
Figure 7:
miR-30c-2* and miR-497 suppress cuSCC growth in vivo. A, COLO16 cells stably expressing RFP and luciferase were transfected with the indicated microRNA mimics and subcutaneously injected into both flanks of athymic nu/nu mice. B, Representative images of mice injected with COLO16 cells transfected with scrambled, miR-30c-2*, and miR-497–5p microRNA mimics on Day 19 prior to tumor harvest. C, Tumor volume assessed using caliper s. D, Time course of in vivo bioluminescence imaging of tumor xenografts. E, Quantification of extracted tumor volumes. Data shown are mean ± SEM, n=10. * p<0.05, Student’s t test (two-tailed).

Comment in

Comment on

Similar articles

Cited by

References

    1. Rogers HW, Weinstock MA, Harris AR, Hinckley MR, Feldman SR, Fleischer AB, et al. Incidence estimate of nonmelanoma skin cancer in the United States, 2006. Archives of dermatology 2010;146:283–7 - PubMed
    1. Parikh SA, Patel VA, Ratner D. Advances in the management of cutaneous squamous cell carcinoma. F1000Prime Rep 2014;6:70. - PMC - PubMed
    1. Chitsazzadeh V, Coarfa C, Drummond JA, Nguyen T, Joseph A, Chilukuri S, et al. Cross-species identification of genomic drivers of squamous cell carcinoma development across preneoplastic intermediates. Nature communications 2016;7:12601 - PMC - PubMed
    1. Pickering CR, Zhou JH, Lee JJ, Drummond JA, Peng SA, Saade RE, et al. Mutational landscape of aggressive cutaneous squamous cell carcinoma. Clinical cancer research : an official journal of the American Association for Cancer Research 2014;20:6582–92 - PMC - PubMed
    1. Li YY, Hanna GJ, Laga AC, Haddad RI, Lorch JH, Hammerman PS. Genomic analysis of metastatic cutaneous squamous cell carcinoma. Clinical cancer research : an official journal of the American Association for Cancer Research 2015;21:1447–56 - PMC - PubMed

Publication types