. 2020 Jun 1;80(11):2298-2310.
doi: 10.1158/0008-5472.CAN-19-3133. Epub 2020 Mar 10.

Targeting Glycosylated PD-1 Induces Potent Antitumor Immunity

Affiliations

Targeting Glycosylated PD-1 Induces Potent Antitumor Immunity

Linlin Sun et al. Cancer Res. .

Abstract

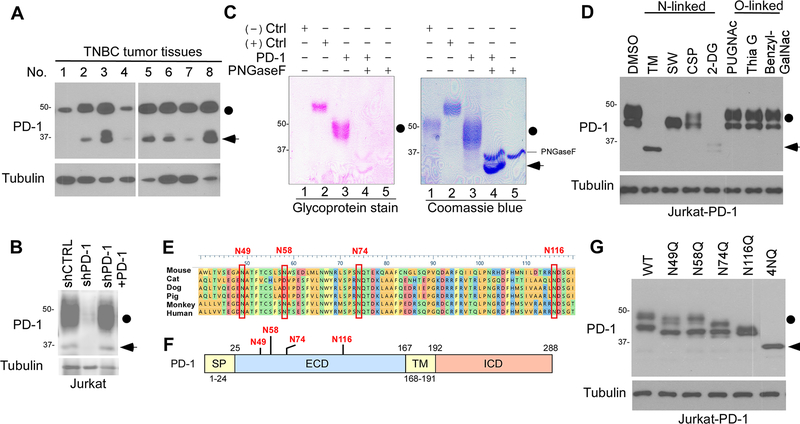
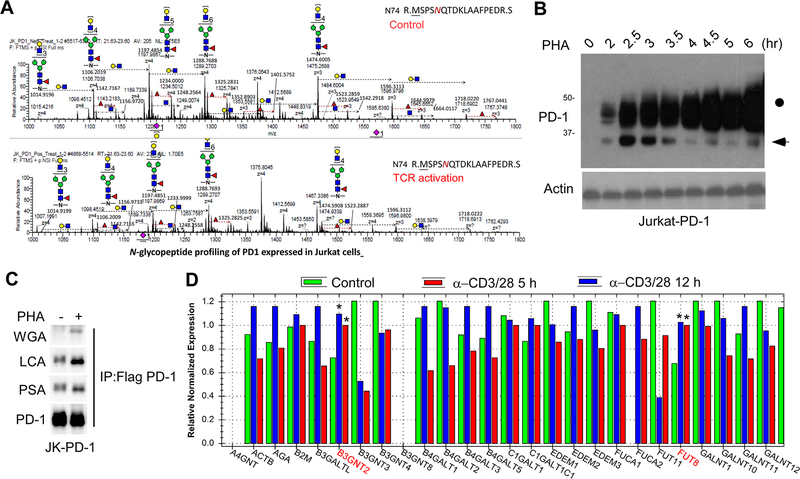
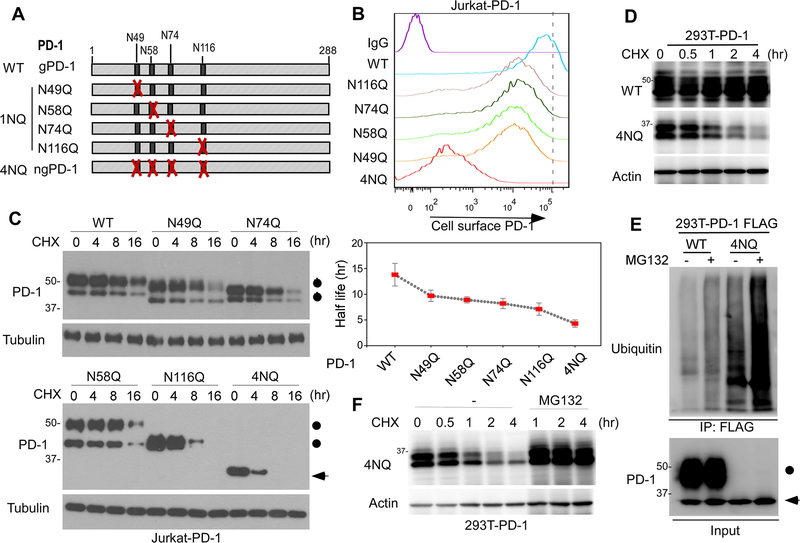
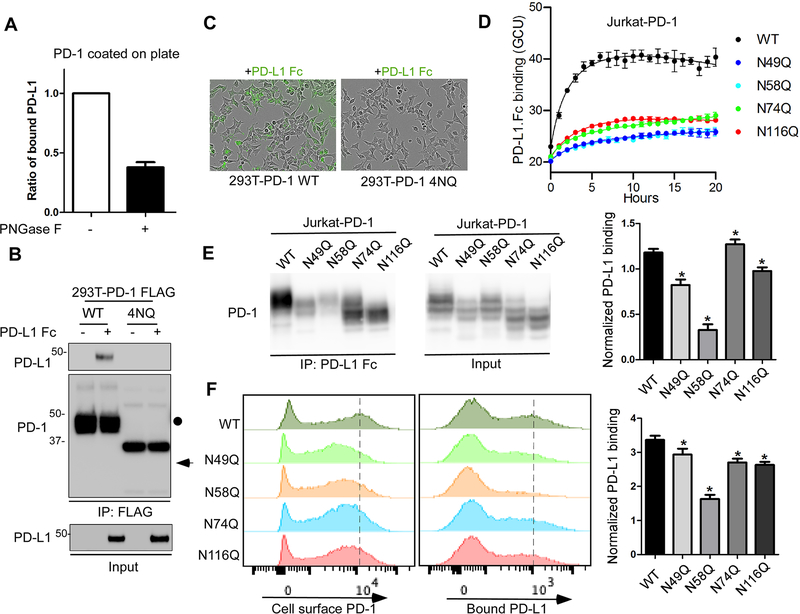
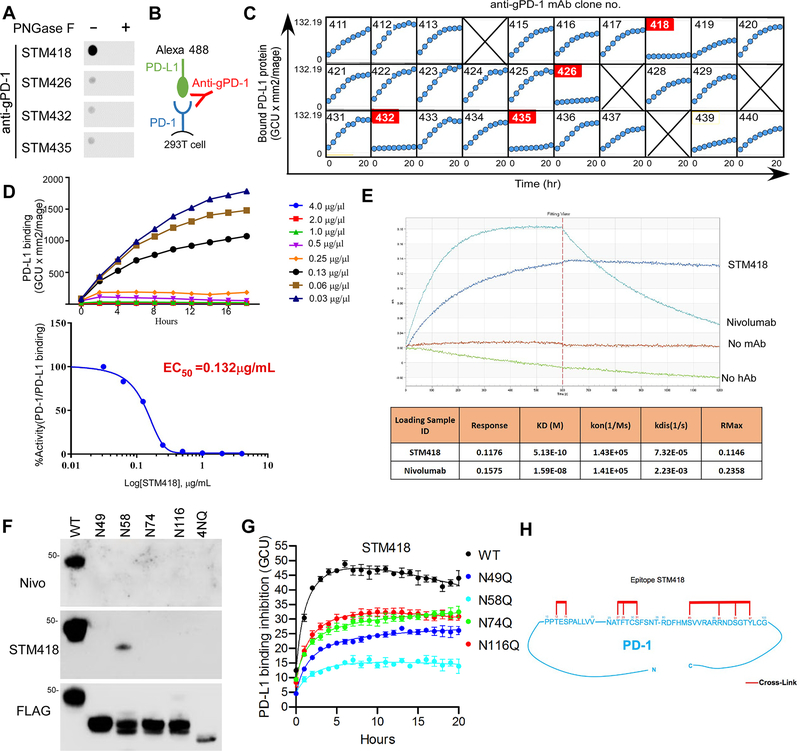
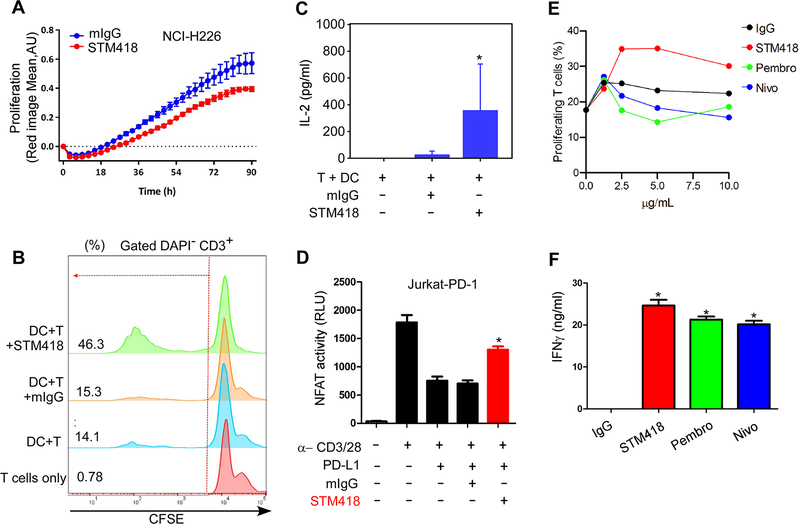
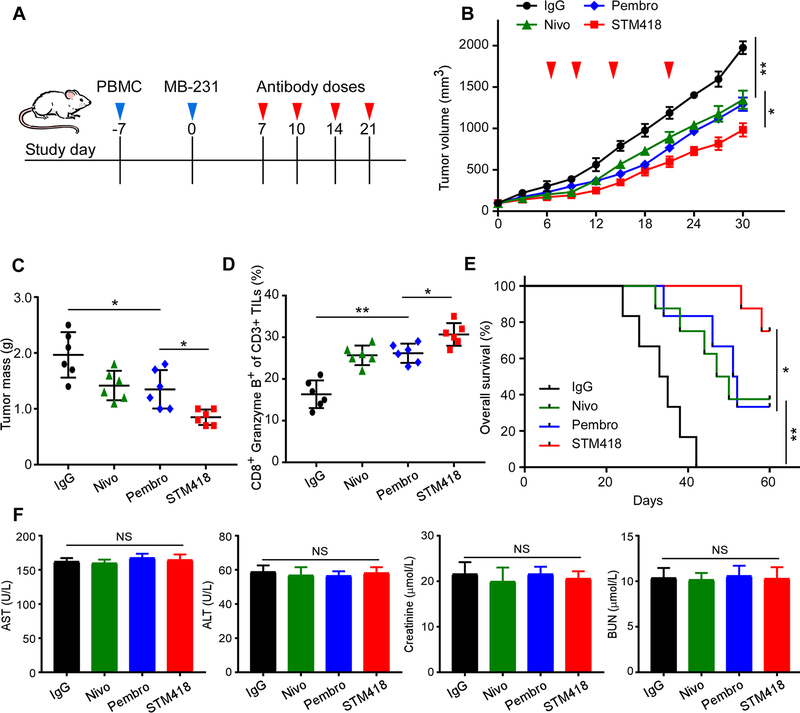
Immunotherapies targeting programmed cell death protein 1 (PD-1) and programmed cell death 1 ligand 1 (PD-L1) immune checkpoints represent a major breakthrough in cancer treatment. PD-1 is an inhibitory receptor expressed on the surface of activated T cells that dampens T-cell receptor (TCR)/CD28 signaling by engaging with its ligand PD-L1 expressed on cancer cells. Despite the clinical success of PD-1 blockade using mAbs, most patients do not respond to the treatment, and the underlying regulatory mechanisms of PD-1 remain incompletely defined. Here we show that PD-1 is extensively N-glycosylated in T cells and the intensities of its specific glycoforms are altered upon TCR activation. Glycosylation was critical for maintaining PD-1 protein stability and cell surface localization. Glycosylation of PD-1, especially at the N58 site, was essential for mediating its interaction with PD-L1. The mAb STM418 specifically targeted glycosylated PD-1, exhibiting higher binding affinity to PD-1 than FDA-approved PD-1 antibodies, potently inhibiting PD-L1/PD-1 binding, and enhancing antitumor immunity. Together, these findings provide novel insights into the functional significance of PD-1 glycosylation and offer a rationale for targeting glycosylated PD-1 as a potential strategy for immunotherapy. SIGNIFICANCE: These findings demonstrate that glycosylation of PD-1 is functionally significant and targeting glycosylated PD-1 may serve as a means to improve immunotherapy response.


Conflict of interest statement

Competing interests: M.-C.H. received a sponsored research agreement from STCube Pharmaceuticals, Inc. through MD Anderson Cancer Center. E.M.C., Y.-S.K., A.H.P., and S.S.Y. are employees of STCube Pharmaceuticals, Inc. C.-W.L. and M.-C.H. are inventors on patent applications under review. The remaining authors declare no conflicts of interest.

Figures

Figure 1.
Figure 1.. PD-1 is heavily glycosylated in T cells.
(A) Immunoblot of PD-1 expression in human TNBC tumor tissues. Black circle, glycosylated PD-1; arrowhead, non-glycosylated PD-1. (B) Immunoblot of PD-1 expression in shCTRL, shPD-1, and PD-1-re-expressing Jurkat T cells stimulated by PHA overnight. (C) Glycoprotein staining and Coomassie blue staining of PNGase F-treated purified PD-1. Horseradish peroxidase (HRP) and soybean trypsin inhibitor (STI) served as positive and negative control, respectively. (D) Immunoblot of PD-1 in PD-1-expressing Jurkat (Jurkat-PD-1) T cells treated with inhibitors blocking N-linked or O-linked glycosylation as indicated. (E) Schematic diagram of PD-1 amino acid sequence alignment among different species. The four putative NXT motifs are shown in red. (F) Schematic diagram of full-length PD-1. ECD, extracellular domain; ICD, intracellular domain; SP, signal peptide; TM, transmembrane domain. Four putative NXT motifs in the ECD domain are labeled in red. The numbers indicate the amino acid positions. (G) Immunoblot of the protein expression pattern of PD-1 WT and indicated NQ mutants overexpressed in Jurkat T cells.
Figure 2.
Figure 2.. TCR activation induces alterations of specific glycoforms of PD-1.
(A) LC-MS/MS-based analysis of N-glycopeptides containing N74-glycans. PD-1 was purified from Jurkat-PD-1 FLAG cells treated with or without PHA overnight. The cartoon symbols used for the glycans conform to the standard representation recommended by the Consortium for Functional Glycomics. (B) Immunoblot of PD-1 in Jurkat T cells treated with PHA for the indicated time. (C) Lectin immunoblot of PD-1 purified from Jurkat-PD-1 FLAG treated with or without PHA for 5 hours. (D) Quantification of mRNA levels of various glycosyltransferases by real-time PCR in Jurkat T cells stimulated with α−CD3/CD28 for the indicated time points. All data represent mean ± SD from at least three independent experiments. *, P < 0.05.
Figure 3.
Figure 3.. PD-1 glycosylation is critical for maintaining its stability and membrane expression.
(A) Schematic diagram of various PD-1 NQ mutants. The numbers indicate the amino acid positions on PD-1. (B) Flow cytometric analysis of cell surface PD-1 WT or the indicated NQ mutants over-expressed in Jurkat T cells. (C) Protein half-life of PD-1 WT or the indicated NQ mutants over-expressed in Jurkat T cells. Cells were treated with CHX for the indicated time, and PD-1 levels were examined by immunoblotting. (D) Protein half-life of PD-1 WT or 4NQ overexpressed in 293T cells. Cells were treated with CHX for the indicated time and PD-1 levels were examined by immunoblotting. (E) Ubiquitination of PD-1 WT or 4NQ purified from 293T cells treated with or without MG132. (F) Immunoblot of PD-1 4NQ in 293T cells treated with CHX for the indicated time in the presence or absence of MG132.
Figure 4.
Figure 4.. The glycosylation of PD-1 is essential for its interaction with PD-L1.
(A) In vitro plate-based binding analysis of purified PD-1 with PD-L1 Fc in the absence or presence of PNGase F. (B) Analysis of PD-1/PD-L1 binding by immunoprecipitation. The lysates of 293T cells overexpressing FLAG-tagged PD-1 WT or 4NQ mutant were incubated with PD-L1 Fc and anti-FLAG M2 agarose, and then subjected to IP-Western. (C) Time-lapse microscopy of the dynamic interaction between green fluorescent-labeled PD-L1-Fc and PD-1 WT or 4NQ expressed in 293T cells. (D) Time-lapse evaluation and quantitation of the dynamic interaction between green fluorescent-labeled PD-L1-Fc and PD-1 WT or the indicated mutants expressed in Jurkat cells. (E) Mapping of the glycosylated sites critical for binding with PD-L1 by immunoprecipitation. The lysates of Jurkat cells overexpressing PD-1 WT or the indicated NQ mutants were incubated with pan mouse IgG dynabeads and Fc (mouse IgG) fused human PD-L1, and then subjected to IP-Western. The band intensity was quantified and normalized to show PD-L1 binding levels (right panel). (F) Flow cytometric analysis of the binding of PD-L1 Fc with cell surface PD-1 by using Jurkat T cells expressing PD-1 WT or the indicated NQ mutants. Median Fluorescence Intensity was quantified and normalized to show PD-L1 binding levels (right panel). All data represent mean ± SD from at least three independent experiments. *, P < 0.05.
Figure 5.
Figure 5.. Production and characterization of gPD-1 antibodies.
(A) Dot blot analysis of PD-1 antibodies using purified PD-1 treated with or without PNGase F. (B) Schematic diagram of the live-cell imaging PD-1/PD-L1 binding assay in the presence of gPD-1 antibody. (C) Measurement of the neutralizing activity of gPD-1 antibodies using an IncuCyte system. 293T-PD-1 cells were incubated with fluorescent-labeled PD-L1-Fc fusion protein in the presence of gPD-1 antibodies. The binding of PD-1 and PD-L1 was quantified by counting fluorescent objects per mm2 using the Incucyte™ Zoom system every 2 hours. (D) EC50 calculation of STM418 by GraphPad Prism software. Experiments were conducted as described in (C) in the presence of indicated doses of STM418. (E) KD determination of STM418 or nivolumab. (F) Glyco-specificity evaluation of STM418 by immunoblot analysis of PD-1 WT or the indicated NQ mutants over-expressed in 293T cells. (G) Time-lapse evaluation and quantitation of the dynamic interaction between green fluorescent-labeled PD-L1-Fc and PD-1 WT or the indicated mutants expressed in Jurkat cells in the absence of presence of STM418. PD-L1 binding inhibition is represented by the fluorescence intensity ratio of the STM418 to IgG treatment in each cell line. (H) Epitope mapping of STM418 by high-mass MALDI mass spectrometry (CovalX). Sequences on the PD-1 protein shown in red represent the STM418 antibody binding sites.
Figure 6.
Figure 6.. STM418 enhances T-cell proliferation and activation in vitro.
(A) Quantification of the proliferation of NCI-H226 cells co-cultured with T cells isolated from PMBCs in the presence or absence of STM418 (20 μg/mL). (B) Flow cytometric analysis of the proliferation of CFSE-labeled T cells co-cultured with dendritic cells (DCs) in the presence or absence of STM418 (10 μg/mL). (C) Quantification of IL-2 levels by ELISA. Experiments were conducted as described in (B). Supernatants were collected on day 5 and subjected to ELISA. (D) Normalized luminescence of PD-1 expressing Jurkat T cells transiently transfected with an NFAT-Luc reporter construct and stimulated with α-CD3/CD28/IgG or α-CD3/CD28/PD-L1 in the presence or absence of STM418 (20 μg/mL). (E) Flow cytometric analysis of the proliferation of CFSE-labeled T cells co-cultured with dendritic cells (DCs) in the presence of the indicated dose of IgG, STM418, nivolumab, or pembrolizumab. (F) Quantification of IFNγ levels by ELISA. Experiments were conducted as described in (E). Supernatants were collected on day 5 and subjected to ELISA. All data represent mean ± SD from at least three independent experiments. *, P < 0.05.
Figure 7.
Figure 7.. STM418 induces potent anti-tumor immunity in a humanized TNBC animal model.
(A) Schematic diagram of a drug intervention protocol for anti-PD-1 antibodies (5 mg/kg) in a humanized animal model. (B) The growth of orthotopic MDA-MB-231 tumors in PD-1 antibody-treated SCID-PBMC mice. Tumors were measured until tumors reached > 100 mm3 in volume at the indicated time points. Nivo, nivolumab; Pembro, pembrolizumab. (C) The weight of tumors at the drug intervention endpoint. (D) Intracellular cytokine staining of CD8+ and granzyme B+ cells in CD3+ T-cell populations from isolated tumor-infiltrating lymphocytes. Results are presented as the mean ± standard deviation from a representative experiment. (E) Kaplan Meier survival curve for mice bearing MDA-MB-231 tumors after the drug intervention with anti-PD-1 antibodies. Significance was determined using the log-rank test. (F) Quantitative analysis of indicated biochemistry indices for liver and kidney function after the experiments. All error bars represent mean ± SD. *P < 0.05; NS, not significant.

References

    1. Chen L, Flies DB. Molecular mechanisms of T cell co-stimulation and co-inhibition. Nature reviews Immunology 2013;13:227–42 - PMC - PubMed
    1. Freeman GJ, Long AJ, Iwai Y, Bourque K, Chernova T, Nishimura H, et al. Engagement of the Pd-1 Immunoinhibitory Receptor by a Novel B7 Family Member Leads to Negative Regulation of Lymphocyte Activation. The Journal of Experimental Medicine 2000;192:1027–34 - PMC - PubMed
    1. Okazaki T, Honjo T. PD-1 and PD-1 ligands: from discovery to clinical application. Int Immunol 2007;19:813–24 - PubMed
    1. Riley JL. PD-1 signaling in primary T cells. Immunol Rev 2009;229:114–25 - PMC - PubMed
    1. Hui E, Cheung J, Zhu J, Su X, Taylor MJ, Wallweber HA, et al. T cell costimulatory receptor CD28 is a primary target for PD-1-mediated inhibition. Science 2017;355:1428–33 - PMC - PubMed

Publication types

MeSH terms