. 2020 Mar 10;5(2):e00768-19.
doi: 10.1128/mSystems.00768-19.

Complementary Metagenomic Approaches Improve Reconstruction of Microbial Diversity in a Forest Soil

Affiliations

Complementary Metagenomic Approaches Improve Reconstruction of Microbial Diversity in a Forest Soil

L V Alteio et al. mSystems. .

Abstract

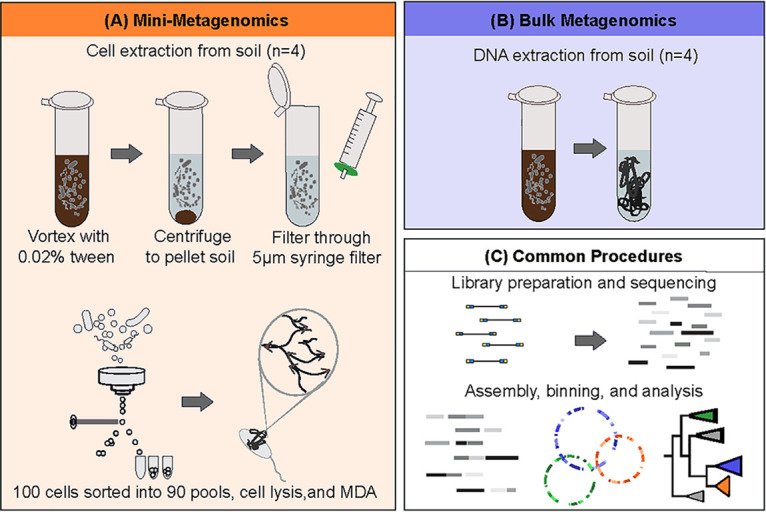
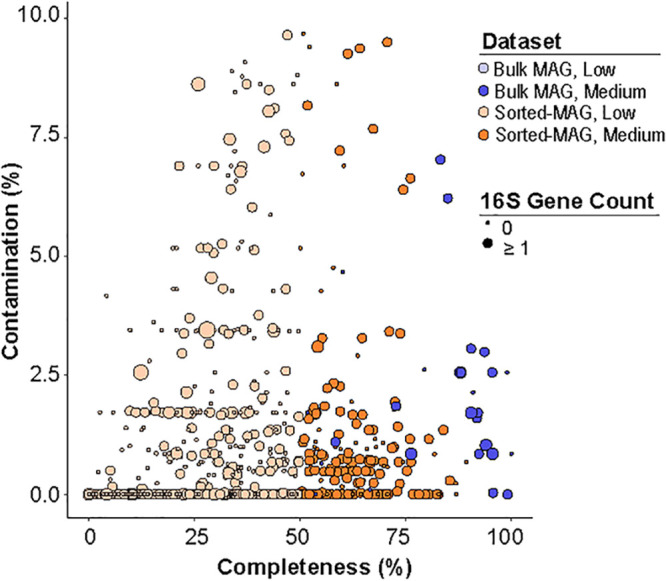
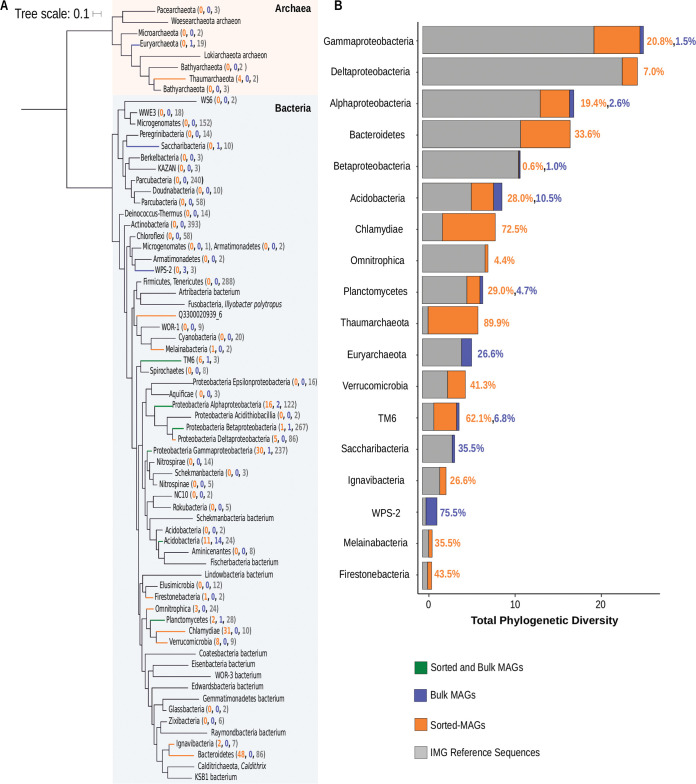
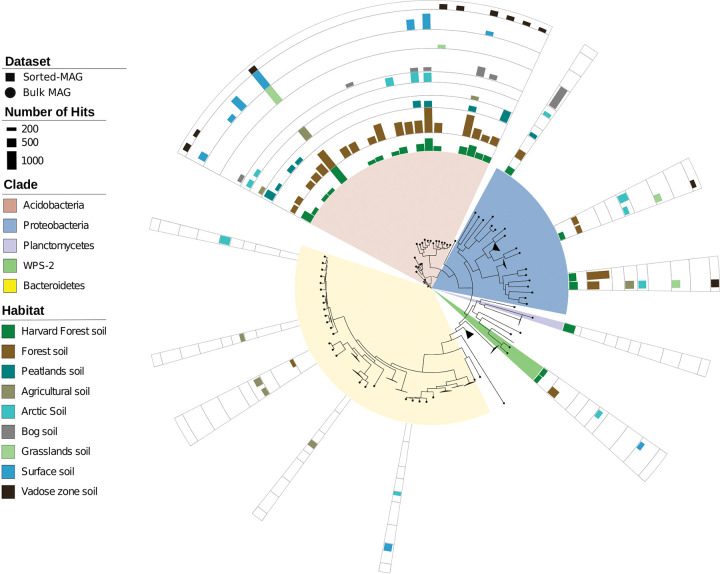
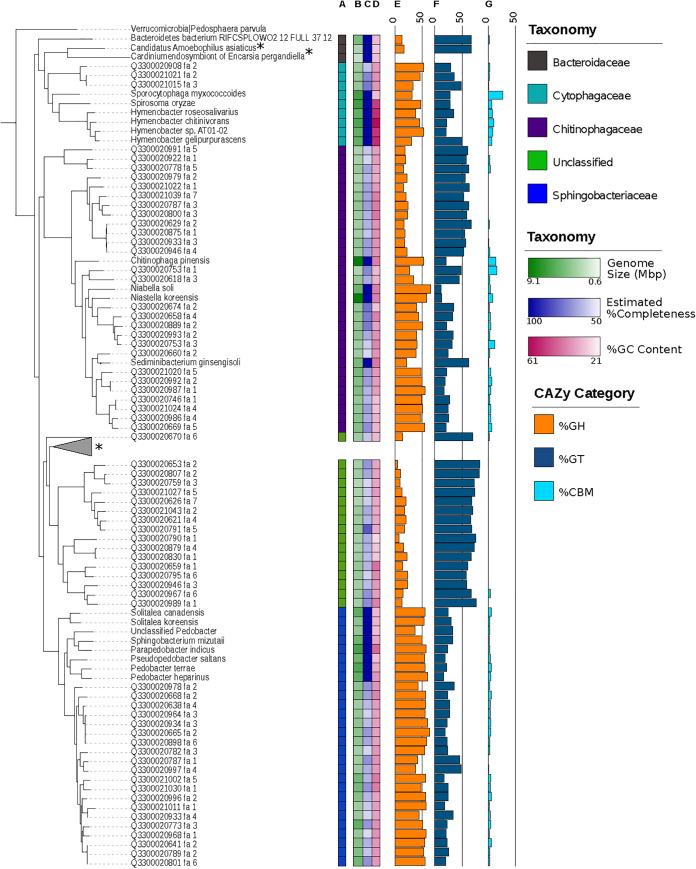
Soil ecosystems harbor diverse microorganisms and yet remain only partially characterized as neither single-cell sequencing nor whole-community sequencing offers a complete picture of these complex communities. Thus, the genetic and metabolic potential of this "uncultivated majority" remains underexplored. To address these challenges, we applied a pooled-cell-sorting-based mini-metagenomics approach and compared the results to bulk metagenomics. Informatic binning of these data produced 200 mini-metagenome assembled genomes (sorted-MAGs) and 29 bulk metagenome assembled genomes (MAGs). The sorted and bulk MAGs increased the known phylogenetic diversity of soil taxa by 7.2% with respect to the Joint Genome Institute IMG/M database and showed clade-specific sequence recruitment patterns across diverse terrestrial soil metagenomes. Additionally, sorted-MAGs expanded the rare biosphere not captured through MAGs from bulk sequences, exemplified through phylogenetic and functional analyses of members of the phylum Bacteroidetes Analysis of 67 Bacteroidetes sorted-MAGs showed conserved patterns of carbon metabolism across four clades. These results indicate that mini-metagenomics enables genome-resolved investigation of predicted metabolism and demonstrates the utility of combining metagenomics methods to tap into the diversity of heterogeneous microbial assemblages.IMPORTANCE Microbial ecologists have historically used cultivation-based approaches as well as amplicon sequencing and shotgun metagenomics to characterize microbial diversity in soil. However, challenges persist in the study of microbial diversity, including the recalcitrance of the majority of microorganisms to laboratory cultivation and limited sequence assembly from highly complex samples. The uncultivated majority thus remains a reservoir of untapped genetic diversity. To address some of the challenges associated with bulk metagenomics as well as low throughput of single-cell genomics, we applied flow cytometry-enabled mini-metagenomics to capture expanded microbial diversity from forest soil and compare it to soil bulk metagenomics. Our resulting data from this pooled-cell sorting approach combined with bulk metagenomics revealed increased phylogenetic diversity through novel soil taxa and rare biosphere members. In-depth analysis of genomes within the highly represented Bacteroidetes phylum provided insights into conserved and clade-specific patterns of carbon metabolism.

Keywords: flow cytometry; metagenomics; microbial ecology; soil microbiology.


Figures

FIG 1
FIG 1
Overview of mini-metagenome and bulk metagenome approaches used in this study. (A) Mini-metagenomics performed on four soil samples, including one heated sample from the top organic soil, one heated sample from the lower mineral soil, one control organic sample, and one control mineral sample (n = 4). Cells were separated from soil particles using a mild detergent, followed by vortex mixing, centrifugation, and filtration through a 5-μm-pore-size syringe filter. Suspended cells were stained with SYBR green and sorted into 90 pools of 100 cells each, generating 359 mini-metagenomes. (B) Bulk metagenomic sequencing conducted on the four soils that were used in mini-metagenomics. (C) Following nucleic acid extraction, libraries were prepared, and shotgun sequencing was performed. Sequence data underwent assembly and quality control. Data were binned and assessed for bin quality. Only medium-quality genome bins with estimates of 50% completeness, 10% contamination, and 10% strain heterogeneity were used in downstream phylogenomic and functional analyses. Further details are provided in Materials and Methods.
FIG 2
FIG 2
Assessment of sorted-MAG and MAG quality. Sorted-MAGs (orange, n = 1,793) and bulk MAGs from the four samples corresponding to those sorted with FACS (blue, n = 275) are represented. Medium-quality sorted-MAGs (dark orange, n = 200) and MAGs (dark blue, n = 29) are those with ≥50% completeness, ≤10% contamination, and ≤10% strain heterogeneity based on analysis of CheckM marker genes (43). The size of each circle represents the number of 16S rRNA gene copies within each MAG.
FIG 3
FIG 3
Phylogenetic diversity of soil taxa identified in this study. (A) Maximum likelihood tree of the phylogenetic distribution of medium-quality sorted-MAGs and bulk MAGs in the context of previously sequenced soil taxa. Colored branches represent clades that include sorted-MAGs and/or bulk MAGs. Orange branches include only sorted-MAGs, blue branches include only bulk MAGs, and green branches include both mini-metagenome and bulk MAGs. Numbers in orange represent numbers of contributed sorted-MAGs, blue numbers represent bulk MAGs, and gray numbers represent the number of reference sequences in each clade. (B) Phylogenetic diversity expansion through sorted-MAGs and bulk MAGs. Gray represents the total branch length contributed by soil reference sequences from the IMG database. Orange bars represent total branch length from sorted-MAGs, and blue represents branch length from bulk MAGs. The percentage of increase in phylogenetic diversity from this study is shown next to each bar.
FIG 4
FIG 4
Comparison of MAGs from this study with published data from terrestrial metagenomes. Innermost is a maximum likelihood tree based on a concatenated alignment of 56 conserved marker proteins from medium-quality sorted-MAGs and bulk MAGs recovered in this study. Mini-metagenomes and bulk MAGs were dereplicated by clustering at 95% average nucleotide identity, resulting in 173 sorted-MAGs and 28 bulk MAGs. The clade names are color-coded according to phylum. Individual tracks around the tree depict hits of individual sorted-MAGs and bulk MAGs by metagenome samples arising from each terrestrial habitat type as specified in the legend. The height of the bar chart indicates the total number of sorted-MAGs and bulk MAG coding sequences that matched metagenome samples. The MAGs were considered matches if they had a minimum of 200 coding sequences with hits at ≥95% amino acid identity over 70% alignment lengths to CDS of an individual metagenome. Further details are provided in Materials and Methods, and data corresponding to this figure are provided in Table S3. The figure was rendered using iTOL (96).
FIG 5
FIG 5
Insights into carbon metabolism within the phylum Bacteroidetes. A concatenated marker gene tree of 67 Bacteroidetes sorted-MAGs and 70 Bacteroidetes reference sequences from the IMG/M database shows clade-specific abundances of glycoside hydrolase and glycosyl transferases. The tree is rooted with Pedosphaera parvula (phylum Verrucomicrobia). Column A shows the distribution of sorted-MAGs across three families of Bacteroidetes, including Cytophagaceae, Chitinophagaceae, and Sphingobacteriaceae, and a clade of unclassified sorted-MAGs. Column B shows genome sizes, with the darkest color representing the largest genome of 9.1 megabases and the lightest representing a genome size of 0.6 megabases. Column C shows genome completeness based on CheckM marker genes, ranging from 50% to 80.5%, as a color gradient. Reference sequences represent isolates with complete genomes. Column D presents genome GC content as a color gradient that ranges from 21.13% to 61.24%. In columns E to G, percentages of genes annotated as glycoside hydrolases (column E), glycosyl transferases (column F), and carbohydrate binding modules (column G) are illustrated as bar charts with vertical lines denoting 0% and 50% of annotated genes. Bacteroidetes with known symbiotic relationships are indicated with an asterisk. The collapsed clade contains Sulcia muelleri, a known symbiont of sap-feeding insects, and Blatellabacterium sp., a known symbiont of the cockroach Blatella germanica.

References

    1. Fierer N. 2017. Embracing the unknown: disentangling the complexities of the soil microbiome. Nat Rev Microbiol 15:579–590. doi:10.1038/nrmicro.2017.87. - DOI - PubMed
    1. Solden L, Lloyd K, Wrighton K. 2016. The bright side of microbial dark matter: lessons learned from the uncultivated majority. Curr Opin Microbiol 31:217–226. doi:10.1016/j.mib.2016.04.020. - DOI - PubMed
    1. Amann R, Rosselló-Móra R. 2016. After all, only millions? mBio 7:e00999-16. doi:10.1128/mBio.00999-16. - DOI - PMC - PubMed
    1. Gans J, Wolinsky M, Dunbar J. 2005. Microbiology: computational improvements reveal great bacterial diversity and high toxicity in soil. Science 309:1387–1390. doi:10.1126/science.1112665. - DOI - PubMed
    1. Locey KJ, Lennon JT. 2016. Scaling laws predict global microbial diversity. Proc Natl Acad Sci U S A 113:5970–5975. doi:10.1073/pnas.1521291113. - DOI - PMC - PubMed