. 2020 Mar 10;11(1):1290.
doi: 10.1038/s41467-020-15104-3.

Cancer associated fibroblast FAK regulates malignant cell metabolism

Affiliations

Cancer associated fibroblast FAK regulates malignant cell metabolism

Fevzi Demircioglu et al. Nat Commun. .

Abstract

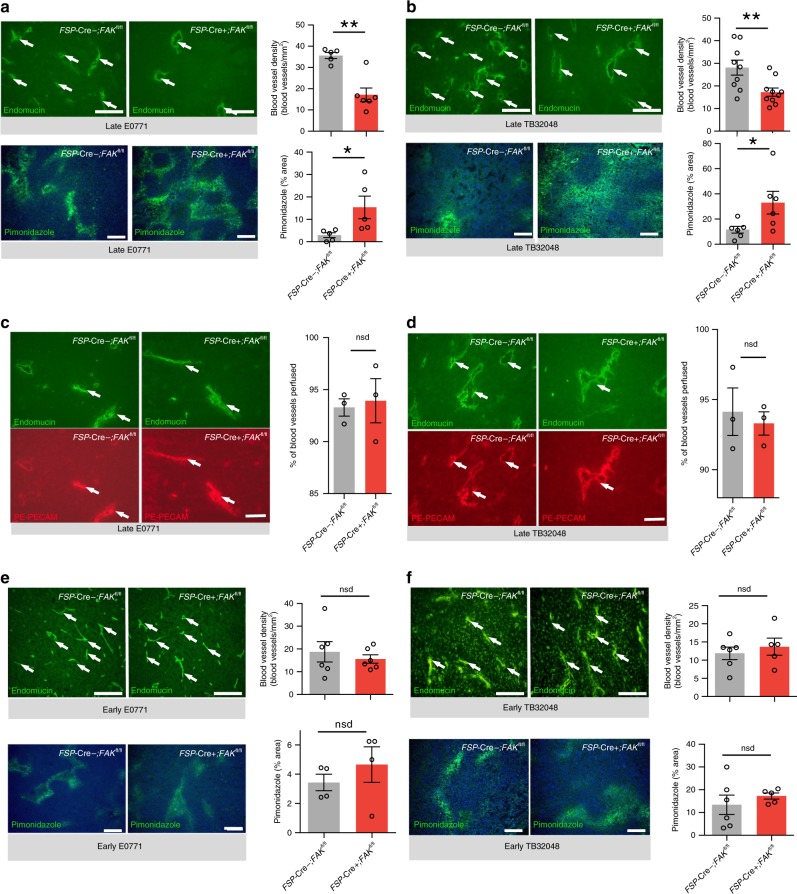
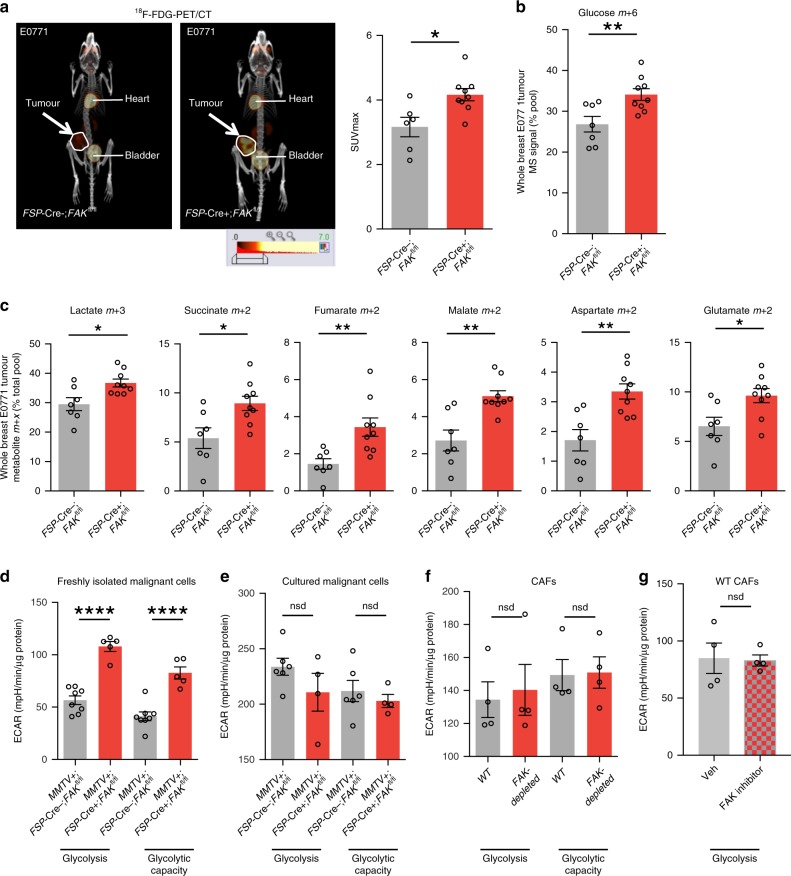
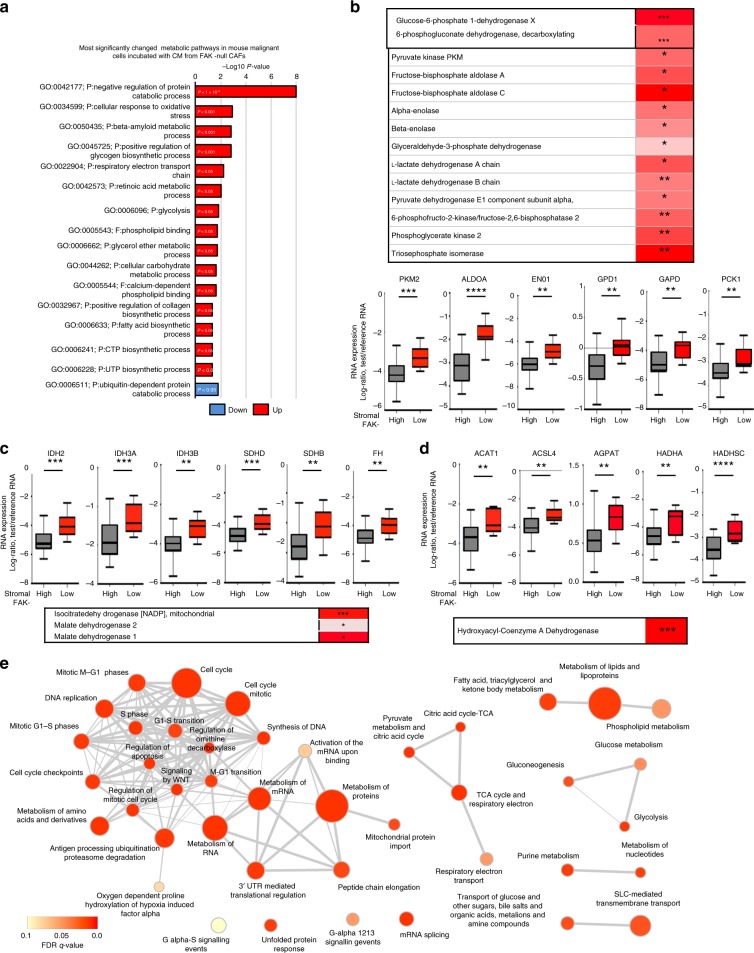
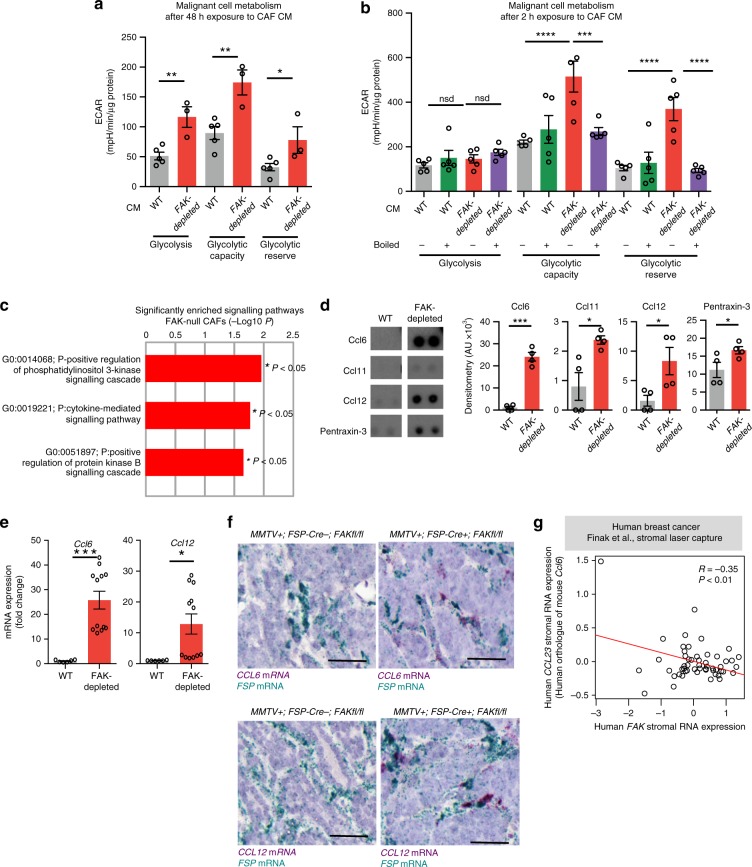
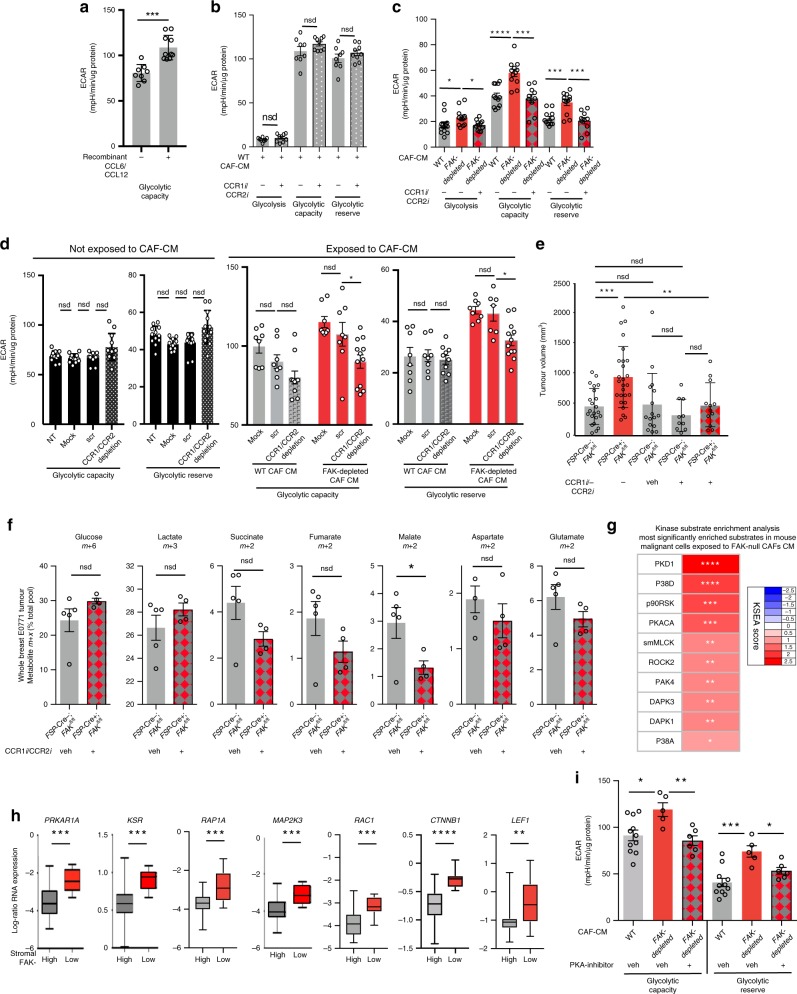
Emerging evidence suggests that cancer cell metabolism can be regulated by cancer-associated fibroblasts (CAFs), but the mechanisms are poorly defined. Here we show that CAFs regulate malignant cell metabolism through pathways under the control of FAK. In breast and pancreatic cancer patients we find that low FAK expression, specifically in the stromal compartment, predicts reduced overall survival. In mice, depletion of FAK in a subpopulation of CAFs regulates paracrine signals that increase malignant cell glycolysis and tumour growth. Proteomic and phosphoproteomic analysis in our mouse model identifies metabolic alterations which are reflected at the transcriptomic level in patients with low stromal FAK. Mechanistically we demonstrate that FAK-depletion in CAFs increases chemokine production, which via CCR1/CCR2 on cancer cells, activate protein kinase A, leading to enhanced malignant cell glycolysis. Our data uncover mechanisms whereby stromal fibroblasts regulate cancer cell metabolism independent of genetic mutations in cancer cells.


Conflict of interest statement

The authors have no competing interests except Y.W., J.J.C., R.S., P.Z. and T.J.S. who are all employees of ChemoCentryx and developed and provided the CCr1i/CCR2i double inhibitor for the study.

Figures

Fig. 1
Fig. 1. Cancer-associated fibroblast FAK depletion enhances tumour growth.
Low stromal FAK expression is significantly associated with reduced overall survival in a human breast (microdissected tumour stroma analysis from 53 primary breast tumours, Finak et al. dataset) and b human pancreatic cancers (54 human pancreatic cancers with activated stroma, Stratford et al. dataset). The Cox proportional hazards (Coxph) regression analysis was performed, with the rank P value shown. See full details in Methods “Gene expression data analysis and clinical inferences” section. c Tumour growth is enhanced in FSP-Cre+; FAKfl/fl mice. FSP-Cre+; FAKfl/fl and control FSP-Cre−;FAKfl/fl mice were injected orthotopically with either syngeneic breast cancer cells (E0771, n = 10 FSP-Cre+; FAKfl/fl mice and n = 18 FSP-Cre−;FAKfl/fl mice) or pancreatic ductal adenocarcinoma cells (TB32048, n = 10 FSP-Cre+; FAKfl/fl mice and 11 FSP-Cre−;FAKfl/fl mice). FSP-Cre+; FAKfl/fl and FSP-Cre−; FAKfl/fl mice were also crossed with MMTV-PyMT mice to generate MMTV+;FSP-Cre+;FAKfl/fl and MMTV+;FSP-Cre−;FAKfl/fl mice that developed spontaneous breast tumours. E0771 and TB32048 tumour growth was enhanced in FSP-Cre+;FAKfl/fl mice and the number of tumours per mouse increased significantly in MMTV+;FSP-Cre+;FAKfl/fl when compared with control mice. n = 11 MMTV+; FSP-Cre+;FAKfl/fl and 8 MMTV+;FSP-Cre−;FAKfl/fl mice. Graphs represent mean tumour volume ± s.e.m. Bar chart represents mean no. tumours per mouse ± s.e.m. d Picrosirius red staining of late-stage tumour sections from E0711, TB32048 and MMTV-PyMT tumours in FSP-Cre+; FAKfl/fl and FSP-Cre−; FAKfl/fl mice. Scatter plots represent picrosirius red image analysis (ImageJ) for individual tumours. n = 6 FSP-Cre−; FAKfl/fl and 7 FSP-Cre+; FAKfl/fl E0771 tumours; n = 14 FSP-Cre−; FAKfl/fl and 15 FSP-Cre+; FAKfl/fl TB32048 tumours; n = 8 FSP-Cre−; FAKfl/fl and 6 FSP-Cre+; FAKfl/fl MMTV tumours. Bar chart represents mean ± s.e.m. *P < 0.05, ***P < 0.001. nsd no significant difference. Statistical analysis, two-way ANOVA (c for E0771 and TB32048 growth curves); two-sided Student’s t-test (c for MMTV data, ***P < 0.0002 and d *P < 0.05). Scale bars, 1 cm (c); 100 μm (d).
Fig. 2
Fig. 2. Depletion of CAF-FAK reduces tumour blood vessel density in late stage tumours.
Histological analysis of blood vessel density and hypoxia in size-matched, age-matched late stage a E0771 (day 34) and b TB32048 (Day 33) tumours grown in FSP-Cre+; FAKfl/fl and FSP-Cre−; FAKfl/fl mice. Tumours were sectioned and immunostained for either endomucin or pimonidazole and the number of blood vessels or relative areas of hypoxia quantified across whole-tumour sections. A significant reduction in blood vessel density and increase in hypoxia were observed in late-stage tumours from FSP-Cre+; FAKfl/fl mice. Bar charts show quantitation of mean blood vessel density per mm2 ± s.e.m. and mean pimonidazole positive area fraction ± s.e.m (n = 5 (E0771) and 9 (TB32048) FSP-Cre−; FAKfl/fl and 6 (E0771) and 10 (TB32048) FSP-Cre+; FAKfl/fl tumours, for endomucin; n = 5 FSP-Cre−; FAKfl/fl and FSP-Cre+; FAKfl/fl E0771 tumours and 6 FSP-Cre−; FAKfl/fl and 5 FSP-Cre+; FAKfl/fl TB32048 tumours, for pimonidazole). c, d Blood vessel perfusion was measured by calculating the percentage of endomucin-positive blood vessels that were PE-PECAM positive. The functionality of tumour blood vessels was assessed by immunofluorescence staining of endomucin in mice perfused with PE-PECAM antibody on late-stage c E0771 breast and d TB32048 pancreatic tumour sections. The percentage of perfused blood vessels was not different between the two genotypes. Bar charts show mean percentage of perfused vessels (double positive) over total number of blood vessels (endomucin positive). n = 3 tumours from FSP-Cre−;FAKfl/fl and 3 tumours from FSP-Cre+;FAKfl/fl mice. Arrows, representative perfused vessels. Green: endomucin, red: PE-PECAM. Bar chart in c and d represents mean % perfused blood vessels ± s.e.m; two-sided Student’s t-test. nsd no significant difference. Scale bars, 25 μm. e, f Before tumour growth diverged significantly between genotypes, early stage, size-matched E0771 breast (day 21) and TB32048 pancreatic (day 21) tumours were also analysed for tumour angiogenesis (E0771: n = 6 tumours/genotype; TB32048: n = 6 tumours from FSP-Cre−;FAKfl/fl and 5 tumours from FSP-Cre+;FAKfl/fl mice) and hypoxia (E0771: n = 4 tumours/genotype; TB32048: n = 6 tumours from FSP-Cre−;FAKfl/fl and 5 tumours from FSP-Cre+;FAKfl/fl mice) as above. No changes in blood vessel density or hypoxia were detected at this early stage of tumour growth. Bar chart in e and f shows mean blood vessel density per mm2 ± s.e.m. Scale bars in a, b, e, f for endomucin, 25 μm; pimonidazole, 200 μm. For a and b, *P < 0.05, **P < 0.01. nsd, no significant difference. Statistical analysis, two-sided Student’s t-test.
Fig. 3
Fig. 3. FAK depletion  in FSP-1 positive CAFs alters malignant cell metabolism.
a 18F-FDG PET/CT imaging of early-stage, size-matched E0771 orthotopic breast tumours revealed enhanced glucose uptake in tumours grown in FSP-Cre+;FAKfl/fl mice when compared with controls. PET images expressed on the same scale, range = 0–7 SUV. Bar charts show mean maximum standardised uptake value (SUVmax) ± s.e.m. n = 6 FSP-Cre−;FAKfl/fl and 9 FSP-Cre+; FAKfl/fl mice. b, c FSP-Cre+; FAKfl/fl and FSP-Cre−; FAKfl/fl mice bearing early-stage, size-matched E0771 tumours were continuously infused with [U-13C6] glucose and LC-MS analysis of metabolites extracted from tumours. Results showed b an increase in M+6 isotopologue of glucose, with c an enrichment of isotopologues of lactate, succinate, fumarate, malate, aspartate and glutamate from tumours grown in FSP-Cre+;FAKfl/fl mice. Bar charts show mean % of the indicated isotopologue pool over the total metabolite pool ± s.e.m. n = 7 FSP-Cre−;FAKfl/fl and 9 FSP-Cre+; FAKfl/fl tumours. d Seahorse extracellular flux analysis of freshly sorted EpCAM+ malignant cells from tumours grown in MMTV+;FSP-Cre+;FAKfl/fl mice showed enhanced glycolysis and a significant increase in glycolytic capacity compared with control mice. Bar charts show mean ECAR ± s.e.m. n = 3 independent experiments; n = 8 MMTV+;FSP-Cre−;FAKfl/fl and 5 MMTV+;FSP-Cre+;FAKfl/fl cell technical repeats from a representative run. e The changes in glycolysis and glycolytic capacity were lost when malignant cells isolated from MMTV+;FSP-Cre+;FAKfl/fl and control mice were isolated and cultured for 3 days; n = 3 independent experiments, n = 6 MMTV+;FSP-Cre−;FAKfl/fl and 4 MMTV+;FSP-Cre+;FAKfl/fl cell technical repeats from the representative run. f Primary FAK-depleted and WT-CAFs have similar glycolysis and glycolytic capacity; n = 4 independent experiments, 4 technical repeats for each genotype from the representative run. g WT-CAFs treated with vehicle alone or FAK-kinase inhibitor (PF PF-573,228) have similar levels of glycolysis. n = 4 technical replicates. Bar charts in eg represent mean ECAR ± s.e.m. For ad *P < 0.05, **P < 0.01, ***P < 0.001, ****P < 0.0001. nsd, no significant difference. Statistical analysis, two-sided Student’s t-test.
Fig. 4
Fig. 4. Low stromal FAK expression enhance metabolic pathways in malignant cells.
a Phosphoproteomics analysis defines a significant enrichment of several metabolic processes in mouse malignant cells exposed to CM from FAK-depleted CAFs compared with malignant cells exposed to WT-CAF CM. b Table: the expression levels of several glycolysis enzymes are significantly upregulated (red) in proteomics analysis of mouse malignant cells exposed to FAK-depleted CAF CM when compared with malignant cells exposed to WT-CAF CM. Box and whisker plots indicate significant transcriptional upregulation of genes encoding glycolytic enzymes in the cancer cells of patient tumours with low stromal FAK compared with high stromal FAK. c Box and whisker plots, elevated IDH, SDH and FH gene transcription in the epithelial compartment of patient tumours with low stromal FAK. Table: Mouse proteomics data indicate a significant enrichment of IDH peptides in mouse malignant cells exposed to CM from FAK-depleted CAFs compared with malignant cells exposed to WT-CAF CM. d Box and Whisker plots show elevated transcription of genes encoding enzymes of fatty acid metabolism in the epithelial gene set of human breast cancer with low stromal FAK. Table: HADHA upregulation at the protein level in mouse malignant cells exposed to CM from FAK-depleted CAFs. For all human data, n = 39 breast cancer patients with high stromal FAK, n = 9 breast cancer patients with low stromal FAK (from Finak et al. dataset); for all mouse data n = 3 mouse malignant cell preparations exposed to WT-CAF CM and n = 3 mouse malignant cell preparations exposed to FAK-depleted CAF CM. Box and whisker plots—box denotes the interquartile range (IQR, Q1 25th percentile—Q3 75th percentile), and whisker denotes the maximum (Q3 + 1.5IQR) and minimum (Q1–1.5IQR). The median value is shown by the horizontal line within the box. *P < 0.05,**P < 0.01,***P < 0.001,****P < 0.0001. nsd, no significant difference. Statistical analysis, two-sided Student’s t-test. e The transcriptome of cancer cells in breast cancer patients with low vs high stromal FAK were compared using Reactome database. GSEA shows that many pathways regulating cellular metabolism are upregulated in the cancer cells in patient tumours with low stromal FAK expression levels. Disc sizes reflect the number of differentially expressed hits from each pathway. Colour bar indicates FDR q-value significance.
Fig. 5
Fig. 5. CAF-FAK depletion increases expression Ccl6 and Ccl12.
a Primary MMTV-derived malignant cells were incubated with the conditioned medium (CM) from primary WT and FAK-depleted CAFs for 48 h. CM from FAK-depleted CAFs enhanced the glycolysis, glycolytic capacity and glycolytic reserve of malignant cells significantly; n = 4 independent experiments; n = 5 WT CM incubated malignant cells and 3 FAK-depleted CM incubated malignant cells from the representative run. Bar chart shows mean ECAR ± s.e.m. b Exposure of malignant cells to CM from FAK-depleted CAFs only for 2 h also increased glycolytic capacity and reserve. Upon boiling the CM for 10 min at 100 °C to inactivate growth factors and cytokines, these metabolic alterations did not persist suggesting a predominantly non-metabolite based communication between CAFs and malignant cells in the regulation of malignant cell metabolism; n = 4 independent experiments, 5 technical repeats for each genotype from the representative run. Bar chart shows mean ECAR ± s.e.m. c Ontology enrichment analysis of quantitative proteomics data from FAK-depleted CAFs displayed PI3K and cytokine-mediated signalling cascades as the most enriched pathways relative to control WT-CAFs. d Proteome profiler arrays identified Ccl6, Ccl11, Ccl12 and Pentraxin-3 as the most upregulated cytokines in primary FAK-depleted CAFs compared with controls; n = 4 technical repeats from two independent cell preparations. Bar chart shows mean densitometry (AU) ± s.e.m. e qRT-PCR reveals enhanced Ccl6, Ccl12 transcription in FAK-depleted CAF cells; n = 2 WT and 4 FAK-depleted cell preps. Bar chart represents mean mRNA expression (fold change) ± s.e.m. f RNAscope images of Fsp-1 and Ccl6 or Ccl12 in tumour sections from MMTV+;FSP-Cre−;FAKfl/fl and MMTV+;FSP-Cre+;FAKfl/fl mice. Note the increased number of cytokine transcripts (purple) in FSP-1-positive cells (green) in MMTV+;FSP-Cre+; FAKfl/fl mice. Scale bars in f 50 μm. g CCL23, human orthologue of mouse Ccl6, is inversely correlated in human breast cancer patients with stromal FAK expression. *P < 0.05,**P < 0.01,***P < 0.001,****P < 0.0001. nsd, no significant difference. Statistical analysis, ae two-sided Student’s test.
Fig. 6
Fig. 6. CCR1/2 or PKA inhibition rescues the enhanced metabolism in malignant cells.
a Treatment of epithelial cells isolated from MMTV+;FSP-Cre−;FAKfl/fl mice with recombinant Ccl6 and Ccl12 for 5 h increases glycolytic capacity in extracellular flux analysis; n = 8 non-treated and 10 recombinant Ccl6 and Ccl12 epithelial cell treated technical replicates. b Extracellular flux analysis of malignant cells exposed to WT-CAF CM with or without CCR1i/CCR2i for 48 h shows that these inhibitors have no apparent effect on glycolysis, glycolytic capacity or glycolytic reserve; n = 8 biological repeats-CCR1i/CCR2i, n = 9 biological repeats + CCR1i/CCR2i. c Extracellular flux analysis of epithelial cells isolated from MMTV+;FSP-Cre;FAKfl/fl mice treated with CM from either WT or FAK-depleted CAFs in the absence or presence of the dual CCR1i/CCR2i shows that dual inhibition of CCR1 and CCR2 is sufficient to rescue the metabolic alterations in cancer cells treated with FAK-depleted CAF CM; n = 3 independent experiments; n = 12 WT-CAF-CM—CCR1i/CCR2i, n = 12 FAK-depleted CAF-CM—CCR1i/CCR2i, n = 10 FAK-depleted CAF-CM+CCR1i/CCR2i. d Effect of CCR1/CCR2- siRNA depletion on breast cancer cell E0771 metabolism. Without exposure to CAF-CM, under normal culture conditions, CCR1/CCR2 depletion in E0771 cells (n = 10 glycolytic capacity; n = 12 glycolytic reserve) does not affect glycolytic capacity or glycolytic reserve compared with no-treatment (NT) (n = 12), mock (n = 12) or scrambled (scr) (n = 12) negative controls. CCR1/CCR2 depletion in E0771 cells had no significant effect on glycolytic capacity (n = 10) or glycolytic reserve (n = 10) after exposure to WT-CAF CM, but significantly reduced the enhanced glycolytic capacity (n = 12) and glycolytic reserve (n = 12) after exposure to FAK-depleted CAF CM. Statistics, two-way ANOVA. Bar charts in ad show mean ECAR ± s.e.m. e E0771 tumour volumes, at day 28 post tumour cell inoculation in FSP-Cre−;FAKfl/fl and FSP-Cre+;FAKfl/fl mice. Cohorts: Untreated FSP-Cre−;FAKfl/fl mice (n = 22 mice); untreated FSP-Cre+;FAKfl/fl mice (n = 26 mice); vehicle-treated FSP-Cre−;FAKfl/fl mice (n = 15 mice); CCR1i/CCR2i-treated FSP-Cre−;FAKfl/fl mice (n = 10 mice) and CCR1i/CCR2i-treated FSP-Cre+;FAKfl/fl mice (n = 12 mice). Bar chart shows mean tumour volume (mm3) ± s.e.m. f FSP-Cre+; FAKfl/fl mice treated with CCR1i/CCR2i and vehicle-treated FSP-Cre−; FAKfl/fl mice, both bearing early-stage, size-matched E0771 tumours, were continuously infused with [U-13C6] glucose and LC-MS analysis of whole tumours was performed. Inhibition of CCR1/CCR2 reduced the levels of isotopologues of glucose, lactate, succinate, fumarate, malate, aspartate and glutamate from tumours grown in FSP-Cre+;FAKfl/fl mice. Bar charts show mean % of the indicated isotopologue pool over the total metabolite pool ± s.e.m. n = 4 FSP-Cre−; FAKfl/fl and 5 FSP-Cre+; FAKfl/fl tumours. g Kinase substrate enrichment analysis (KSEA) of phosphoproteomics data showed a significant enrichment of PKD1, p38δ, p90RSK, PKACA, ROCK2, PAK4, DAPK3, DAPK1, p38α and MLCK substrates in cancer cells exposed to CM from FAK-depleted CAFs; n = 3 independent cell lysates for each genotype, two-sided Student’s t-test. h Epithelial transcript levels of the genes encoding PRKAR1A, KSR, RAP1A, MAP2K3, RAC1, CTNNB1 and LEF1 are significantly enriched in human breast cancer gene set of cancers with low stromal FAK levels; Box and whisker plots show log-ration mRNA expression and include maximum and minimun data points, median value and 75th and 25th quartile. n = 39 patients with high stromal FAK and 9 patients with low stromal FAK, Student’s t-test. i Seahorse analysis of epithelial cells exposed to CM from WT-CAFs and FAK-depleted CAFs plus the PKA inhibitor, KT 5720 (+) or vehicle alone (veh) for 3 h show that treatment with PKA inhibitor reduces the enhanced glycolytic capacity and glycolytic reserve in primary tumour cells exposed to CM from FAK-depleted CAFs that of tumour cells exposed to WT-CAF CM. Bar chart shows mean ECAR ± s.e.m. n = 2 cell preparations, scatter dots represent n = 11 WT-CAF CM- veh, n = 5 FAK-depleted CAF-CM- veh, n = 6 FAK-depleted CAF-CM+ inhibitor technical repeats from one representative run. *P < 0.05, **P < 0.01, ***P < 0.001, ****P < 0.0001. nsd, no significant difference. Statistical analysis, two-sided Student’s t-test unless otherwise stated.

References

    1. Ying H, et al. Oncogenic Kras maintains pancreatic tumors through regulation of anabolic glucose metabolism. Cell. 2012;149:656–670. doi: 10.1016/j.cell.2012.01.058. - DOI - PMC - PubMed
    1. Bensaad K, et al. TIGAR, a p53-inducible regulator of glycolysis and apoptosis. Cell. 2006;126:107–120. doi: 10.1016/j.cell.2006.05.036. - DOI - PubMed
    1. Vander Heiden MG, DeBerardinis RJ. Understanding the intersections between metabolism and cancer biology. Cell. 2017;168:657–669. doi: 10.1016/j.cell.2016.12.039. - DOI - PMC - PubMed
    1. Sulzmaier FJ, Jean C, Schlaepfer DD. FAK in cancer: mechanistic findings and clinical applications. Nat. Rev. Cancer. 2014;14:598–610. doi: 10.1038/nrc3792. - DOI - PMC - PubMed
    1. Luo M, Guan JL. Focal adhesion kinase: a prominent determinant in breast cancer initiation, progression and metastasis. Cancer Lett. 2010;289:127–139. doi: 10.1016/j.canlet.2009.07.005. - DOI - PMC - PubMed

Publication types

MeSH terms