. 2020 Mar 10;11(1):1293.
doi: 10.1038/s41467-020-14968-9.

Integrated proteogenomic deep sequencing and analytics accurately identify non-canonical peptides in tumor immunopeptidomes

Affiliations

Integrated proteogenomic deep sequencing and analytics accurately identify non-canonical peptides in tumor immunopeptidomes

Chloe Chong et al. Nat Commun. .

Abstract

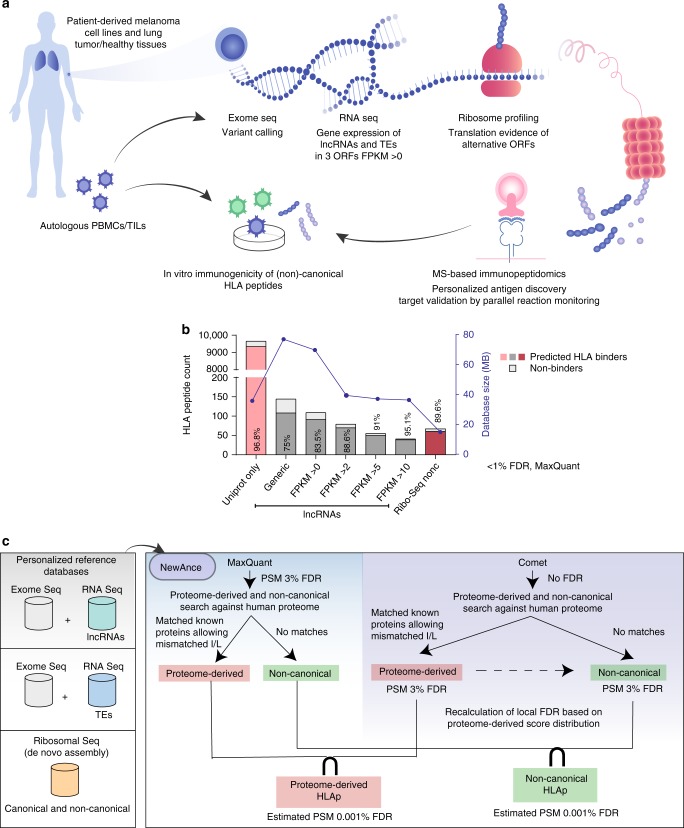
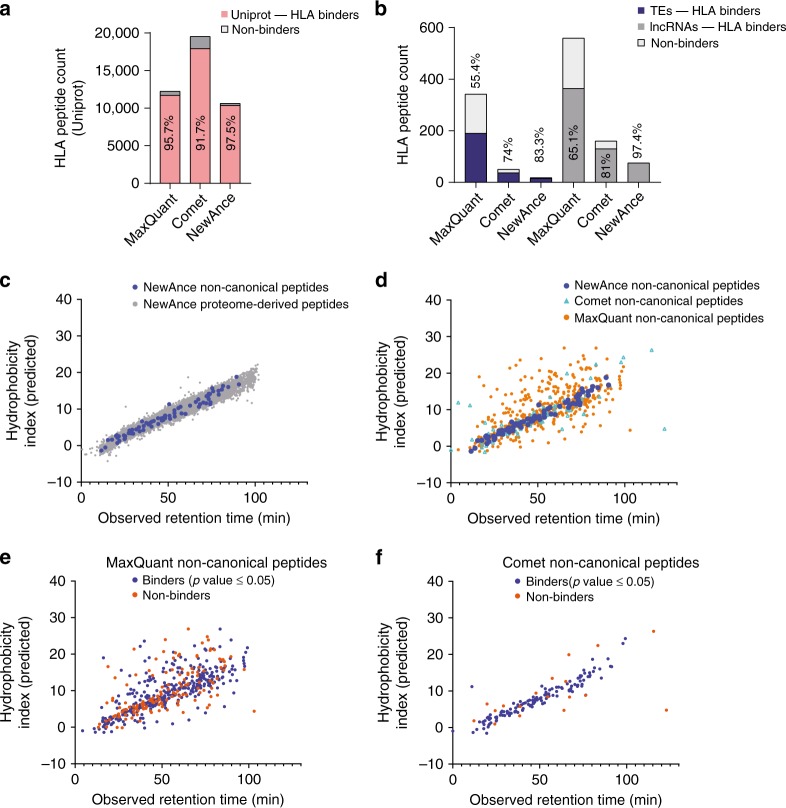
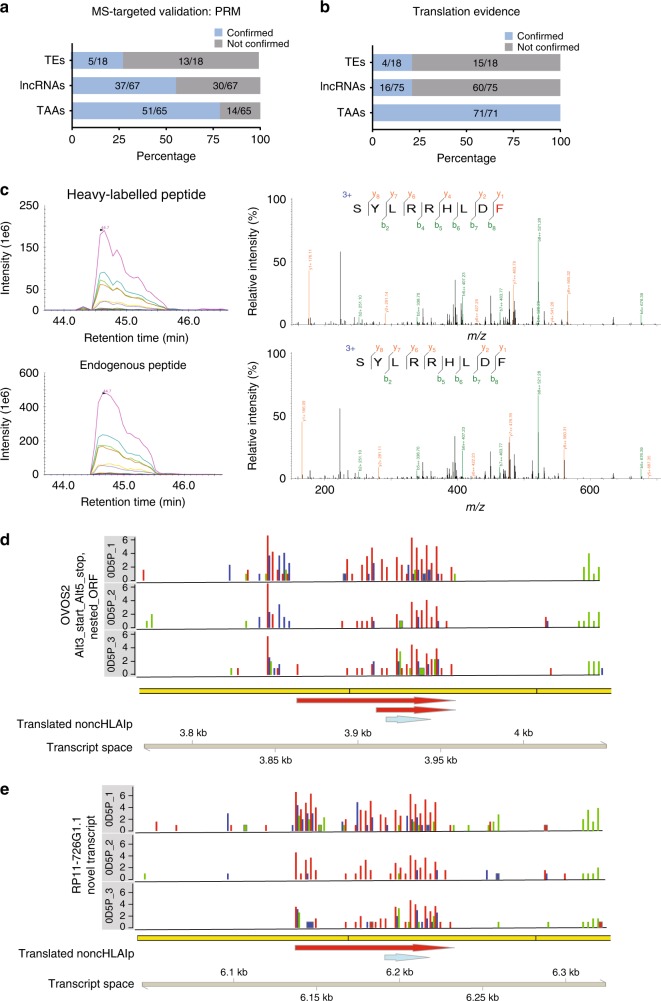
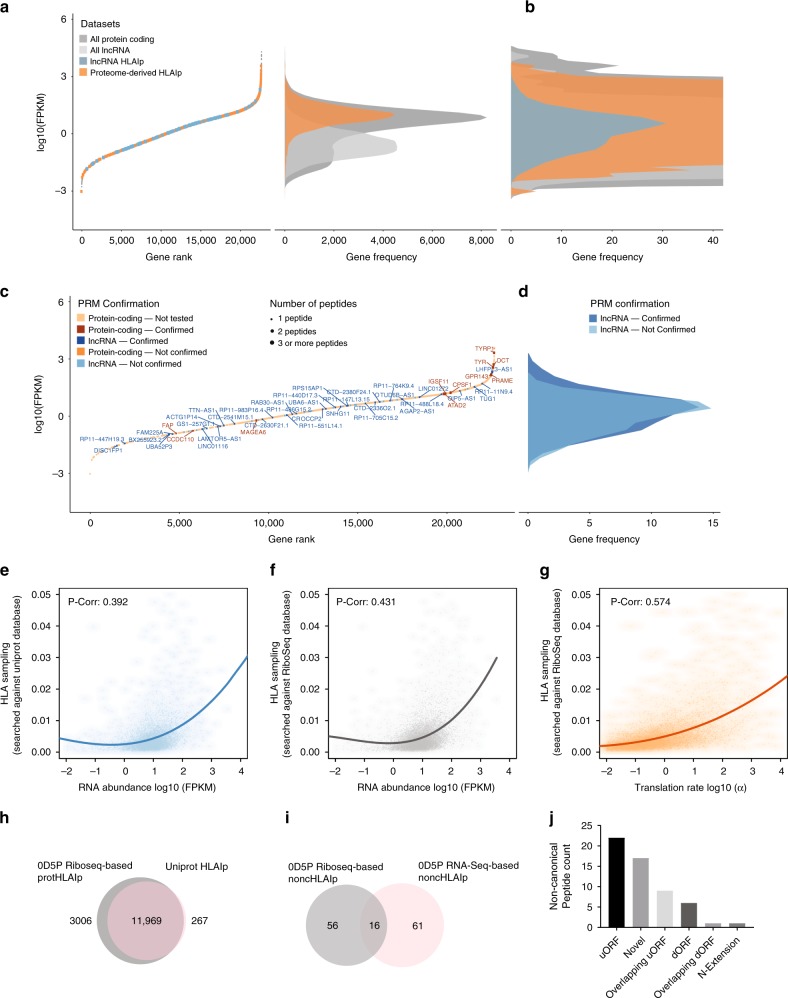
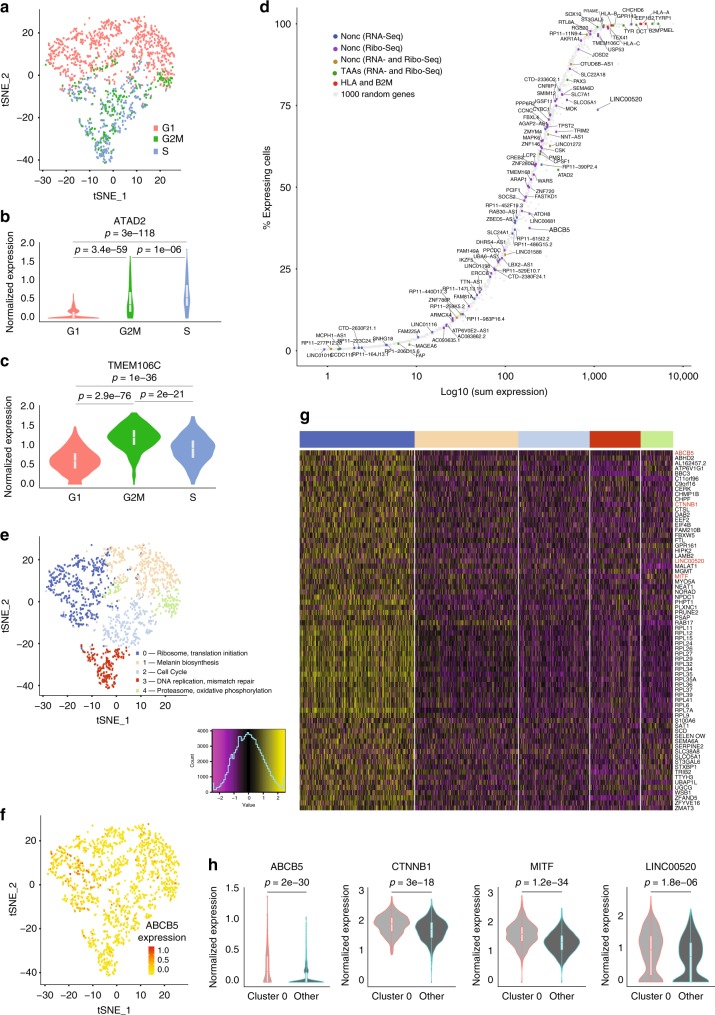
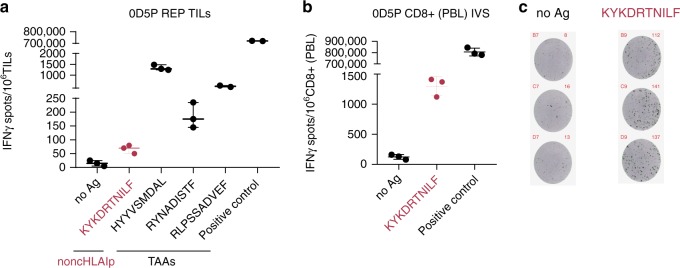
Efforts to precisely identify tumor human leukocyte antigen (HLA) bound peptides capable of mediating T cell-based tumor rejection still face important challenges. Recent studies suggest that non-canonical tumor-specific HLA peptides derived from annotated non-coding regions could elicit anti-tumor immune responses. However, sensitive and accurate mass spectrometry (MS)-based proteogenomics approaches are required to robustly identify these non-canonical peptides. We present an MS-based analytical approach that characterizes the non-canonical tumor HLA peptide repertoire, by incorporating whole exome sequencing, bulk and single-cell transcriptomics, ribosome profiling, and two MS/MS search tools in combination. This approach results in the accurate identification of hundreds of shared and tumor-specific non-canonical HLA peptides, including an immunogenic peptide derived from an open reading frame downstream of the melanoma stem cell marker gene ABCB5. These findings hold great promise for the discovery of previously unknown tumor antigens for cancer immunotherapy.


Conflict of interest statement

G.C. has received grants and research support from BMS, Celgene, Boehringer Ingelheim, Roche, Lovance and Kite, and worked with them as a coinvestigator in clinical trials. G.C. has received honouraria for consultations or presentations from Roche, Genentech, BMS, AstraZeneca, Sanofi-Aventis, Nextcure, and GeneosTx. G.C. has patents regarding antibodies and vaccines targeting the tumor vasculature as well as technologies related to T cell expansion and engineering for T cell therapy. G.C. receives royalties from the University of Pennsylvania. The remaining authors declare no competing interests.

Figures

Fig. 1
Fig. 1. A proteogenomics approach for the robust identification of noncHLAp.
a A schematic of the entire workflow is shown, where tissue samples or tumor cell lines were obtained from patients, and exome, RNA- and Ribo-Seq were performed to provide a framework to assess the non-canonical antigen repertoire. HLAp were immunoaffinity-purified from cancer cell lines and matched tumor/healthy lung tissues and then analyzed by MS. Immunopeptidomics spectra were then searched against RNA- and Ribo-Seq-based personalized protein sequence databases that contain non-canonical polypeptide sequences. MS-identified noncHLAIp were validated by targeted MS-based PRM and tested for immunogenicity using autologous T cells or PBMCs. b The percentage of predicted HLA binders of length 8–14 mer peptides with a MixMHCpred p-value ≤ 0.05 was used to evaluate the accuracy of the identified HLAIp by MaxQuant at 1% FDR as a function of database size (blue line). The percentage of predicted binders obtained for each condition is shown for each bar for the melanoma cell line 0D5P. c Different protein sequence databases combining whole-exome sequencing and inferences from RNA-Seq and Ribo-Seq data were utilized. NewAnce was implemented by retaining the PSM intersection of the two MS search tools MaxQuant and Comet, and applying group-specific FDR calculations for protHLAp and noncHLAp. Source data are provided as a Source Data file.
Fig. 2
Fig. 2. Two complementary methods to assess the accuracy of NewAnce.
a The percentages of predicted proteome-derived HLA-I binders in 0D5P were assessed with each MS search tool (MaxQuant and Comet at FDR 3%) and NewAnce. b Similar to a, the comparisons were performed for the different non-canonical antigen classes. c Hydrophobicity index calculations by SSRCalc for peptides identified in melanoma 0D5P. The observed mean retention time is plotted against the hydrophobicity indices for NewAnce-identified proteome-derived versus lncRNA-derived non-canonical peptides. d All peptides identified with each tool (MaxQuant, Comet, NewAnce) were analyzed based on their hydrophobicity indices. e Hydrophobicity index calculation for MaxQuant- or f Comet-identified 8- to 14-mer peptides, based on predicted HLA binding. Source data are provided as a Source Data file.
Fig. 3
Fig. 3. MS and ribosome footprint-based evidence of non-canonical peptide generation.
A set of proteome-derived tumor-associated antigens, and noncHLAIp (lncRNAs and TEs), from melanoma 0D5P were synthesized in their heavy-labeled form and spiked back into replicates of HLAIp eluted from 0D5P cells to confirm the presence of endogenous HLAIp. The proportions of confirmed and non-confirmed HLAIp as determined by a PRM and b Ribo-Seq-targeted validation are shown for each of the antigen classes. c An example of the co-elution profiles of the transitions of heavy-labeled and endogenous noncHLAIp (from lncRNA; SYLRRHLDF) from 0D5P (left) is shown. The MS/MS fragmentation pattern further confirms the presence of the endogenous peptide (Δm = 10 Da) (right). d, e The Ribo-Seq profiles of two source genes show the frequency of Ribo-Seq reads from the ribosome’s P-site in three replicates. Library size-normalized P-sites per basepair are shown on a log2 scale on the y-axis, with P-sites inferred as a constant offset from the 5ʹ end of the footprint for each read length. The colored bars represent different reading frames. The yellow bars below the plots represent exons. For example, the noncHLAIp SYLRRHLDF in OVOS2 (blue arrow) falls within two nested, Ribo-Seq-supported ORFs (red arrows), within which most P-sites (red bars) fall in the first reading frame. Source data are provided as a Source Data file.
Fig. 4
Fig. 4. RNA- and Ribo-Seq-based gene expression analyses from melanoma 0D5P.
a (Left panel) Genes are ranked based on their RNA expression levels in 0D5P, with protein-coding and presumed non-coding source genes, in which HLAIp were identified, marked in orange, or in blue, respectively. (Right panel) The frequency distributions of the gene expression levels of protein-coding and non-coding (lncRNA) genes are shown. b The region of interest is magnified to show the distribution of noncHLAIp source gene expression. c Plot restricted to source genes. Targeted MS validation was performed, and confirmations are denoted for all identified non-canonical peptides and for a subset of protHLAIp (selected TAAs). Confirmed hits indicate that one or more peptides from that source gene were validated by PRM. Point sizes represent the number of peptides identified per source gene. d Frequency distribution of gene expression for MS-confirmed versus non-confirmed (or inconclusive) noncHLAIp. Scatterplots show the correlation between e UniProt-based HLA-I sampling and RNA abundance, f Ribo-Seq-based HLA-I sampling and RNA abundance, and g Ribo-Seq-based HLA-I sampling and translation rate. HLA-I sampling was calculated from the adjusted peptide counts normalized by protein length. Determination of the correlation between gene expression and HLA-I sampling was assessed by fitting a polynomial curve of degree 3 to each dataset. Pearson correlation values were calculated to assess the correlation between the fitted curve and the corresponding dataset. h With data derived from 0D5P, a comparison of the overall overlap in unique HLAIp identified with RNA-Seq-based and Ribo-Seq-based assembled databases for MS search is shown. i Overlap of noncHLAIp identified by RNA-Seq- and Ribo-Seq-based searches. j The total number of noncHLAIp identified by Ribo-Seq is depicted for each of the respective ORF types. Source data are provided as a Source Data file.
Fig. 5
Fig. 5. scRNA-Seq reveals non-coding transcriptional heterogeneity in melanoma 0D5P.
a t-SNE plot of the 1365 cells colored by their “cell cycle” scores. b Examples of cell cycle dependent genes: ATAD2, a tumor-associated antigen, and c TMEM106C, from which a noncHLAIp originated. d Genes of interest were plotted based on their sum normalized expression by scRNA-Seq and ordered based on the percentage of cells that expressed the gene. The color codes denote the type of HLAIp identified from those genes. e t-SNE plot of the 1365 cells colored by the five identified clusters. Clusters were annotated based on functional enrichment analyses of marker genes. f t-SNE plot highlighting the expression of the ABCB5 gene enriched in cluster 0. g Heatmap showing the scaled and centered expressions of marker genes in cluster 0. The cluster colors from e are represented above the plot. h Expression profiles of four marker genes in cluster 0 over all other clusters, including two well-known cancer biomarkers, MITF and CTNNB1, and two source genes for which noncHLAIp were identified, the ABCB5 gene with a dORF and LINC00520. The p-values represented in b, c, and h were obtained with Wilcoxon tests. Source data are provided as a Source Data file.
Fig. 6
Fig. 6. Non-coding source gene expression in healthy tissues.
A comparison of presumed non-coding source gene expression in the investigated melanoma samples to that in healthy tissues (GTEx) reveals that a substantial proportion of source non-coding genes are tumor-specific. Heatmap of lncRNA source genes showing the 90th percentile gene expression levels across 30 healthy tissues on the left and the gene expression levels across our investigated melanoma samples on the right. Tissue gene expression was classified as not expressed (90th percentile TPM ≤ 1) in any, 1–3, or >3 tissues other than testis to assess tumor specificity. Specifically for sample 0D5P, a total of 21.4% of the lncRNA source genes were considered as tumor-specific compared to <1% of the randomly selected protein-coding source genes with similar expression levels (p-value = 1.04 e-33). The number of HLAIp identified per gene is depicted as well as the gene (GENCODE) and sample type. Source data are provided as a Source Data file.
Fig. 7
Fig. 7. Non-coding source gene expression from lung cancer patient samples in healthy tissues.
A comparison of presumed non-coding source gene expression in the investigated samples to that in healthy tissues (GTEx). a Heatmap of lncRNA source genes showing the 90th percentile gene expression levels across 30 healthy tissues on the left and the gene expression levels identified in lung tissue samples on the right. Tissue gene expression was classified as not expressed (90th percentile TPM ≤ 1) in any, 1–3, or >3 tissues other than testis to assess tumor specificity. The number of HLAIp identified per gene is depicted as well as the gene (GENCODE) and sample type. b Specifically, this was also plotted for the tumor-specific noncHLAIp identified in lung cancer patient C3N-02289. Source data are provided as a Source Data file.
Fig. 8
Fig. 8. NoncHLAIp can be shared across individuals.
a The noncHLAIp-centric heatmap (left) shows the corresponding presumed non-coding gene expression (90th percentile) across healthy tissues as well as in our investigated samples (middle). The peptides that were identified by MS across the investigated samples, and therefore shared, are outlined in the rightmost heatmap. Validation by PRM was performed for multiple noncHLAIp across the corresponding samples and are denoted with cross markings. b NoncHLAIp identified across a large collection of immunopeptidomics datasets (ipMSDB) consisting of both cancer and healthy samples. Tumor-specific noncHLAIp were re-identified and a trend of enrichment in cancer samples was observed. The noncHLAIp sequences can be found in the source data file. Cancer samples are labeled in shades of blue, and the star symbol include tumor metastases, myeloma, uterine, brain, and liver cancer. Healthy samples are indicated in shades of red, and the hashtag symbol include fibroblast cells and epithelial cells. c Boxplot depicting the ratio of noncHLAIp over protHLAIp identified in the different groups of samples derived from ipMSDB (healthy n = 27, cancer n = 63, melanoma n = 25) One-sided t-test was performed, without multiple testing correction. Healthy versus cancer p-value = 0.17, healthy versus melanoma p-value = 0.12. Please refer to the Methods section for boxplot parameters. Source data are provided as a Source Data file.
Fig. 9
Fig. 9. Non-canonical ABCB5 peptide induced an IFNγ response.
a Reactivity was measured in melanoma 0D5P by the IFNγ ELISpot assay using autologous REP TILs. Representative example of three TAAs from TYR and TYRP1 and one non-canonical dORF-derived HLAIp from ABCB5 (written in red) that induced an IFNγ response. b In addition, a representative example of CD8+ T lymphocytes from PBLs is shown when re-challenged with autologous CD4+ blasts together with 1 μM of the non-canonical ABCB5 HLAIp. (No Ag: no peptide, positive control: 1x cell stimulation cocktail).c Representative images of the IFNγ ELISpot response against the non-canonical ABCB5 peptide. In a and b, T cell reactivity for every peptide was validated by ≥ 2 independent experiments. Please refer to the Methods section for boxplot parameters. Source data are provided as a Source Data file.

Similar articles

Cited by

References

    1. Schumacher TN, Schreiber RD. Neoantigens in cancer immunotherapy. Science. 2015;348:69–74. doi: 10.1126/science.aaa4971. - DOI - PubMed
    1. Yarchoan M, Johnson BA, 3rd, Lutz ER, Laheru DA, Jaffee EM. Targeting neoantigens to augment antitumour immunity. Nat. Rev. Cancer. 2017;17:569. doi: 10.1038/nrc.2017.74. - DOI - PubMed
    1. Ott PA, et al. An immunogenic personal neoantigen vaccine for patients with melanoma. Nature. 2017;547:217–221. doi: 10.1038/nature22991. - DOI - PMC - PubMed
    1. Sahin U, et al. Personalized RNA mutanome vaccines mobilize poly-specific therapeutic immunity against cancer. Nature. 2017;547:222–226. doi: 10.1038/nature23003. - DOI - PubMed
    1. Zajac P, et al. MAGE-A antigens and cancer immunotherapy. Front. Med. (Lausanne) 2017;4:18. - PMC - PubMed

Publication types