. 2020 Mar 10;10(1):4409.
doi: 10.1038/s41598-020-61236-3.

MicroRNA-mRNA networks define translatable molecular outcome phenotypes in osteosarcoma

Affiliations

MicroRNA-mRNA networks define translatable molecular outcome phenotypes in osteosarcoma

Christopher E Lietz et al. Sci Rep. .

Abstract

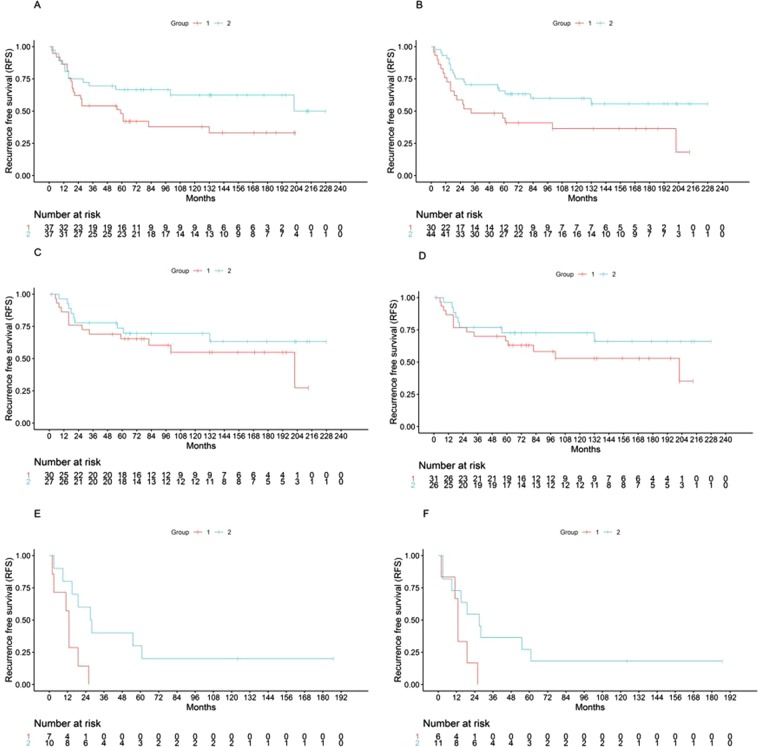
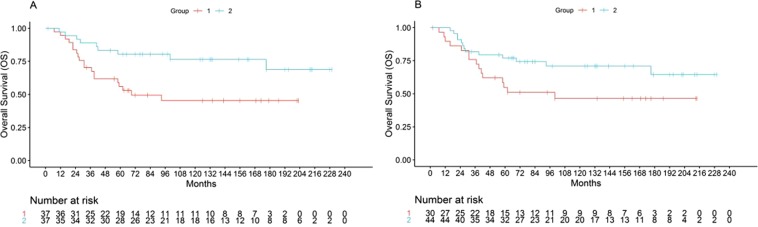
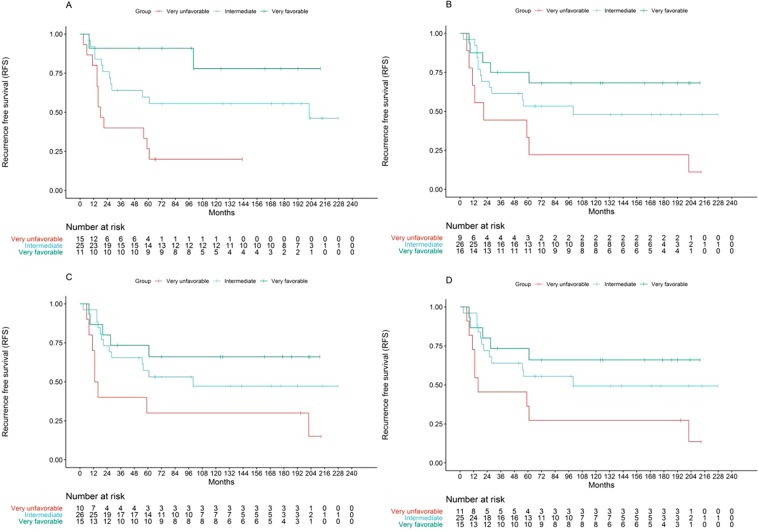
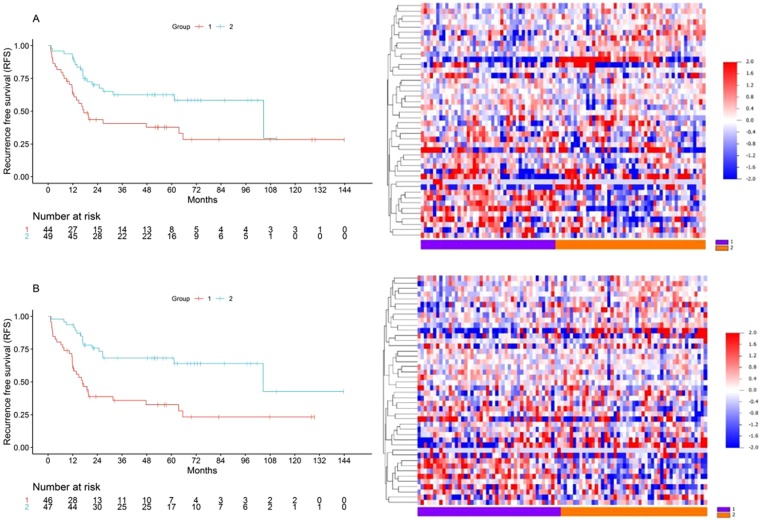
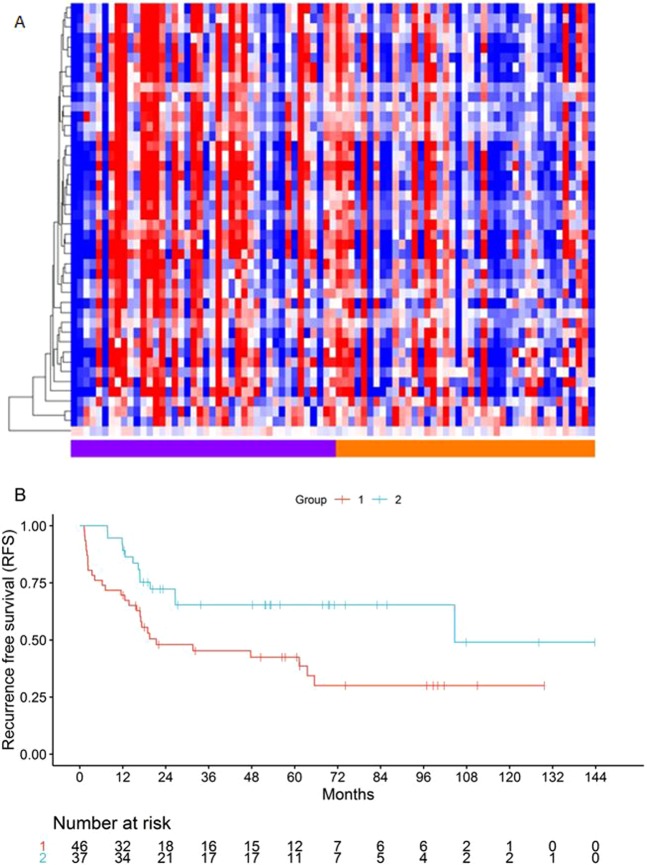
There is a lack of well validated prognostic biomarkers in osteosarcoma, a rare, recalcitrant disease for which treatment standards have not changed in over 20 years. We performed microRNA sequencing in 74 frozen osteosarcoma biopsy samples, constituting the largest single center translationally analyzed osteosarcoma cohort to date, and we separately analyzed a multi-omic dataset from a large NCI supported national cooperative group cohort. We validated the prognostic value of candidate microRNA signatures and contextualized them in relevant transcriptomic and epigenomic networks. Our results reveal the existence of molecularly defined phenotypes associated with outcome independent of clinicopathologic features. Through machine learning based integrative pharmacogenomic analysis, the microRNA biomarkers identify novel therapeutics for stratified application in osteosarcoma. The previously unrecognized osteosarcoma subtypes with distinct clinical courses and response to therapy could be translatable for discerning patients appropriate for more intensified, less intensified, or alternate therapeutic regimens.


Conflict of interest statement

The authors declare no competing interests.

Figures

Figure 1
Figure 1
Kaplan-Meier log-rank Recurrence Free Survival analysis of candidate profiles on the MGH dataset. Unsupervised hierarchal clustering: (A) 5-miRNAs, Median RFS 59 vs 202 months, p = 0.06, (B) 22 miRNAs, 33 months vs not reached, p = 0.032. Supervised signed average prediction: 5 miRNAs, stratified p = 0.031, median RFS: (C) Not metastatic: 202 months vs not reached, (E) Metastatic: 13 vs 27 months. 22 miRNAs, stratified p = 0.042, median RFS: (D) Not metastatic: 202 months vs not reached, (F) Metastatic: 13 vs 27 months.
Figure 2
Figure 2
Kaplan-Meier log-rank Overall Survival analysis of candidate profiles on the MGH dataset by unsupervised hierarchical clustering. (A) 5-miRNAs, Median OS 69 months vs not reached, p = 0.012, (B) 22 miRNAs, 100 months vs not reached, p = 0.061.
Figure 3
Figure 3
Kaplan-Meier log rank Recurrence Free Survival analysis of groups generated by a composite classification rule combining miRNA profiles and pathologically assessed chemoresponse (PCR). Three groups were defined: “Very favorable” (good prognostic profile/optimal chemoresponse, top curve), “very unfavorable” (poor prognostic profile/suboptimal chemoresponse, bottom curve) and “intermediate” (good prognostic profile/suboptimal chemoresponse, or poor prognostic profile/optimal chemoresponse, middle curve). Clustering: (A) 5 miRNA-profile/PCR, Median RFS 18 vs 202 months vs not reached, p = 0.003. (B) 22 miRNA-profile/PCR, Median RFS 21 vs 100 months vs not reached, p = 0.026. Signed average: (C) 5 miRNA-profile/PCR, Median RFS 13 vs 100 months, vs not reached, p = 0.039. (D) 22 miRNA-profile/PCR, Median RFS 16 vs 100 months vs not reached, p = 0.039.
Figure 4
Figure 4
Kaplan-Meier Recurrence Free Survival analysis and gene target expression heatmaps of survival subgroups generated with the union of the restrictive list gene targets of the 5-miRNA profile for RFS. (A) Unsupervised clustering, median RFS 17 (Group1) vs 105 months (Group2), log rank p = 0.007. (B) Supervised signed average prediction, median RFS 17 (Group1) vs 105 (Group2) months, log rank p = 0.001.
Figure 5
Figure 5
(A) Heatmap depicting methylation differences between two groups defined by unsupervised hierarchal clustering using the 5-miRNA profile. (B) Kaplan-Meier Recurrence Free Survival analysis of sample groups generated by unsupervised hierarchal clustering of the methylation probes annotated to the 5-miRNA prognostic profile. Median RFS 21 vs 105 months, log rank p = 0.011.

References

    1. Mirabello L, Troisi RJ, Savage SA. Osteosarcoma incidence and survival rates from 1973 to 2004: data from the Surveillance, Epidemiology, and End Results Program. Cancer. 2009;115:1531–1543. doi: 10.1002/cncr.24121. - DOI - PMC - PubMed
    1. Savage SA, Mirabello L. Using epidemiology and genomics to understand osteosarcoma etiology. Sarcoma. 2011;2011:548151. doi: 10.1155/2011/548151. - DOI - PMC - PubMed
    1. Bielack SS, et al. Methotrexate, Doxorubicin, and Cisplatin (MAP) Plus Maintenance Pegylated Interferon Alfa-2b Versus MAP Alone in Patients With Resectable High-Grade Osteosarcoma and Good Histologic Response to Preoperative MAP: First Results of the EURAMOS-1 Good Response Randomized Controlled Trial. J. Clin. Oncol. 2015;33:2279–2287. doi: 10.1200/JCO.2014.60.0734. - DOI - PMC - PubMed
    1. Maki RG. Ifosfamide in the neoadjuvant treatment of osteogenic sarcoma. J. Clin. Oncol. 2012;30:2033–2035. doi: 10.1200/JCO.2012.42.3285. - DOI - PubMed
    1. Ferrari S, et al. Neoadjuvant chemotherapy with methotrexate, cisplatin, and doxorubicin with or without ifosfamide in nonmetastatic osteosarcoma of the extremity: an Italian sarcoma group trial ISG/OS-1. J. Clin. Oncol. 2012;30:2112–2118. doi: 10.1200/JCO.2011.38.4420. - DOI - PubMed

Publication types

MeSH terms