. 2020 Mar 10;10(1):4433.
doi: 10.1038/s41598-020-60696-x.

Chemokine releasing particle implants for trapping circulating prostate cancer cells

Affiliations

Chemokine releasing particle implants for trapping circulating prostate cancer cells

YiHui Huang et al. Sci Rep. .

Abstract

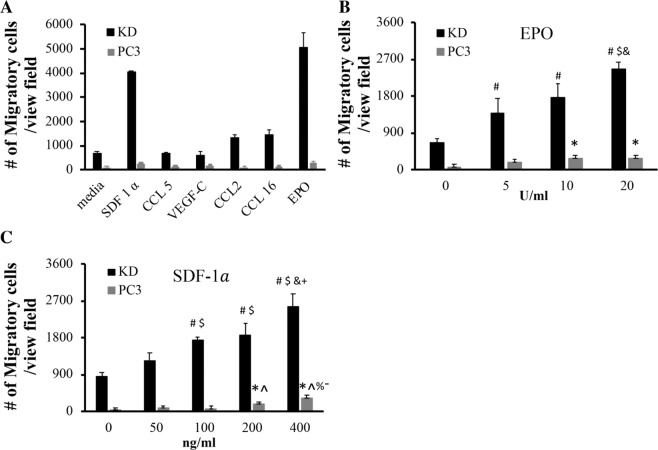
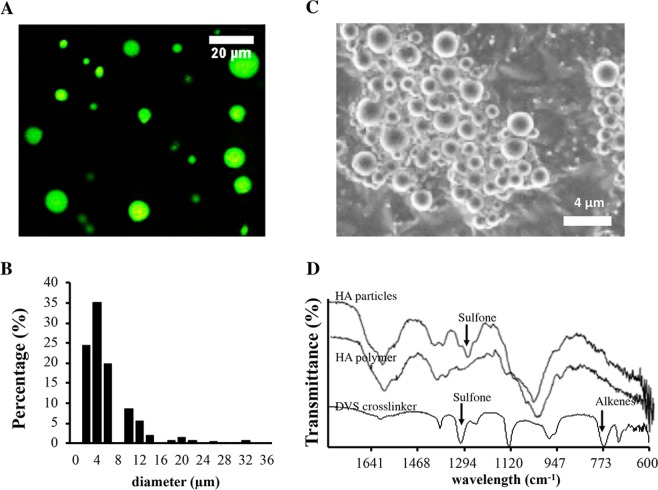
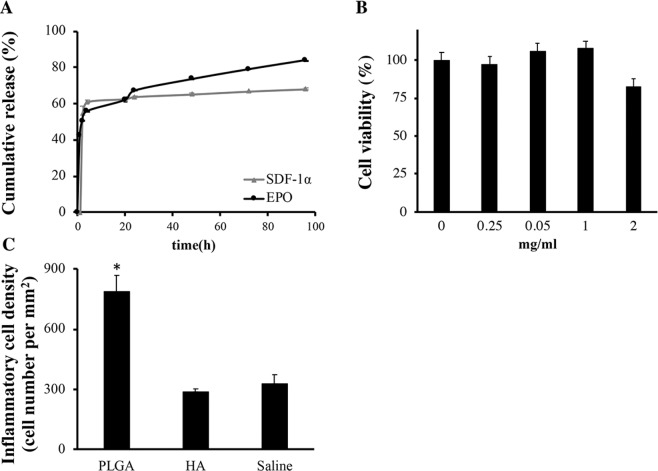
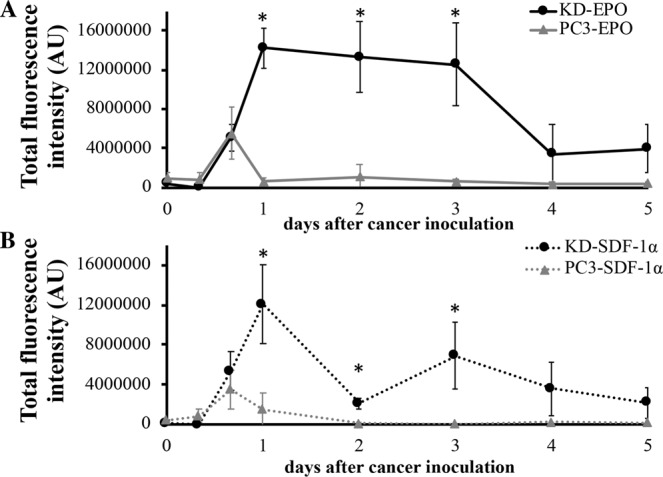
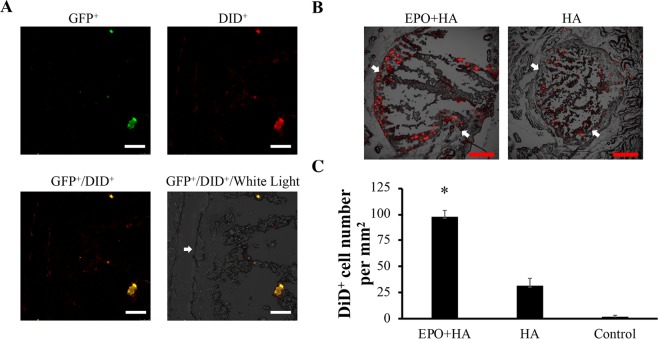
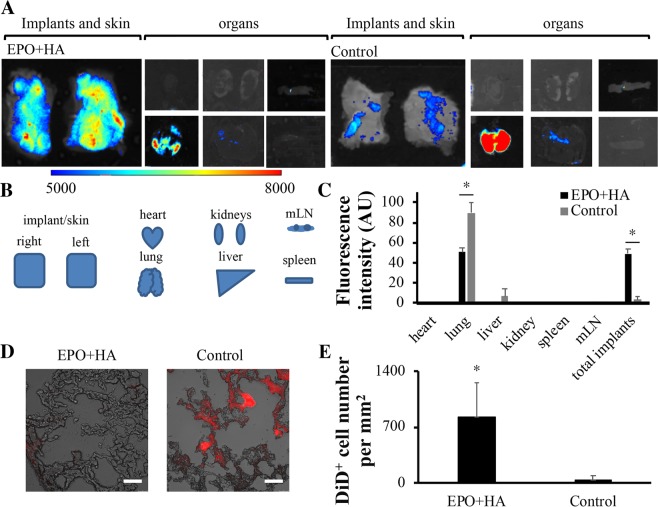
Prostate cancer (PCa) is the most prevalent cancer in U.S. men and many other countries. Although primary PCa can be controlled with surgery or radiation, treatment options of preventing metastatic PCa are still limited. To develop a new treatment of eradicating metastatic PCa, we have created an injectable cancer trap that can actively recruit cancer cells in bloodstream. The cancer trap is composed of hyaluronic acid microparticles that have good cell and tissue compatibility and can extend the release of chemokines to 4 days in vitro. We find that erythropoietin (EPO) and stromal derived factor-1α can attract PCa in vitro. Animal results show that EPO-releasing cancer trap attracted large number of circulating PCa and significantly reduced cancer spreading to other organs compared with controls. These results support that cancer trap may serve as a unique device to sequester circulating PCa cells and subsequently reduce distant metastasis.


Conflict of interest statement

The authors declare no competing interests.

Figures

Figure 1
Figure 1
The effects of chemokines on cancer migration. The in vitro migration of PCa cells under different chemokines and growth factors was determined using Transwell system. The studies were carried out using either PC3 or KD cells. (A) Migration of KD cells treated with different chemokines and growth factors –EPO (100 U/ml), SDF-1α (100 ng/ml), CCL5 (100 ng/ml), VEGF-C (100 ng/ml), CCL2 (100 ng/ml) and CCL16 (100 ng/ml) was determined. (B) The influence of different concentrations of EPO (ANOVA p < 0.05 among groups of KD and PC3 cells. #, $ and & indicate p < 0.05 versus 0, 5 and 10 U/ml in KD cells and * indicates p < 0.05 versus 0 U/ml in PC3 cells, respectively.) and (C) SDF-1α (ANOVA p < 0.05 among groups of KD and PC3 cells. #, $, & and + indicate p < 0.05 versus 0, 50, 100 and 200 ng/ml in KD cells and *, ^, % and - indicate p < 0.05 versus 0, 50, 100 and 200 ng/ml in PC3 cells, respectively.) on the migration of KD and PC3 cells. Data are mean ± SD (n = 5). Experiments were confirmed statistically using ANOVA with Tukey-Kramer test.
Figure 2
Figure 2
Properties of hyaluronic acid particles. The physical and chemical properties of hyaluronic acid (HA) particle with high crosslinking density (DVS: HA = 6.33:1) were characterized. (A) Morphology and (B) size distribution of HA particles were documented under fluorescence microscope. The sizes of 200 HA particles were compiled to determine the size distribution of HA particles. (C) Scanning electron microscope images of HA particles. (D) IR spectrum of HA particles, HA (700 K) polymers and DVS crosslinker. It illustrates that stretching vibration of sulfone (≈1300 cm−1) appears and bending vibration of alkenes (≈780 cm−1) disappears after HA polymers are crosslinked with DVS.
Figure 3
Figure 3
Slow release property and cell/tissue compatibility of HA particles. The slow release property, cell and tissue compatibility of hyaluronic acid (HA) particles with crosslinking densities (DVS: HA = 6.33:1, labeled as “HA”) were characterized. (A) The release rate of Cy5 labeled EPO or SDF-1α (Cy5-EPO or Cy5-SDF-1α) was quantified in vitro. (B) The cell compatibility of HA particles was determined using 3T3 fibroblasts in vitro (n = 5). (C) The tissue compatibility of HA particles was measured in vivo using subcutaneous implantation mice model. The density of inflammatory cells surrounding particle implants was quantified histologically to reflect the extent of tissue compatibility of different particle implants (100x magnification). (n = 3) Data are mean ± SD. (Student’s t-test, *indicates p < 0.05 versus Saline group).
Figure 4
Figure 4
In vivo dynamic cancer migration pattern in cancer trap. The ability of erythropoietin (EPO) and stromal derived factor-1α (SDF-1α)-loaded HA particles to recruit PCas was evaluated for the different periods of time (8 hours to 5 days) in vivo. Metastatic KD and parental PC3 cells were used in this investigation. Quantitative results of cell recruitment to (A) EPO-loaded and (B) SDF-1α-loaded implants at different time points were graphed and compared. (n = 3) Data are mean ± SD. (Student’s t-test, *p < 0.05).
Figure 5
Figure 5
Optimization of cancer trap. The efficiency of EPO-loaded and SDF-1α-loaded particles to recruit metastatic KD and parental PC3 Qtracker-labeled cancer cells was evaluated in vivo. (A) After cancer inoculation for 36 hours, whole animal images were taken. (B) The fluorescent intensity at the particle implant sites was quantified. The estimated number of KD cells at EPO and SDF-1α particle implant sites are 67,000 and 53,000 cells per implant, respectively. The estimated PC3 cells at EPO and SDF-1α particle implant sites are 8,960 and 7,750 cells per implant, respectively. N = 3 in all groups. Data are shown as mean ± SD. (Student’s t-test, *p < 0.05).
Figure 6
Figure 6
Histological analysis. Tissue sections were made and imaged to determine the distribution of KD cells in and surrounding particle implants. NIR images of EPO-loaded particles show the presence of DiD-labeled GFP expressing KD cells in and surrounding the implants. HA particles alone and particle free tissue were used as negative control. (A) Merged images showed DiD+ (red) and GFP+ (green) cells were co-localized in EPO implant (200x magnification). (B) The representative low magnification (50×) of images showed the overlapping fluorescent signals of DiD+ (red) KD cells in EPO-loaded implant and HA particles alone. (C) Quantification of DiD+ cells at the site of EPO-loaded particles (labeled as “EPO + HA”, 98 ± 6 cells/mm2), particles alone (labeled as “HA”, 31 ± 7 cells/mm2) and particle free tissue control (labeled as “Control”, 1 ± 2 cells/mm2). (n = 3) Data are present as mean ± SD. (Student’s t-test, *p < 0.05 compared to HA.) Scale bar: 100 µm (white) and 300 µm (red). White arrows point to the interface between the skin tissue and the implant and the areas between two arrows are implanted sites.
Figure 7
Figure 7
Reduction of cancer metastasis via cancer trap. Biodistribution of KD cells treated with the EPO-loaded particles or untreated control was quantified based on the measurement of organ-specific fluorescent intensities. To observe the biodistribution, NIR-labeled cancer cells were administered intravenously 12 hours following subcutaneous particles implantation injection or no treatment. (A) NIR imaging of internal organs were imaged 36 hours after cell administration. (B) A depiction of the organ arrangement. (C) The percentages of the cell distribution in different organs were calculated based on the individual organ fluorescent intensity divided by total internal organ fluorescent intensities. (D) Histological images of metastatic lung showed the accumulation of KD cells in lung (400X magnification). Scale bar: 50 µm (E) The lung tissue sections were used to quantify DiD+ cancer cells in lung sections from animals with EPO-loaded particles (EPO + HA) (829 ± 429.6) vs. untreated control (Control) (44 ± 49.8) groups. (n = 4) Data are mean ± SD. (Student’s t-test, *p < 0.05) Mesenteric lymph nodes is abbreviated to mLN.

Similar articles

Cited by

References

    1. Siegel RL, Miller KD, Jemal A. Cancer statistics, 2019. CA. Cancer J. Clin. 2019;69:7–34. doi: 10.3322/caac.21551. - DOI - PubMed
    1. Tannock IF, et al. Docetaxel plus Prednisone or Mitoxantrone plus Prednisone for Advanced Prostate Cancer. N. Engl. J. Med. 2004;351:1502–1512. doi: 10.1056/NEJMoa040720. - DOI - PubMed
    1. Shen MM, Abate-Shen C. Molecular genetics of prostate cancer: new prospects for old challenges. Genes Dev. 2010;24:1967–2000. doi: 10.1101/gad.1965810. - DOI - PMC - PubMed
    1. Wang S, et al. Prostate-specific deletion of the murine Pten tumor suppressor gene leads to metastatic prostate cancer. Cancer Cell. 2003;4:209–22. doi: 10.1016/S1535-6108(03)00215-0. - DOI - PubMed
    1. Koo KC, et al. Predictors of survival in prostate cancer patients with bone metastasis and extremely high prostate-specific antigen levels. Prostate Int. 2015;3:10–15. doi: 10.1016/j.prnil.2015.02.006. - DOI - PMC - PubMed

Publication types