. 2020 Mar 10;10(1):4462.
doi: 10.1038/s41598-020-60563-9.

Using the circulating proteome to assess type I interferon activity in systemic lupus erythematosus

Affiliations

Using the circulating proteome to assess type I interferon activity in systemic lupus erythematosus

Michael A Smith et al. Sci Rep. .

Abstract

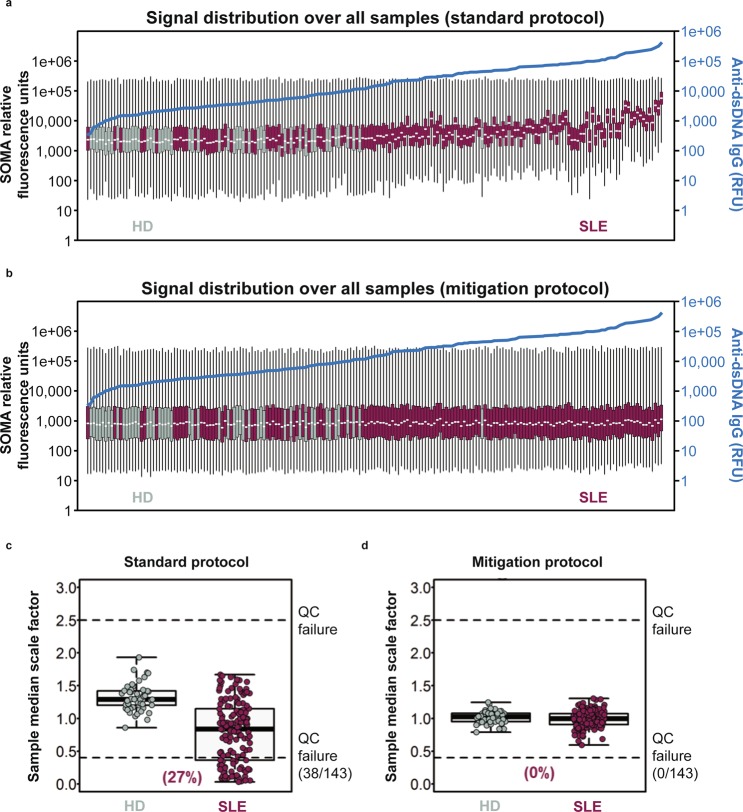
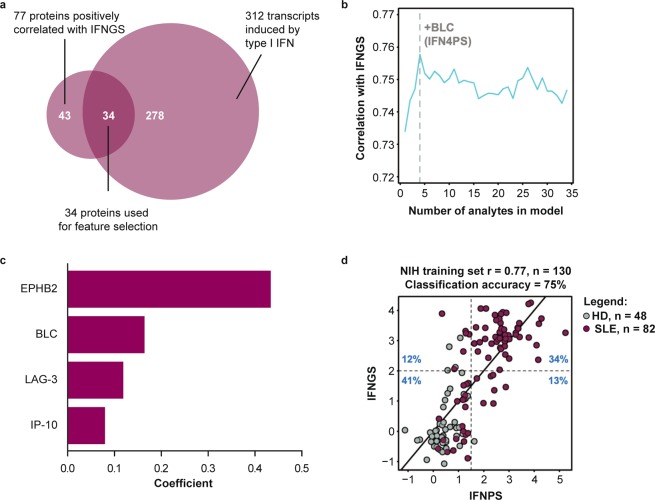
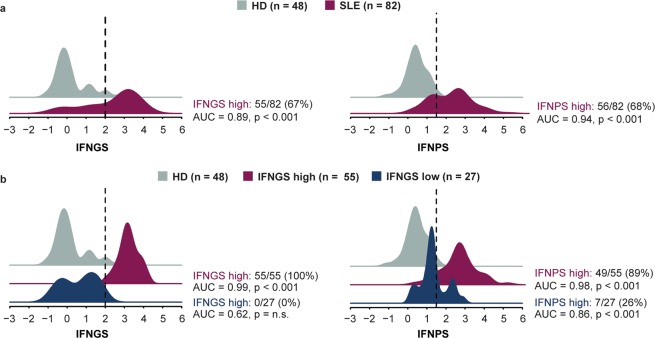
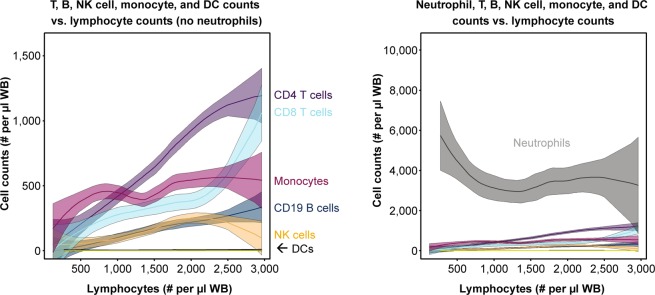
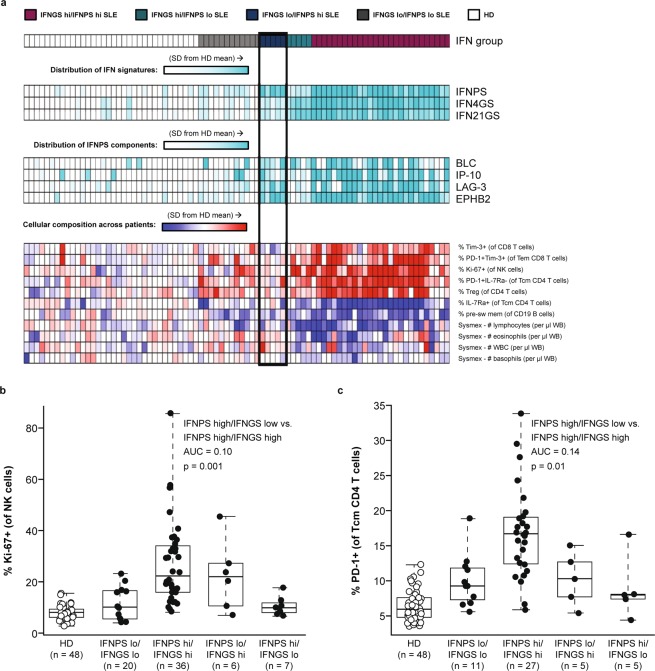
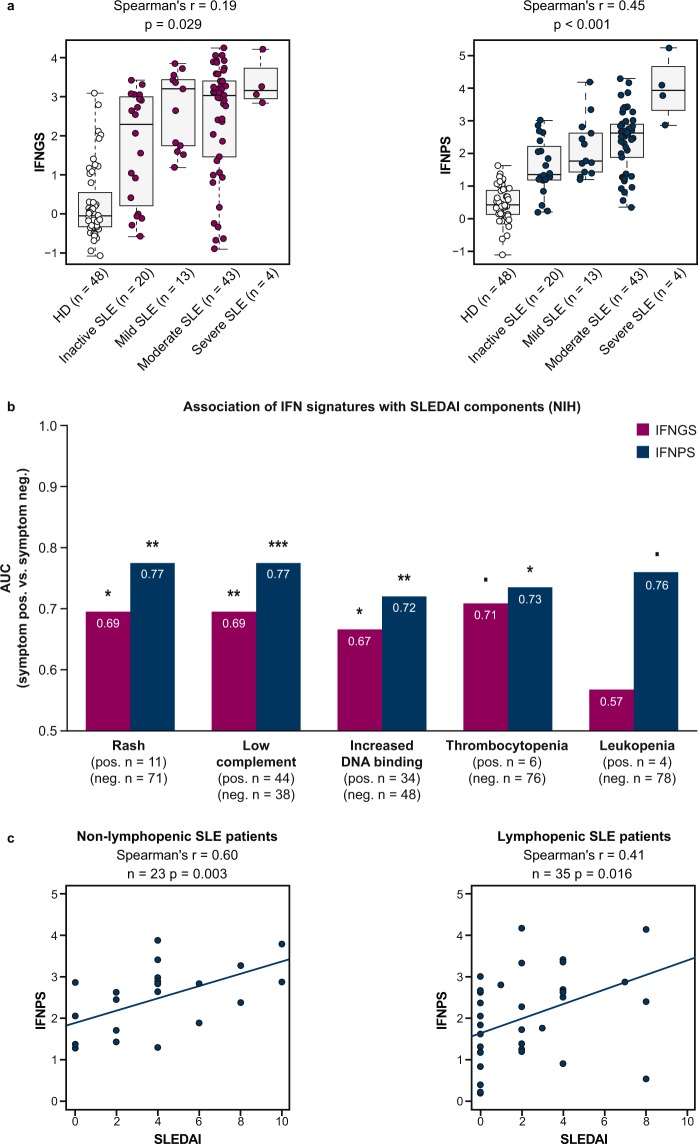
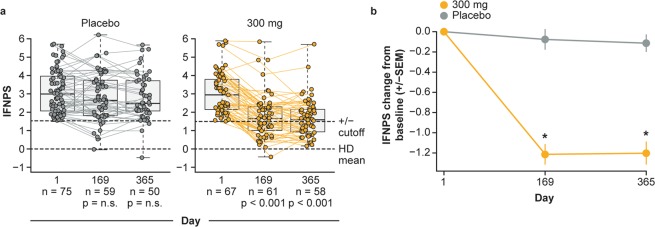
Type I interferon (IFN) drives pathology in systemic lupus erythematosus (SLE) and can be tracked via IFN-inducible transcripts in blood. Here, we examined whether measurement of circulating proteins, which enter the bloodstream from inflamed tissues, also offers insight into global IFN activity. Using a novel protocol we generated 1,132 aptamer-based protein measurements from anti-dsDNApos SLE blood samples and derived an IFN protein signature (IFNPS) that approximates the IFN 21-gene signature (IFNGS). Of 82 patients with SLE, IFNPS was elevated for 89% of IFNGS-high patients (49/55) and 26% of IFNGS-low patients (7/27). IFNGS-high/IFNPS-high patients exhibited activated NK, CD4, and CD8 T cells, while IFNPS-high only patients did not. IFNPS correlated with global disease activity in lymphopenic and non-lymphopenic patients and decreased following type I IFN neutralisation with anifrolumab in the SLE phase IIb study, MUSE. In summary, we developed a protein signature that reflects IFNGS and identifies a new subset of patients with SLE who have IFN activity.


Conflict of interest statement

M.A.Sm. and W.A.R. were employees of AstraZeneca at the time that this analysis was conducted, hold stock/shares in AstraZeneca PLC, and are currently employees of Viela Bio. S.H. was supported by the NIH/NIAMS during the conduct of the study and supported [in part] by the Intramural Research Program of the National Institute of Arthritis and Musculoskeletal and Skin Diseases of the National Institutes of Health. C.C.C., K.Z., S.R., W.I.W., D.S., and K.S. are employees of AstraZeneca and hold stock/shares in AstraZeneca PLC. M.A.Sa. was an employee of AstraZeneca at the time that this analysis was conducted, holds stock/shares in AstraZeneca PLC, and is currently an employee of Bristol-Myers Squibb. M.J.K. was supported by the NIH/NIAMS during the conduct of the study. K.A.C. was an employee of AstraZeneca at the time that this analysis was conducted and is currently an employee of Bristol-Myers Squibb. R.S. reports intramural funding from National Institutes of Health (NIH) during the conduct of the study; and has been at Novartis Institutes of BioMedical Research since June 2018. A.S., L.G.R., F.W.M., and Z.M. have nothing to declare.

Figures

Figure 1
Figure 1
Boxplots displaying global signal distribution of 1,129 protein measurements generated using (a) the standard SomaLogic protocol and (b) mitigation protocol from serum samples collected from 143 patients with systemic lupus erythematosus (SLE) and 50 healthy donors (HD). The minimum, first quartile, median, third quartile, and maximum relative fluorescence units (RFU) per sample are indicated on each boxplot. Samples are arranged in ascending order based on anti–double-stranded DNA (anti-dsDNA) immunoglobulin G (IgG) RFU. Anti-dsDNA IgG prevalence for each sample is plotted in blue. (c,d) Sample-specific median scaling factors were used for plate median normalisation in SLE and HD samples. 38 samples from patients with SLE displayed 2.5-fold increased signal relative to their intra-assay control medians, resulting in failure of SOMAscan quality control (QC) standards using the standard SOMAscan protocol. After the samples were processed with the mitigation protocol, all samples passed quality control standards with median signal intensities ranging from a 0.8- to 1.7-fold difference relative to the median assay signal intensity.
Figure 2
Figure 2
(a) Venn diagram displaying selection of protein measurements used for feature selection in LASSO regression. 34 SomaLogic protein measurements displayed a Pearson correlation >0.3 versus the interferon gene signature (IFNGS) and were known to have gene expression inducible by type I interferon (IFN) in human cells. Based on the NIH training set (b) average Pearson correlation of IFN protein scores predicted through 10 iterations of 5-fold cross-validation with the IFNGS varying the number of features input into the LASSO regression model. Optimal value of λ was also chosen through 10 iterations of 5-fold cross-validation. Feature selection was restricted to proteins with positive independent associations to the IFNGS. Proteins were scaled to the HD mean and standard deviation prior to fitting the LASSO regression model. (c) Regression coefficients from IFN four-protein signature (IFNPS) refit to IFNGS with ordinary least squares regression. (d) Scatterplot displaying concordance between IFNPS and the IFNGS. r value calculated using Pearson correlation. SLE = systemic lupus erythematosus, HD = healthy donors.
Figure 3
Figure 3
(a) Density plots displaying values of interferon gene signature (IFNGS) in systemic lupus erythematosus (SLE; magenta) and healthy donors (HD; grey), and four-protein IFN signature (IFNPS) in HD (grey) and patients with SLE (magenta). (b) Values of IFNGS in HD (grey) and patients with SLE with low (blue) and high (magenta) values of IFNGS (cutoff of 2), and IFNPS values in HD (grey) and patients with SLE with low (blue) and high (magenta) IFNGS. Statistical comparisons between each group of patients with SLE and HD were reported with the area under the curve (AUC) and p-value reported from the Mann-Whitney U test.
Figure 4
Figure 4
Line plots displaying relationship between cell counts and lymphocyte counts. Line represents best fit from local regression with degree 2 and span 0.75. Shaded region represents a 95% confidence interval of the mean. DC = dendritic cells, NK = natural killer cells.
Figure 5
Figure 5
(a) Heatmap displaying associations of cell populations with interferon gene signature (IFNGS) and interferon protein signature (IFNPS) in 3-way ANOVA (p < 0.05). (b,c) Boxplots displaying elevation of Ki-67+ NK cells and PD-1+ Tcm CD4 T cells in IFNGS-high patients with systemic lupus erythematosus (SLE) versus IFNPS-high/IFNGS-low patients with SLE. AUC = area under the curve, HD = healthy donors, SD = standard deviation, WB = whole blood. NK = natural killer cells, Tcm = central memory T cells, Tem = effector memory cell.
Figure 6
Figure 6
(a) Boxplots displaying correlation between interferon gene signature (IFNGS) and interferon protein signature (IFNPS) with systemic lupus erythematosus (SLE) disease activity. (b) Area under the curve (AUC) of IFNGS and IFNPS in discriminating patients with SLE positive or negative for specific SLE Disease Activity Index (SLEDAI) components in the NIH lupus cohort. Threshold for leukopenia: <3,000 WBC/µl. (c) Scatterplots displaying correlation between IFNPS and SLEDAI in non-lymphopenic patients with SLE and lymphopenic patients with SLE. P-values reported using Mann-Whitney U test (***p < 0.001, **p < 0.01, *p < 0.05, ▪p < 0.10). HD = healthy donors.
Figure 7
Figure 7
(a) Interferon protein signature (IFNPS) over time in patients who received placebo or anifrolumab 300 mg in the MUSE study. Box and whiskers represent patient quartiles. (b) Mean change from baseline in interferon protein signature over time. Error bars represent standard error of the mean (SEM). *p < 0.05 by Mann-Whitney U test. HD = healthy donors, n.s. = not significant.

References

    1. Lau GK, et al. Peginterferon alfa-2a, lamivudine, and the combination for HBeAg-positive chronic hepatitis B. N. Engl. J. Med. 2005;352:2682–2695. doi: 10.1056/NEJMoa043470. - DOI - PubMed
    1. Fried MW, et al. Peginterferon alfa-2a plus ribavirin for chronic hepatitis C virus infection. N. Engl. J. Med. 2002;347:975–982. doi: 10.1056/NEJMoa020047. - DOI - PubMed
    1. Golomb HM, et al. Alpha-2 interferon therapy of hairy-cell leukemia: a multicenter study of 64 patients. J. Clin. Oncol. 1986;4:900–905. doi: 10.1200/JCO.1986.4.6.900. - DOI - PubMed
    1. Italian Cooperative Study Group on Chronic Myeloid Leukemia et al. Interferon alfa-2a as compared with conventional chemotherapy for the treatment of chronic myeloid leukemia. N. Engl. J. Med. 1994;330:820–825. doi: 10.1056/NEJM199403243301204. - DOI - PubMed
    1. Higgs BW, et al. A phase 1b clinical trial evaluating sifalimumab, an anti-IFN-alpha monoclonal antibody, shows target neutralisation of a type I IFN signature in blood of dermatomyositis and polymyositis patients. Ann. Rheum. Dis. 2014;73:256–262. doi: 10.1136/annrheumdis-2012-202794. - DOI - PMC - PubMed

Publication types

MeSH terms