

Altered directed functional connectivity of the right amygdala in depression: high-density EEG study
- PMID: 32157152
- PMCID: PMC7064485
- DOI: 10.1038/s41598-020-61264-z
Altered directed functional connectivity of the right amygdala in depression: high-density EEG study
Abstract
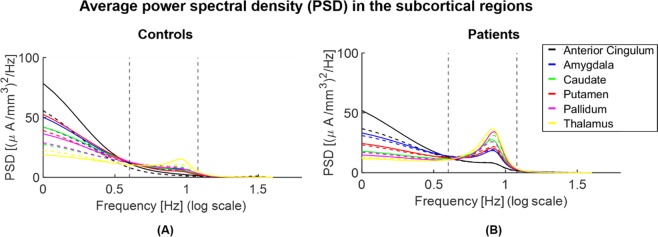
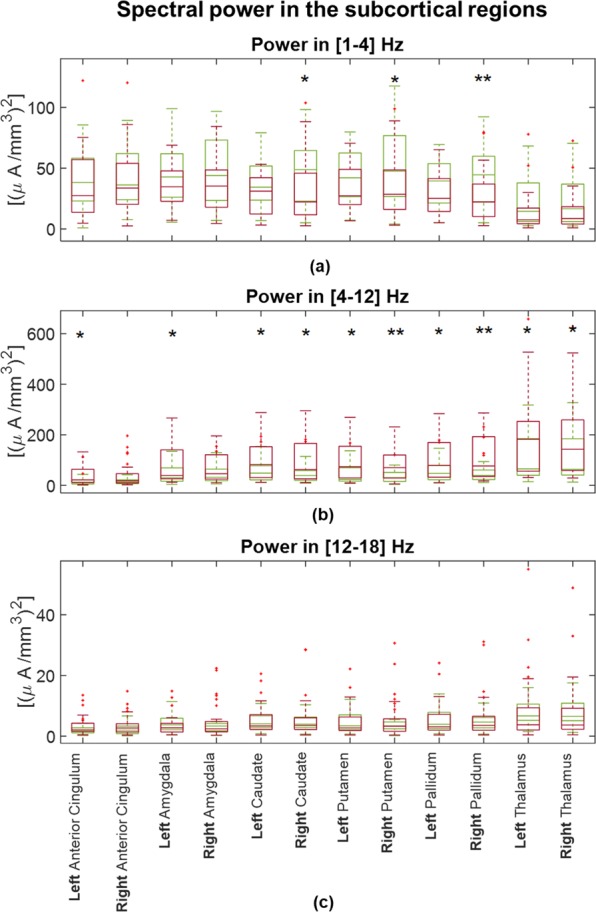
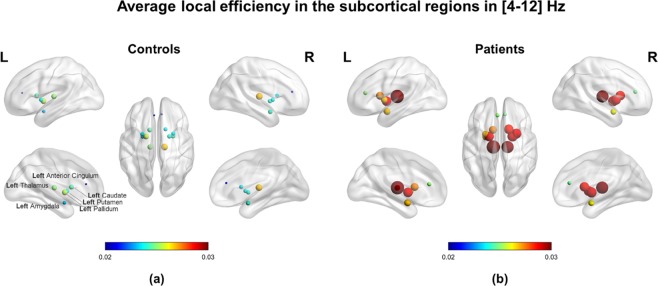
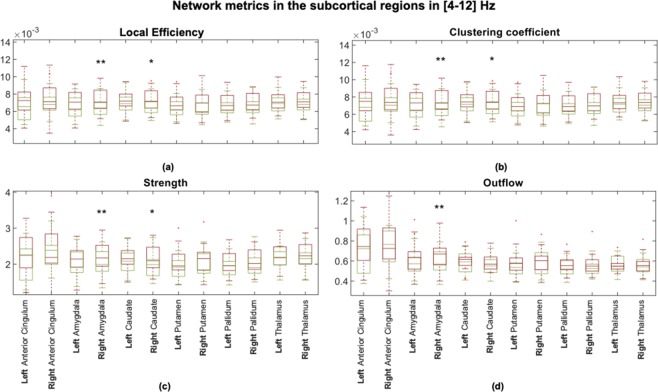
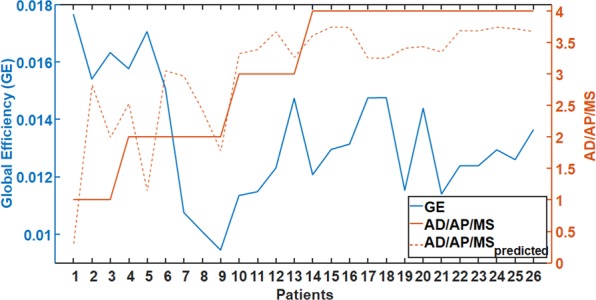
The cortico-striatal-pallidal-thalamic and limbic circuits are suggested to play a crucial role in the pathophysiology of depression. Stimulation of deep brain targets might improve symptoms in treatment-resistant depression. However, a better understanding of connectivity properties of deep brain structures potentially implicated in deep brain stimulation (DBS) treatment is needed. Using high-density EEG, we explored the directed functional connectivity at rest in 25 healthy subjects and 26 patients with moderate to severe depression within the bipolar affective disorder, depressive episode, and recurrent depressive disorder. We computed the Partial Directed Coherence on the source EEG signals focusing on the amygdala, anterior cingulate, putamen, pallidum, caudate, and thalamus. The global efficiency for the whole brain and the local efficiency, clustering coefficient, outflow, and strength for the selected structures were calculated. In the right amygdala, all the network metrics were significantly higher (p < 0.001) in patients than in controls. The global efficiency was significantly higher (p < 0.05) in patients than in controls, showed no correlation with status of depression, but decreased with increasing medication intake ([Formula: see text]). The amygdala seems to play an important role in neurobiology of depression. Practical treatment studies would be necessary to assess the amygdala as a potential future DBS target for treating depression.
Conflict of interest statement
The authors declare no competing interests.
Figures
Similar articles
-
Abnormal functional connectivity of the amygdala is associated with depression in Parkinson's disease.Mov Disord. 2015 Feb;30(2):238-44. doi: 10.1002/mds.26087. Epub 2014 Dec 27. Mov Disord. 2015. PMID: 25545969
-
Altered Functional Connectivity of Amygdala with the Fronto-Limbic-Striatal Circuit in Temporal Lobe Lesion as a Proposed Mechanism for Poststroke Depression.Am J Phys Med Rehabil. 2019 Apr;98(4):303-310. doi: 10.1097/PHM.0000000000001081. Am J Phys Med Rehabil. 2019. PMID: 30394890
-
Inflammation negatively correlates with amygdala-ventromedial prefrontal functional connectivity in association with anxiety in patients with depression: Preliminary results.Brain Behav Immun. 2018 Oct;73:725-730. doi: 10.1016/j.bbi.2018.07.026. Epub 2018 Aug 1. Brain Behav Immun. 2018. PMID: 30076980 Free PMC article.
-
Amygdala Atrophy and Its Functional Disconnection with the Cortico-Striatal-Pallidal-Thalamic Circuit in Major Depressive Disorder in Females.PLoS One. 2017 Jan 20;12(1):e0168239. doi: 10.1371/journal.pone.0168239. eCollection 2017. PLoS One. 2017. PMID: 28107446 Free PMC article.
-
Amygdala connectivity mediates the association between anxiety and depression in patients with major depressive disorder.Brain Imaging Behav. 2019 Aug;13(4):1146-1159. doi: 10.1007/s11682-018-9923-z. Brain Imaging Behav. 2019. PMID: 30054873
Cited by
-
Emotion brain network topology in healthy subjects following passive listening to different auditory stimuli.PeerJ. 2024 Jul 19;12:e17721. doi: 10.7717/peerj.17721. eCollection 2024. PeerJ. 2024. PMID: 39040935 Free PMC article.
-
Experimental Protocol to Assess Neuromuscular Plasticity Induced by an Exoskeleton Training Session.Methods Protoc. 2021 Jul 13;4(3):48. doi: 10.3390/mps4030048. Methods Protoc. 2021. PMID: 34287357 Free PMC article.
-
Association of Midlife Depressive Symptoms with Regional Amyloid-β and Tau in the Framingham Heart Study.J Alzheimers Dis. 2021;82(1):249-260. doi: 10.3233/JAD-210232. J Alzheimers Dis. 2021. PMID: 34024836 Free PMC article.
-
Prefrontal network engagement by deep brain stimulation in limbic hubs.Front Hum Neurosci. 2024 Jan 12;17:1291315. doi: 10.3389/fnhum.2023.1291315. eCollection 2023. Front Hum Neurosci. 2024. PMID: 38283094 Free PMC article.
-
Cortical correlates in upright dynamic and static balance in the elderly.Sci Rep. 2021 Jul 8;11(1):14132. doi: 10.1038/s41598-021-93556-3. Sci Rep. 2021. PMID: 34238987 Free PMC article.
References
Publication types
MeSH terms
LinkOut - more resources
Full Text Sources
Medical
