

Machine learning for characterizing risk of type 2 diabetes mellitus in a rural Chinese population: the Henan Rural Cohort Study
- PMID: 32157171
- PMCID: PMC7064542
- DOI: 10.1038/s41598-020-61123-x
Machine learning for characterizing risk of type 2 diabetes mellitus in a rural Chinese population: the Henan Rural Cohort Study
Abstract
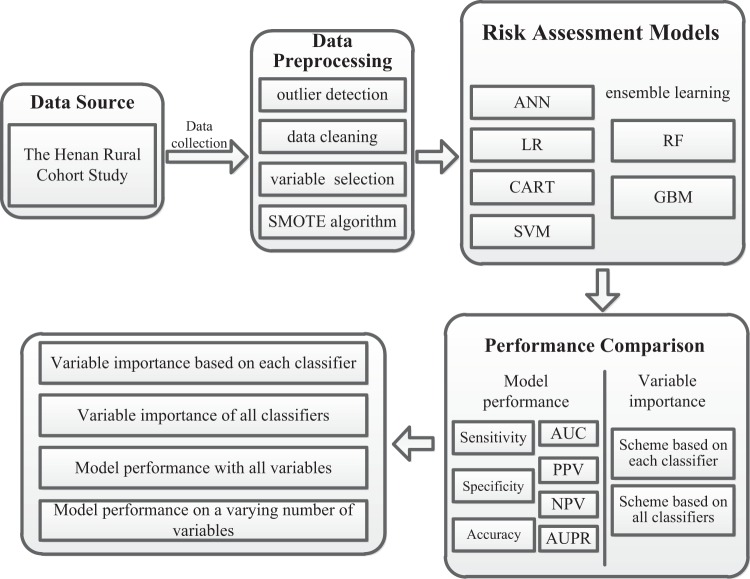
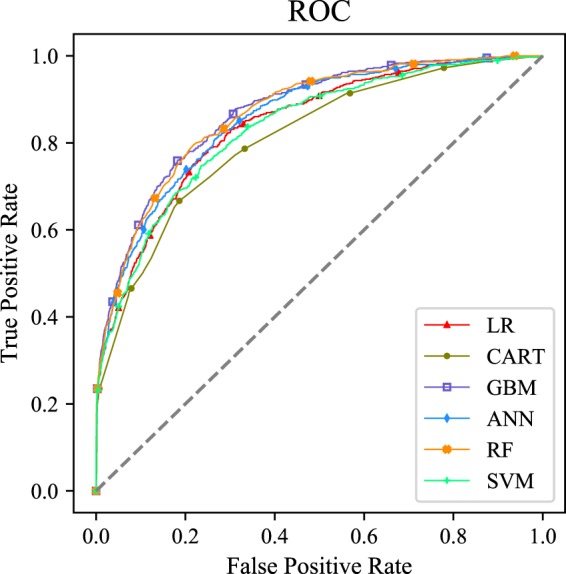
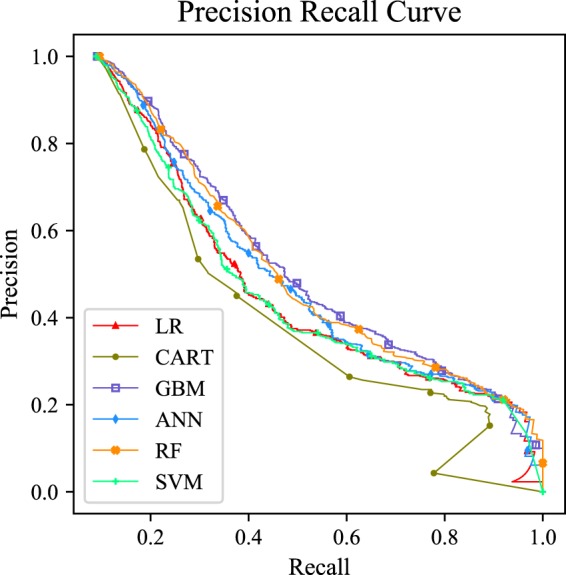
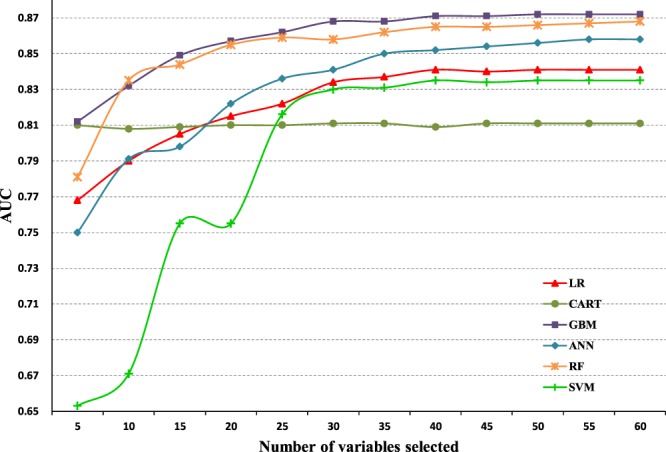
With the development of data mining, machine learning offers opportunities to improve discrimination by analyzing complex interactions among massive variables. To test the ability of machine learning algorithms for predicting risk of type 2 diabetes mellitus (T2DM) in a rural Chinese population, we focus on a total of 36,652 eligible participants from the Henan Rural Cohort Study. Risk assessment models for T2DM were developed using six machine learning algorithms, including logistic regression (LR), classification and regression tree (CART), artificial neural networks (ANN), support vector machine (SVM), random forest (RF) and gradient boosting machine (GBM). The model performance was measured in an area under the receiver operating characteristic curve, sensitivity, specificity, positive predictive value, negative predictive value and area under precision recall curve. The importance of variables was identified based on each classifier and the shapley additive explanations approach. Using all available variables, all models for predicting risk of T2DM demonstrated strong predictive performance, with AUCs ranging between 0.811 and 0.872 using laboratory data and from 0.767 to 0.817 without laboratory data. Among them, the GBM model performed best (AUC: 0.872 with laboratory data and 0.817 without laboratory data). Performance of models plateaued when introduced 30 variables to each model except CART model. Among the top-10 variables across all methods were sweet flavor, urine glucose, age, heart rate, creatinine, waist circumference, uric acid, pulse pressure, insulin, and hypertension. New important risk factors (urinary indicators, sweet flavor) were not found in previous risk prediction methods, but determined by machine learning in our study. Through the results, machine learning methods showed competence in predicting risk of T2DM, leading to greater insights on disease risk factors with no priori assumption of causality.
Conflict of interest statement
The authors declare no competing interests.
Figures
Similar articles
-
[Establishing a noninvasive prediction model for type 2 diabetes mellitus based on a rural Chinese population].Zhonghua Yu Fang Yi Xue Za Zhi. 2016 May;50(5):397-403. doi: 10.3760/cma.j.issn.0253-9624.2016.05.003. Zhonghua Yu Fang Yi Xue Za Zhi. 2016. PMID: 27141894 Clinical Trial. Chinese.
-
Genetic Risk Score Increased Discriminant Efficiency of Predictive Models for Type 2 Diabetes Mellitus Using Machine Learning: Cohort Study.Front Public Health. 2021 Feb 17;9:606711. doi: 10.3389/fpubh.2021.606711. eCollection 2021. Front Public Health. 2021. PMID: 33681127 Free PMC article.
-
Comparing the accuracy of four machine learning models in predicting type 2 diabetes onset within the Chinese population: a retrospective study.J Int Med Res. 2024 Jun;52(6):3000605241253786. doi: 10.1177/03000605241253786. J Int Med Res. 2024. PMID: 38870271 Free PMC article.
-
Evaluation of Machine Learning Methods Developed for Prediction of Diabetes Complications: A Systematic Review.J Diabetes Sci Technol. 2023 Mar;17(2):474-489. doi: 10.1177/19322968211056917. Epub 2021 Nov 3. J Diabetes Sci Technol. 2023. PMID: 34727783 Free PMC article.
-
The Use of Machine Learning for the Care of Hypertension and Heart Failure.JACC Asia. 2021 Sep 21;1(2):162-172. doi: 10.1016/j.jacasi.2021.07.005. eCollection 2021 Sep. JACC Asia. 2021. PMID: 36338169 Free PMC article. Review.
Cited by
-
Machine learning and deep learning predictive models for type 2 diabetes: a systematic review.Diabetol Metab Syndr. 2021 Dec 20;13(1):148. doi: 10.1186/s13098-021-00767-9. Diabetol Metab Syndr. 2021. PMID: 34930452 Free PMC article. Review.
-
Development and validation of machine learning-augmented algorithm for insulin sensitivity assessment in the community and primary care settings: a population-based study in China.Front Endocrinol (Lausanne). 2024 Jan 25;15:1292346. doi: 10.3389/fendo.2024.1292346. eCollection 2024. Front Endocrinol (Lausanne). 2024. PMID: 38332892 Free PMC article.
-
Predicting the Risk of Incident Type 2 Diabetes Mellitus in Chinese Elderly Using Machine Learning Techniques.J Pers Med. 2022 May 31;12(6):905. doi: 10.3390/jpm12060905. J Pers Med. 2022. PMID: 35743691 Free PMC article.
-
Simplified Decision-Tree Algorithm to Predict Falls for Community-Dwelling Older Adults.J Clin Med. 2021 Nov 5;10(21):5184. doi: 10.3390/jcm10215184. J Clin Med. 2021. PMID: 34768703 Free PMC article.
-
Developing a hypertension visualization risk prediction system utilizing machine learning and health check-up data.Sci Rep. 2023 Nov 2;13(1):18953. doi: 10.1038/s41598-023-46281-y. Sci Rep. 2023. PMID: 37919314 Free PMC article.
References
-
- International Diabetes Federation. IDF diabetes atlas. 8th. http://www.diabetesatlas.org/ (2017).
Publication types
MeSH terms
LinkOut - more resources
Full Text Sources
Other Literature Sources
Medical
