. 2020 Mar 10;10(1):4425.
doi: 10.1038/s41598-020-61420-5.

Eosinophil accumulation in postnatal lung is specific to the primary septation phase of development

Affiliations

Eosinophil accumulation in postnatal lung is specific to the primary septation phase of development

Lucas F Loffredo et al. Sci Rep. .

Abstract

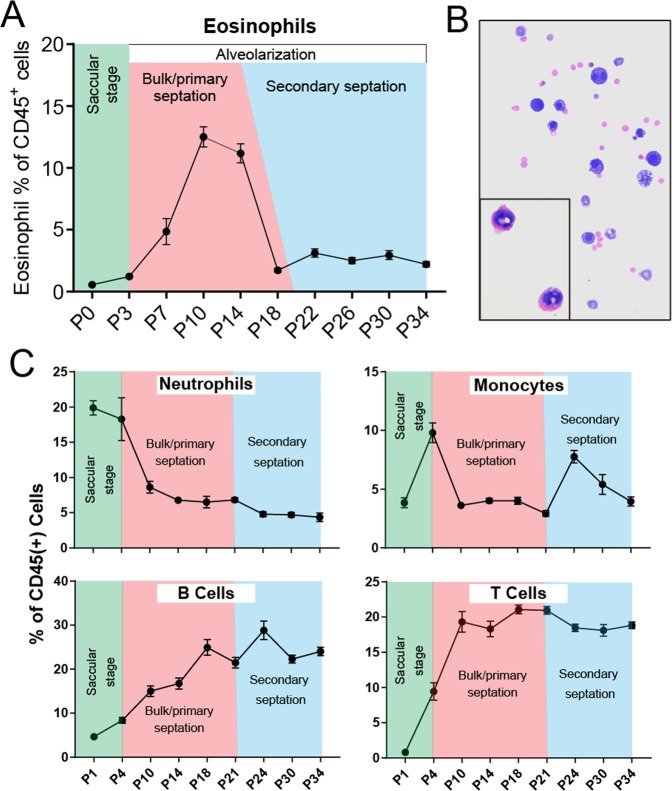
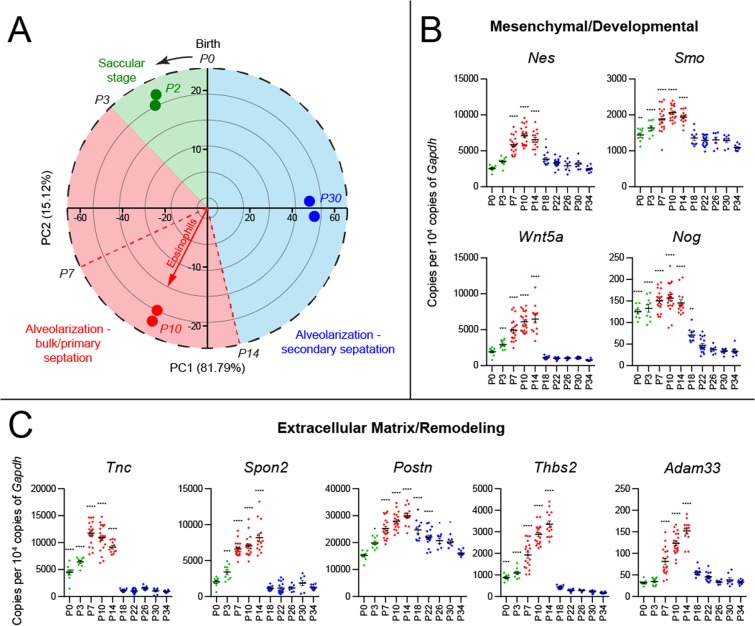
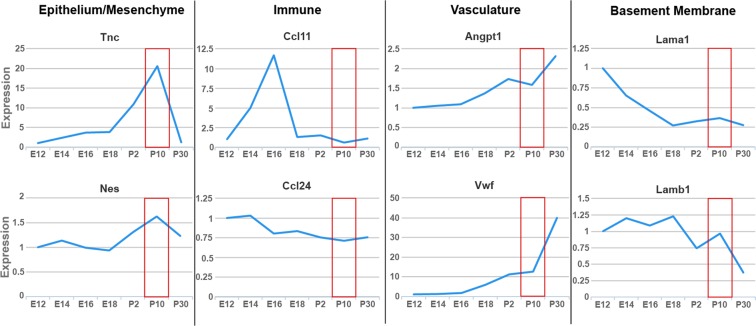
Type 2 immune cells and eosinophils are transiently present in the lung tissue not only in pathology (allergic disease, parasite expulsion) but also during normal postnatal development. However, the lung developmental processes underlying airway recruitment of eosinophils after birth remain unexplored. We determined that in mice, mature eosinophils are transiently recruited to the lung during postnatal days 3-14, which specifically corresponds to the primary septation/alveolarization phase of lung development. Developmental eosinophils peaked during P10-14 and exhibited Siglec-Fmed/highCD11c-/low phenotypes, similar to allergic asthma models. By interrogating the lung transcriptome and proteome during peak eosinophil recruitment in postnatal development, we identified markers that functionally capture the establishment of the mesenchymal-epithelial interface (Nes, Smo, Wnt5a, Nog) and the deposition of the provisional extracellular matrix (ECM) (Tnc, Postn, Spon2, Thbs2) as a key lung morphogenetic event associating with eosinophils. Tenascin-C (TNC) was identified as one of the key ECM markers in the lung epithelial-mesenchymal interface both at the RNA and protein levels, consistently associating with eosinophils in development and disease in mice and humans. As determined by RNA-seq analysis, naïve murine eosinophils cultured with ECM enriched in TNC significantly induced expression of Siglec-F, CD11c, eosinophil peroxidase, and other markers typical for activated eosinophils in development and allergic inflammatory responses. TNC knockout mice had an altered eosinophil recruitment profile in development. Collectively, our results indicate that lung morphogenetic processes associated with heightened Type 2 immunity are not merely a tissue "background" but specifically guide immune cells both in development and pathology.


Conflict of interest statement

The authors declare no competing interests.

Figures

Figure 1
Figure 1
Transient recruitment of eosinophils to the murine lung during normal postnatal development. (A) Kinetics of lung eosinophil recruitment during normal postnatal development. The peak of eosinophil recruitment coincides with bulk/primary septation during the alveolarization phase of lung development. N = 4–8 mice/group, combined by different litters. Eosinophils are quantified as a percentage of all CD45+ hematopoietic cells. (B) Cytospin preparation of bronchoalveolar lavage from normal murine lungs during day 10 of postnatal development. Zoom-in box shows developmental eosinophil biology. (C) Kinetics of lung immune cell recruitment during normal postnatal development. The peak of non-eosinophil immune cell recruitment does not coincide with eosinophil recruitment in the bulk/primary septation phase. N = 4–8 mice/group, combined by different litters.
Figure 2
Figure 2
Lung tissue gene expression and proteome profiles corresponding to the kinetics of eosinophil recruitment during normal lung postnatal development. (A) Principal component analysis of changes in the lung tissue transcriptome over the course of postnatal lung development (postnatal days 0 to 34). On this “developmental clock”, eosinophils peak at postnatal day 10, which represents the alveolarization and bulk/primary septation stage of lung development. (B) Expression of mesenchymal and developmental pathway genes during postnatal development. (C) Expression of extracellular matrix and tissue remodeling genes during postnatal development. Green: saccular stage of lung development. Red: alveolarization (bulk/primary septation). Blue: alveolarization (secondary septation). ****p < 0.0001, one-way ANOVA with Dunnett’s multiple comparisons test.
Figure 3
Figure 3
Peak recruitment of eosinophils to the lung specifically aligns with peak expression of provisional matrix and mesenchymal genes rather than genes representing immune and vascular compartments. Only mesenchymal and provisional matrix genes (exemplified here by Tnc and Nes) peak in expression during alveolarization, the phase denoted by the red box. Other proteins related to eosinophils or lung development do not peak during this time (LungGens data mining).
Figure 4
Figure 4
Tenascin-C is robustly expressed in lung development and mouse models of asthma. (A) Gene expression of TNC in three different strains of mice over the course of murine prenatal and postnatal development (LungMAP data mining). (B) Protein levels of TNC during murine postnatal development (LungMAP data mining). (C) Human lung expression of TNC in epithelial and mesenchymal cells (LungMAP human lung next generation sequencing). (D) Detection of eosinophils by flow cytometry and lung tissue expression of TNC in a mouse model of asthma. *p < 0.05, ****p < 0.0001, unpaired T-test. (E) Eosinophil recruitment during normal postnatal development in wild-type mice (red) compared to TNC−/− mice (blue). N = 4–8 mice/group, combined by different litters. Eosinophils are quantified as a percentage of all CD45+ hematopoietic cells. *p < 0.05, unpaired T-test.
Figure 5
Figure 5
RNA-seq analysis of gene expression profiles commonly represented in eosinophils interacting with homeostatic vs. provisional extracellular matrix environments. (A) Venn diagram showing numbers of differentially expressed genes in naïve eosinophils stimulated with matrigels vs. matrigels enriched with tenascin C. Tenascin C treated matrigels triggered a significantly larger response from naïve eosinophils. (B) Correlation between gene expression profiles induced by ECM vs. ECM/TNC treatment. Blue: genes uniquely upregulated by “homeostatic” ECM. Green: genes uniquely overexpressed by TNC. Purple: the 647 genes commonly expressed by both treatments (overlap shown in part A). (C) Biological processes represented by differential gene expression signatures identified in RNA-Seq analysis. Similar biological responses were triggered in eosinophils by both treatments, although overrepresented by a higher number of genes in the ECM/TNC treatment group. Regulation of metabolism, vesicle transport, and cellular structure organization were mostly overrepresented in ECM/TNC gene signatures. N = 4/group, 2 experimental repeats, padj < 0.05, Benjamini-Hochberg moderated t-test.
Figure 6
Figure 6
Comparison of gene signatures of bone marrow-derived eosinophils activated by interaction with the extracellular matrix in vitro against genes differentially expressed by lung eosinophils during allergic inflammation in vivo. (A) Flow cytometry showing eosinophil populations in representative lung tissue homogenates and bronchoalveolar lavage from normal adult mouse lungs, lungs of mice subjected to allergen challenge in an ovalbumin model of asthma, and normal mouse lungs harvested at day 10 during postnatal development (left to right). Representative samples are shown. (B) Venn diagrams, black circles: matrix-induced differentially expressed gene signatures from Fig. 6. Venn diagrams, colored circles: differential gene expression (relative to the gene expression of resident “naïve” lung tissue eosinophils) of total eosinophil population (left, red, secondary microarray analysis) or Siglec-FhighCD11c+ eosinophils (right, blue, in-house RNA-Seq analysis of tissue-isolated eosinophils) sorted from murine lung tissue during allergic inflammation (3 challenge ovalbumin model of asthma). Mouse images within circles were created with BioRender.com under the academic license. Flow cytometry charts show the gating strategy for the sorting of corresponding eosinophil populations from lung tissue. Colored arrows and text boxes demonstrate the degree of overlap between ECM- and inflamed lung tissue-induced eosinophil gene activation signatures. Black text box in the middle lists several key representative genes shared by eosinophils in all comparisons.
Figure 7
Figure 7
Lung tissue gene expression differences between eosinophil-deficient and control mice. WT: wild-type mice. PHIL: mouse strain with constitutive eosinophil deficiency. *p < 0.05; **p < 0.01; n.s., not significant, unpaired t-test.

References

    1. Abdala-Valencia H, Loffredo LF, Misharin AV, Berdnikovs S. Phenotypic plasticity and targeting of Siglec-F(high) CD11c(low) eosinophils to the airway in a murine model of asthma. Allergy. 2016;71:267–271. doi: 10.1111/all.12776. - DOI - PubMed
    1. Mesnil C, et al. Lung-resident eosinophils represent a distinct regulatory eosinophil subset. J. Clin. Invest. 2016;126:3279–3295. doi: 10.1172/JCI85664. - DOI - PMC - PubMed
    1. Percopo CM, et al. SiglecF+Gr1hi eosinophils are a distinct subpopulation within the lungs of allergen-challenged mice. J. Leukoc. Biol. 2017;101:321–328. doi: 10.1189/jlb.3A0416-166R. - DOI - PMC - PubMed
    1. Rosenberg HF, Dyer KD, Foster PS. Eosinophils: changing perspectives in health and disease. Nat. Rev. Immunol. 2013;13:9–22. doi: 10.1038/nri3341. - DOI - PMC - PubMed
    1. Lee JJ, Jacobsen EA, McGarry MP, Schleimer RP, Lee NA. Eosinophils in health and disease: the LIAR hypothesis. Clin. Exp. Allergy. 2010;40:563–575. doi: 10.1111/j.1365-2222.2010.03484.x. - DOI - PMC - PubMed

Publication types