. 2020 Mar 10;10(1):4443.
doi: 10.1038/s41598-020-61333-3.

Sources of variation in the 3dMDface and Vectra H1 3D facial imaging systems

Affiliations

Sources of variation in the 3dMDface and Vectra H1 3D facial imaging systems

Julie D White et al. Sci Rep. .

Abstract

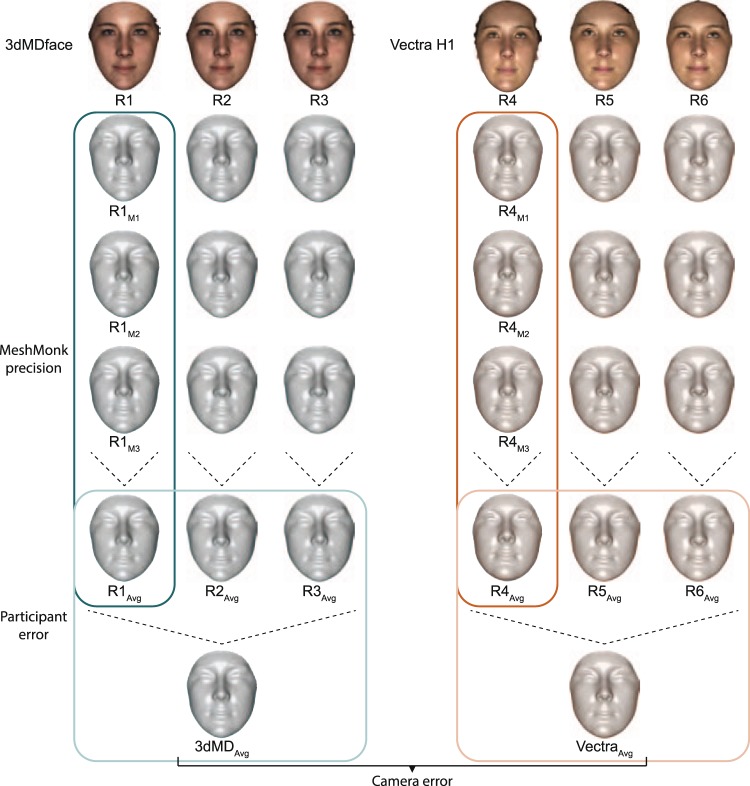
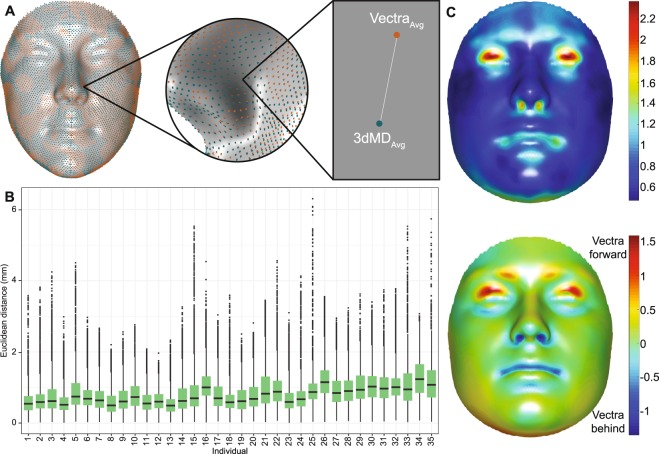
As technology advances and collaborations grow, our ability to finely quantify and explore morphological variation in 3D structures can enable important discoveries and insights into clinical, evolutionary, and genetic questions. However, it is critical to explore and understand the relative contribution of potential sources of error to the structures under study. In this study, we isolated the level of error in 3D facial images attributable to four sources, using the 3dMDface and Vectra H1 camera systems. When the two camera systems are used separately to image human participants, this analysis finds an upper bound of error potentially introduced by the use of the 3dMDface or Vectra H1 camera systems, in conjunction with the MeshMonk registration toolbox, at 0.44 mm and 0.40 mm, respectively. For studies using both camera systems, this upper bound increases to 0.85 mm, on average, and there are systematic differences in the representation of the eyelids, nostrils, and mouth by the two camera systems. Our results highlight the need for careful assessment of potential sources of error in 3D images, both in terms of magnitude and position, especially when dealing with very small measurements or performing many tests.


Conflict of interest statement

The authors declare no competing interests.

Figures

Figure 1
Figure 1
Study design. Three images of each participant were taken with the 3dMDface (left) and the Vectra H1 (right), for a total of 6 image replicates per participant. Each image was then registered three times with MeshMonk, resulting in a total of 18 quasi-landmark configurations per individual. Comparisons of each set of registrations to the average of all three registration iterations (column-wise) led to estimates of MeshMonk precision. Within-camera comparisons of the three average registrations to the overall average for that camera gave estimates of participant error per camera as well as technical error per camera, when analyzing the mannequin images. Lastly, the average quasi-landmark configuration from each camera was compared to create estimates of error due to imaging system. Individual imaged is one of the authors.
Figure 2
Figure 2
MeshMonk precision for participants. (A) For each replicate image of each individual, precision was calculated by first averaging together the three registration iterations (e.g. R1Avg), then calculating the distance from each iteration (e.g. R1M1, R1M2, R1M3) to the average. Replicate “1” is used as the example in this figure. The three distances were then averaged and this process was repeated across all 7,160 quasi-landmarks. (B) Precision (mm) for the 3dMDface images, averaged across all replicate images of all participants (n = 105). (C) Precision (mm) for the Vectra H1 images, averaged across all replicate images of all participants (n = 105). Scale bar in mm applicable to both images. (D) Precision per image, stratified by camera.
Figure 3
Figure 3
Participant error. (A) To calculate the error from participant movement between images, the three registration iterations for each replicate image were averaged (e.g. R1Avg, R2Avg, R3Avg) and aligned using a non-scaled, non-reflected GPA. The average quasi-landmark configuration for each person on the camera was calculated by averaging together the three replicate images (e.g. 3dMDAvg). The participant error was estimated by calculating the distance from each replicate image to the average quasi-landmark configuration. The three distances were then averaged and this process was repeated across all 7,160 quasi-landmarks. (B) Participant error (mm) for the 3dMDface images, averaged across all participants (n = 35). (C) Participant error (mm) for the Vectra H1 images, averaged across all participants (n = 35). Scale bar in mm applicable to both images. (D) Participant error plotted per camera. Each point represents the average across all quasi-landmarks for one individual, with the grey lines connecting that individual’s 3dMDface and Vectra H1 values.
Figure 4
Figure 4
Camera error for participants. (A) To calculate the camera error for each person, all quasi-landmark configurations for each camera were averaged (3dMDAvg and VectraAvg) and aligned using a non-scaled, non-reflected GPA. The camera error was estimated by calculating the distance between the average 3dMDface configuration and the average Vectra H1 configuration. This process was repeated across all 7,160 quasi-landmarks. (B) Boxplots of camera error for all participants. (C) Top: Distribution of camera error across the face, calculated by averaging the Euclidean distance values (mm) per quasi-landmark over the 35 participants. Bottom: Distribution of displacement along the normal vectors across the face, going from the 3dMDface image to the Vectra H1 image, after GPA alignment. Red values are those where the direction of the vector is positive, indicating that the Vectra H1 image is more outwardly displaced relative to the 3dMDface image. Blue values are those where the direction of the vector is negative, indicating that the Vectra H1 image is inwardly displaced or recessed relative to the 3dMDface image. Values have been averaged across all 35 participants and are unit-less.

References

    1. Starbuck JM, Cole TM, III., Reeves RH, Richtsmeier JT. The Influence of trisomy 21 on facial form and variability. Am. J. Med. Genet. A. 2017;173:2861–2872. doi: 10.1002/ajmg.a.38464. - DOI - PMC - PubMed
    1. Choi JW, et al. Frontal soft tissue analysis using a 3 dimensional camera following two-jaw rotational orthognathic surgery in skeletal class III patients. J. Cranio-Maxillofac. Surg. 2014;42:220–226. doi: 10.1016/j.jcms.2013.05.004. - DOI - PubMed
    1. Bastir M, Rosas A. Cranial base topology and basic trends in the facial evolution of Homo. J. Hum. Evol. 2016;91:26–35. doi: 10.1016/j.jhevol.2015.11.001. - DOI - PubMed
    1. Schroeder L, et al. Skull diversity in the Homo lineage and the relative position of Homo naledi. J. Hum. Evol. 2017;104:124–135. doi: 10.1016/j.jhevol.2016.09.014. - DOI - PubMed
    1. Hammond P, et al. The Face Signature of Fibrodysplasia Ossificans Progressiva. Am. J. Med. Genet. 2013;158A:1368–1380. doi: 10.1002/ajmg.a.35346. - DOI - PMC - PubMed

Publication types

MeSH terms