. 2020 Apr;39(18):3738-3753.
doi: 10.1038/s41388-020-1248-x. Epub 2020 Mar 10.

ADAR1-mediated RNA editing is a novel oncogenic process in thyroid cancer and regulates miR-200 activity

Affiliations

ADAR1-mediated RNA editing is a novel oncogenic process in thyroid cancer and regulates miR-200 activity

Julia Ramírez-Moya et al. Oncogene. 2020 Apr.

Abstract

Adenosine deaminases acting on RNA (ADARs) convert adenosine to inosine in double-stranded RNA. A-to-I editing of RNA is a widespread posttranscriptional process that has recently emerged as an important mechanism in cancer biology. A-to-I editing levels are high in several human cancers, including thyroid cancer, but ADAR1 editase-dependent mechanisms governing thyroid cancer progression are unexplored. To address the importance of RNA A-to-I editing in thyroid cancer, we examined the role of ADAR1. Loss-of-function analysis showed that ADAR1 suppression profoundly repressed proliferation, invasion, and migration in thyroid tumor cell models. These observations were validated in an in vivo xenograft model, which showed that ADAR1-silenced cells had a diminished ability to form tumors. RNA editing of miRNAs has the potential to markedly alter target recognition. According to TCGA data, the tumor suppressor miR-200b is overedited in thyroid tumors, and its levels of editing correlate with a worse progression-free survival and disease stage. We confirmed miR-200b overediting in thyroid tumors and we showed that edited miR-200b has weakened activity against its target gene ZEB1 in thyroid cancer cells, likely explaining the reduced aggressiveness of ADAR1-silenced cells. We also found that RAS, but not BRAF, modulates ADAR1 levels, an effect mediated predominantly by PI3K and in part by MAPK. Lastly, pharmacological inhibition of ADAR1 activity with the editing inhibitor 8-azaadenosine reduced cancer cell aggressiveness. Overall, our data implicate ADAR1-mediated A-to-I editing as an important pathway in thyroid cancer progression, and highlight RNA editing as a potential therapeutic target in thyroid cancer.


Conflict of interest statement

The authors declare that they have no conflict of interest.

Figures
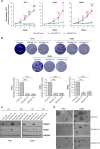
Fig. 1
Fig. 1. ADAR1 knockdown reduces thyroid cancer cells proliferation and 3D growth. TPC1, Cal62, and 8505c cell lines were transfected with two different siRNAs against ADAR1 (siADAR1 #1 and siADAR1 #2) or a control siRNA (siControl).
a MTT assay at the indicated time points. b Upper panel: representative images of crystal violet-stained colonies. Bottom panel: quantification of crystal violet absorbance. c Immunoblot of ADAR1 and proliferating cell nuclear antigen (PCNA) at 72 and 96 h after transfection. GAPDH was used as a loading control. d 3D cell culture. Values represent mean ± SD (n = 3). Asterisks represents significant difference between siADAR1 #1 and siControl, and Hash represents significant difference between siADAR #2 the siControl. */#p < 0.05; **/##p < 0.01; ***/###p < 0.001.
Fig. 2
Fig. 2. ADAR1 knockdown reduces thyroid cells invasion, migration in vitro and xenograft tumor growth in vivo.
TPC1, Cal62, and 8505c cell lines were transfected with two different siRNAs against ADAR1 (siADAR1 #1 and siADAR1 #2) or a control siRNA (siControl). a Quantification of cell invasion. Upper panel: representative images of the lower chamber (invading cells). Bottom panel: cell invasion relative to siControl cells. b Quantification from a wound-healing assay at the indicated time points after scratching. c, d Xenograft tumors were generated by subcutaneous injection with Cal62-Luc cells transfected previously with siControl (n = 8), siADAR1 #1 (n = 7), or siADAR1 #2 (n = 7). c Endpoint (day 18) bioluminescent signal of the generated tumors. d Tumor radiance quantification at the indicated time points. Values represent mean ± SD (n = 3). ***p < 0.001 for the in vitro techniques (A and B), and mean ± SEM. */#p < 0.05; **/##p < 0.01 for the in vivo experiment (d).
Fig. 3
Fig. 3. The ADAR1-dependent editing in miR-200b, increased in thyroid cancer patients, decreasing its binding to ZEB1 3′UTR.
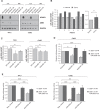
a Immunoblot for ADAR1 and ZEB1 72 and 92 h after TPC1 and Cal62 siControl, siADAR1 #1 or siADAR1 #2 transfection. GAPDH was used as a loading control. b Left: relative miR-200b edited (Edit)/wild-type (WT) miRNA levels in six PTC patients (contralateral and normal thyroid tissue). Right: total average of miR-200b Edit/WT miRNA relative levels. c miR-200b Edit/WT miRNA relative levels in TPC1 and Cal62 cells transfected with the siRNAs siControl, siADAR1 #1 or siADAR1 #2. d Renilla luciferase reporter activity relative to Firefly luciferase was evaluated 72 h after transfection of ZEB1 3′UTR or the same construction with mutated predicted miR-200b-3p binding sites (ZEB1 3′UTR miR-200b mut) in Cal62 cells co-transfected with the siRNAs siControl, siADAR1 #1 or siADAR1 #2. e Renilla luciferase reporter activity relative to Firefly luciferase was evaluated 72 h after transfection of ZEB1 3′UTR or the same construction with mutated predicted miR-200b-3p binding sites (ZEB1 3′UTR miR-200b mut) in TPC1 and Cal62 cells co-transfected with the WT miR-200b or edited (edit) miR-200b mimics or a negative control (Neg.Control). Values represent mean ± SD (n = 3). *p < 0.05; **p < 0.01; ***p < 0.001.
Fig. 4
Fig. 4. Editing of miR-200b impairs its ability to inhibit ZEB1, modulating the thyroid cell invasion capacity.
a Left: representative immunoblot for ADAR1 and ZEB1 72 h after transfection with WT miR-200b or edited (edit) miR-200b mimics or negative control in TPC1 and Cal62 cells. GAPDH was used as a loading control. Right: quantification relative to the negative control transfected cells. b Cal62 cells were co-transfected with an siRNA (siControl or siADAR1) and an miRNA mimic (negative control, WT miR-200b wt or edit miR-200b mimics). Upper panel: representative images of the lower chamber (invading cells). Bottom panel: quantification of invasion relative to siControl—Neg. Control cells. Values represent mean ± SD (n = 3). *p < 0.05; **p < 0.01; ***p < 0.001, ns nonsignificant.
Fig. 5
Fig. 5. ADAR1 regulation in thyroid cancer.
a Cal62 and TPC1 cells were treated with DMSO (vehicle), 10 µM AKTi, 50 µM selumetinib or the combination of both inhibitors. Left: representative immunoblot for the indicated proteins. GAPDH was used as a loading control. Right: ADAR1 p150 (upped panel) and ADAR1 p110 (bottom panel) quantification relative to DMSO-treated cells. PCCl3-inducible HRAS (b) or BRAF (c) cells were treated with doxycycline for 48 and 72 h. Left panels: representative immunoblots. GAPDH was used as a loading control. Right panels: ADAR1 p150 and ADAR1 p110 protein level quantification relative to nontreated cells. Values represent mean ± SD (n = 3). *p < 0.05; **p < 0.01; ***p < 0.001, ns nonsignificant.
Fig. 6
Fig. 6. Inhibition of RNA A-to-I editing reduces viability and proliferation of thyroid cancer cells. TPC1 and Cal62 cells were treated with 8-azaadenosine (8-aza) (1 µM or 2 µM) or water (H20).
a Relative AZIN1 edited/AZIN1 wild-type (AZIN1 Edit/WT) mRNA levels assayed by RESS-qRT-PCR 72 h post treatment. b Relative ADAR1 mRNA level assayed by qRT-PCR 72 h post treatment. c MTT assays at the indicated time points at 100 nM, 500 nM, 1 µM, and 2 µM 8-aza concentration. d Upper panel: representative images of crystal violet-stained cells. Bottom panel: quantification relative to nontreated cells. Values represent mean ± SD (n = 3). *p < 0.05; **p < 0.01; ***p < 0.001.
Fig. 7
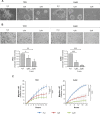
Fig. 7. Inhibition of RNA A-to-I editing reduces 3D growth and 2D invasion and migration in thyroid cancer cells.
TPC1 and Cal62 cell lines were treated with 8-azaadenosine (8-aza) (1 or 2 µM) or water (H2O). a 3D cell culture in Matrigel. b Upper panel: representative images of the lower chamber (invading cells). Bottom panel: cell invasion relative to the nontreated cells. c Quantification from a wound-healing assay at the indicated time points after scratching. Values represent mean ± SD (n = 3). *p < 0.05; **p < 0.01; ***p < 0.001.

Similar articles

Cited by

References

    1. Bass BL. RNA editing by adenosine deaminases that act on RNA. Annu Rev Biochem. 2002;71:817–46. doi: 10.1146/annurev.biochem.71.110601.135501. - DOI - PMC - PubMed
    1. Keegan LP, Gallo A, O’Connell MA. The many roles of an RNA editor. Nat Rev Genet. 2001;2:869–78. doi: 10.1038/35098584. - DOI - PubMed
    1. Walkley CR, Li JB. Rewriting the transcriptome: adenosine-to-inosine RNA editing by ADARs. Genome Biol. 2017;18:205. doi: 10.1186/s13059-017-1347-3. - DOI - PMC - PubMed
    1. Lehmann KA, Bass BL. The importance of internal loops within RNA substrates of ADAR1. J Mol Biol. 1999;291:1–13. doi: 10.1006/jmbi.1999.2914. - DOI - PubMed
    1. Song C, Sakurai M, Shiromoto Y, Nishikura K. Functions of the RNA Editing Enzyme ADAR1 and their relevance to human diseases. Genes. 2016;7:1–24. - PMC - PubMed

Publication types

MeSH terms