. 2020 Apr;39(18):3726-3737.
doi: 10.1038/s41388-020-1246-z. Epub 2020 Mar 10.

Tumor progression and chromatin landscape of lung cancer are regulated by the lineage factor GATA6

Affiliations

Tumor progression and chromatin landscape of lung cancer are regulated by the lineage factor GATA6

Anna Arnal-Estapé et al. Oncogene. 2020 Apr.

Abstract

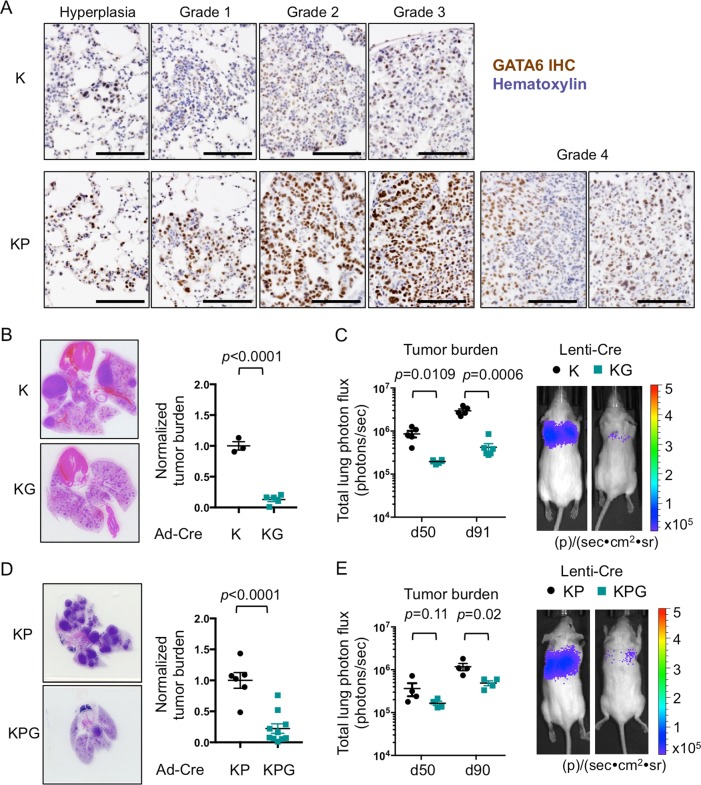
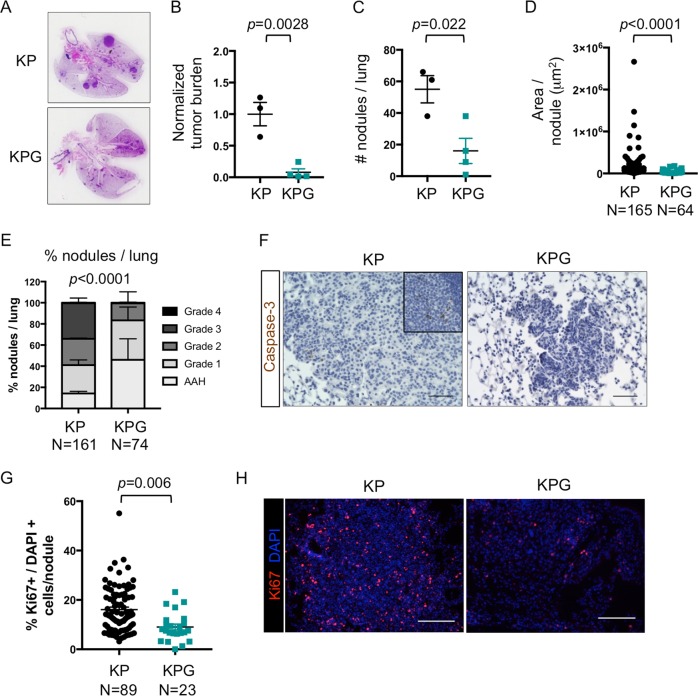
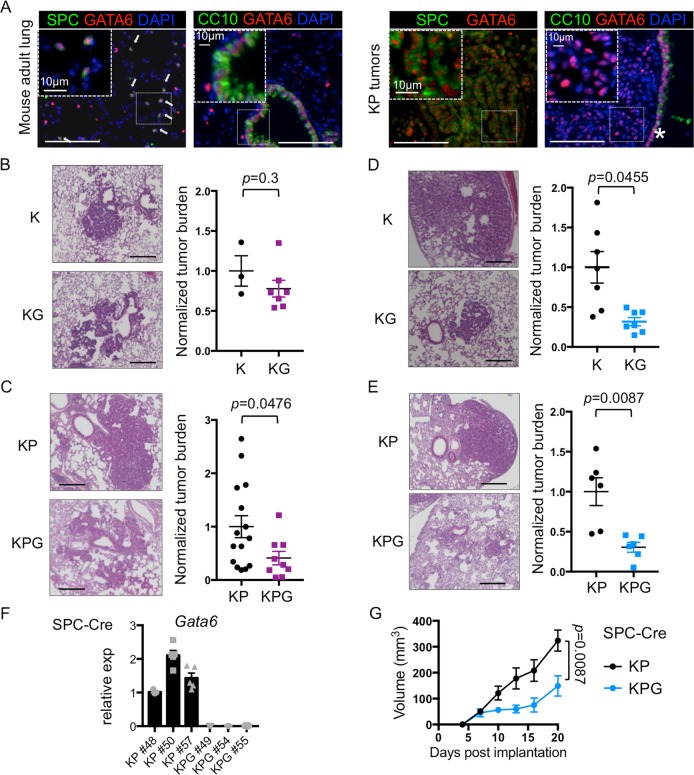
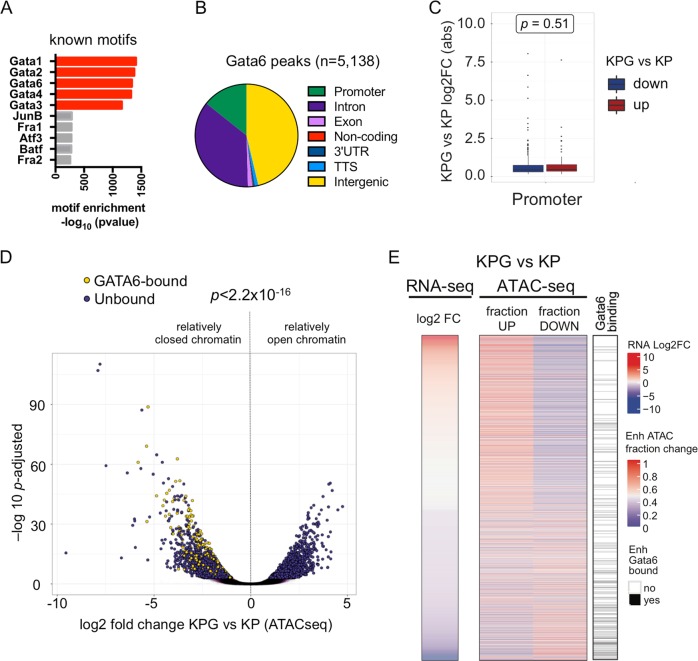
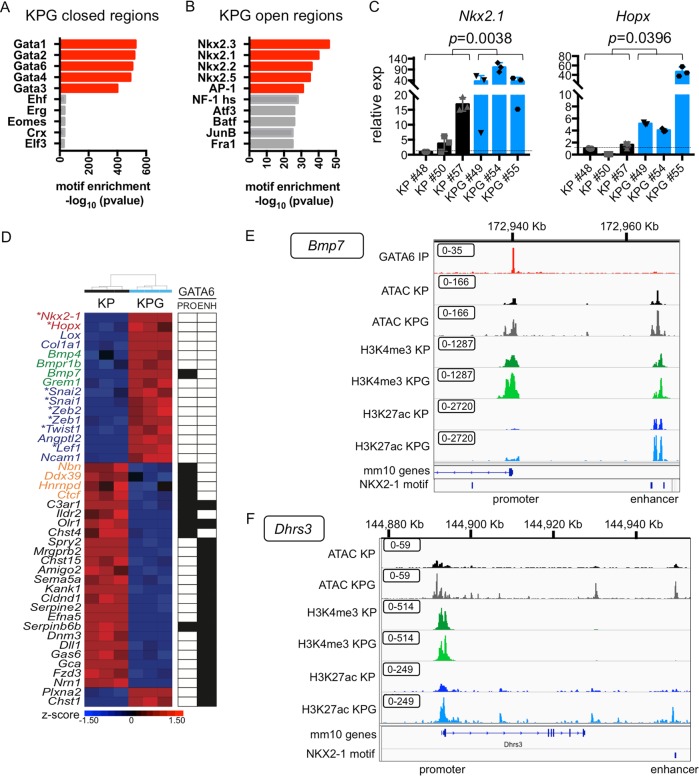
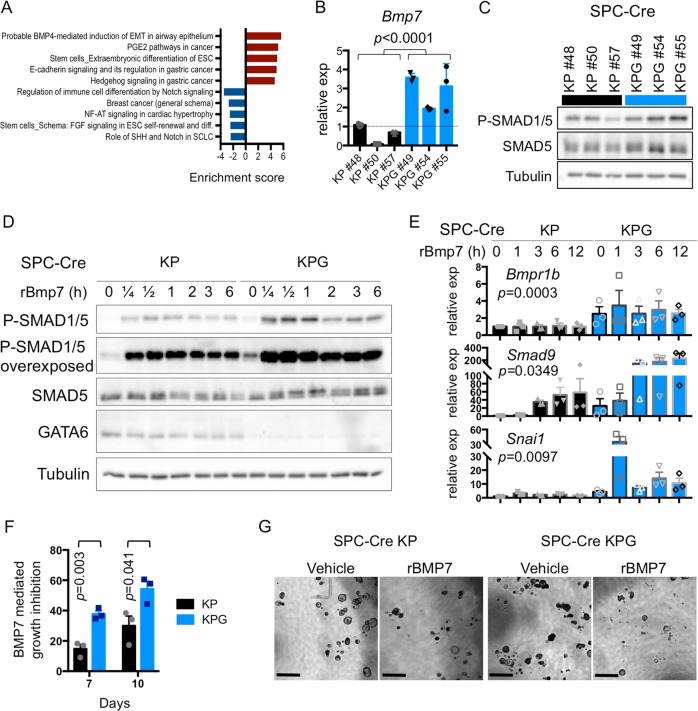
Lineage selective transcription factors (TFs) are important regulators of tumorigenesis, but their biological functions are often context dependent with undefined epigenetic mechanisms of action. In this study, we uncover a conditional role for the endodermal and pulmonary specifying TF GATA6 in lung adenocarcinoma (LUAD) progression. Impairing Gata6 in genetically engineered mouse models reduces the proliferation and increases the differentiation of Kras mutant LUAD tumors. These effects are influenced by the epithelial cell type that is targeted for transformation and genetic context of Kras-mediated tumor initiation. In LUAD cells derived from surfactant protein C expressing progenitors, we identify multiple genomic loci that are bound by GATA6. Moreover, suppression of Gata6 in these cells significantly alters chromatin accessibility, particularly at distal enhancer elements. Analogous to its paradoxical activity in lung development, GATA6 expression fluctuates during different stages of LUAD progression and can epigenetically control diverse transcriptional programs associated with bone morphogenetic protein signaling, alveolar specification, and tumor suppression. These findings reveal how GATA6 can modulate the chromatin landscape of lung cancer cells to control their proliferation and divergent lineage dependencies during tumor progression.


Conflict of interest statement

DXN has received research funding from AstraZeneca, Inc. and Leidos, Inc.

Figures

Fig. 1
Fig. 1. Gata6 deletion impairs LUAD progression in KrasLSL-G12D (K) and KrasLSL-G12Dp53fl/fl (KP) mouse models.
a Immunohistochemistry of GATA6 in K and KP GEMMs at different stages of LUAD progression. Scale bar = 100 μm. b Left, H&E of tumor-bearing lungs from K and KG mice at 50 weeks post infection with Ad-Cre. Right, quantification of tumor burden (total tumor area) per lung (n = 3–5 mice). c Left, lung tumor burden of K and KG mice measured by bioluminescence at 50 and 91 days post infection with Lenti-Cre (n = 5–6 mice). Right, representative bioluminescent pictures from day 91. d Left, H&E of tumor-bearing lungs from KP and KPG mice at 12 weeks post infection with Ad-Cre. Right, quantification of tumor burden (total tumor area) per lung (n = 6–10 mice). e Left, lung tumor burden of KP and KPG mice measured by bioluminescence at 50 and 90 days post infection with Lenti-Cre (n = 4 mice). Right, representative bioluminescent pictures from day 90. Unless indicated, data were plotted with standard error of the mean (SEM). P value was calculated by unpaired t-test, except for day 50 of e (Mann–Whitney) and c (Welch’s t-test). Total tumor area was measured per lung and per mouse, and was normalized to K or KP controls.
Fig. 2
Fig. 2. Gata6 loss impairs cell proliferation and tumor grade of KP tumors.
a H&E of tumor-bearing lungs from KP and KPG mice from Fig. 1e. bd Quantification/measurement of tumor nodules of mice from Fig. 1e (n = 3–4 mice). b Tumor burden was quantified by measuring the total tumor area per lung and normalized to the KP group. c Number of nodules per lung was quantified. d Nodule area was measured for each individual nodule (n = 64–165 nodules). e Tumors from Fig. 1e were graded as previously described [42] (n = 74–161 nodules). AAH, atypical adenomatous hyperplasia. P value by chi-square. f Representative images of cleaved caspase-3 immunohistochemistry in mice from Fig. 1e. Top inset shows staining in the thymus as a positive control for Caspase-3+ apoptotic cells. Scale bar = 50 μm. g The percentage of Ki67+ cells relative to all DAPI+ cells was calculated per nodule from animals in Fig. 1e (n = 23–89 nodules). h Representative immunofluorescence of Ki67 (red) and DAPI (blue) from each group quantified in g. Scale bar = 100 μm. Unless indicated, data were plotted with standard error of the mean (SEM). P value was calculated by unpaired t-test, except for d, where P value was calculated by Mann–Whitney.
Fig. 3
Fig. 3. Regulation of lung tumorigenesis by Gata6 is progenitor cell type dependent.
a Immunofluorescence of GATA6 (red), SPC or CC10 (green), and DAPI (blue) in mouse adult lung (left) and KP tumors (right). *proximal nonmalignant airway. Scale bar = 100 μm. Arrows indicate SPC+ GATA6+ cells. b H&E of tumor-bearing lungs (left) and tumor burden (right) from K or KG mice at 13 weeks post infection with CC10-Cre (n = 3–7 mice). c KP or KPG mice were infected with CC10-Cre and analyzed as in b at 13 weeks post infection (n = 9–15 mice). d H&E of tumor-bearing lungs (left), and tumor burden (right) from K or KG mice at 22 weeks post infection with SPC-Cre (n = 7 mice). e KP or KPG mice were infected with SPC-Cre and analyzed as in b at 13 weeks (n = 6 mice). Scale bar for H&Es = 250 μm. Normalized tumor burden was plotted and analyzed as in Fig. 1b. P value was calculated by unpaired t-test, except for c, where the P value was calculated by Mann–Whitney and d, e with Welch’s t-test. f Quantitative Real Time PCR (qRT-PCR) for Gata6 normalized to b-actin on tumor cell lines derived from SPC-Cre KP or KPG mice (n = 5 biological replicates). g Cells in f were injected subcutaneously and tumor volumes were measured (n = 3 mice per group, 6 tumors total). Data were plotted with SEM. P value was calculated by Mann–Whitney test using area under the curve.
Fig. 4
Fig. 4. The GATA6 dependent chromatin and epigenomic landscape of LUAD cells.
a Transcription factor (TF) binding motif analysis for GATA6 ChIP-seq peaks in KP tumor. b Annotation of the genomic loci overlapping with GATA6 peaks. Promoter = 0–2 Kb upstream and downstream of transcription start site (TSS). c Box plot of absolute log2 fold change of genes differentially expressed in KPG versus KP cells with GATA6 bound at their promoters. No bias was detected between activated (red) or repressed (blue) genes. P value was calculated by Mann–Whitney test. d Volcano plot of significant ATAC peaks with annotation of GATA6 binding (bound, yellow; unbound, purple). P value was calculated by chi-square. e Heatmap of differential gene expression, chromatin accessibility, and GATA6 binding in putative enhancers (defined as H3K27ac peaks within 100Kb of TSS). Left: each row is a gene that is differentially expressed in KPG versus KP cells. Middle: for each gene, ATAC peaks within 100 Kb of their TSS were determined, and the fraction of newly open (up) or closed (down) regions in KPG cells is plotted. Right: GATA6 binding (black) is based on whether one or more GATA6 ChIP-seq peaks overlap with significantly changed ATAC peaks within the same region in KP cells.
Fig. 5
Fig. 5. GATA6 deficiency reprograms distal enhancers that are enriched for NKX2-1 motifs.
a TF motif analysis was performed for regions with newly closed chromatin in KPG cells. Log2 fold change < −1. P adjusted < 0.05. b TF motif analysis was performed for regions with newly open chromatin in KPG cells. Log2 fold change > 1. P adjusted < 0.05. c qRT-PCR of the indicated genes in cell lines from Fig. 3f (n = 3 biological replicates). Gene expression was normalized to b-actin. SEM is plotted and P value was calculated by Welch’s t-test. d Heatmap of representative genes differentially expressed in KPG versus KP cells (P adjusted < 0.05) clustered by Pearson average (z-score depicted). Genes involved in alveolar differentiation (red), BMP signaling (green), EMT (blue), and E2F targets (orange) are annotated. *TFs. For each gene, GATA6 binding (black box) in KP cells was indicated for their promoter (PRO) or enhancer (ENH). e IGV track for the upstream TSS of Bmp7 (Chr 2 172,918,000–172,970,000 of the mm10 genome) with overlapping GATA6 binding peaks at the promoter and an NKX2-1 motif overlapping a distal enhancer. f IGV track at TSS of Dhrs3 (Chr 4 144,878,000–144,950,000 of the mm10 genome) with an NKX2-1 motif overlapping a distal enhancer. Annotation of the tracks: KP GATA6 IP peaks (red), KP ATAC peaks (black), KPG ATAC peaks (gray), KP H3K4me3 peaks (dark green), KPG H3K4me3 peaks (light green), KP H3K27ac peaks (dark blue), KPG H3K27ac (light blue). Boxed values = data range for each track.
Fig. 6
Fig. 6. GATA6 inhibits BMP signaling.
a Top 5 upregulated and downregulated pathways in SPC KPG cells relative to KP cells as defined by Metacore analysis using genes from Supplementary Fig. 3a. Enrichment score = –log10 P value (corrected for directionality). b qRT-PCR of the Bmp7 in the indicated cell lines (n = 3 biological replicates). Gene expression was normalized to b-actin. SEM is plotted and P value was calculated by Welch’s t-test. c Western blot of phospho-SMAD1/5 Ser463/465, SMAD5, and Tubulin in the indicated samples. d KP and KPG cells were stimulated with recombinant murine BMP7 (100 ng/mL) and harvested at the indicated time points (h = hours). Western blots for the indicated proteins were performed on cell lysates. Depicted is a representative of three independent experiments. e Bmpr1b, Smad9, and Snai1 mRNA were measured by qRT-PCR in KP and KPG cells that were stimulated with BMP7 for the indicated time points (h = hours) as in d (n = 3 biological replicates). Expression was normalized to b-actin and SEM was plotted. For Bmpr1b, P value was calculated comparing all values for each cell line using unpaired t-test. For other genes, P value was calculated by two-way ANOVA (cell line and time point). f Quantification of KP and KPG cells grown as organoids in the presence of BMP7 or vehicle. BMP7 growth inhibition was calculated by normalizing BMP7 treated cell growth relative to vehicle control and plotted as an absolute value. Mean and SEM plotted from three independent experiments and P value was calculated by unpaired t-test. g Representative bright field images of the organoids are depicted. Scale bar = 1000 μm.

References

    1. Whitsett JA, Haitchi HM, Maeda Y. Intersections between pulmonary development and disease. Am J Respir Crit Care Med. 2011;184:401–6. doi: 10.1164/rccm.201103-0495PP. - DOI - PMC - PubMed
    1. Cheung WK, Nguyen DX. Lineage factors and differentiation states in lung cancer progression. Oncogene. 2015;34:5771–80. doi: 10.1038/onc.2015.85. - DOI - PMC - PubMed
    1. Chen Z, Fillmore CM, Hammerman PS, Kim CF, Wong KK. Non-small-cell lung cancers: a heterogeneous set of diseases. Nat Rev Cancer. 2014;14:535–46. doi: 10.1038/nrc3775. - DOI - PMC - PubMed
    1. Molkentin JD. The zinc finger-containing transcription factors GATA-4, -5, and -6. Ubiquitously expressed regulators of tissue-specific gene expression. J Biol Chem. 2000;275:38949–52. doi: 10.1074/jbc.R000029200. - DOI - PubMed
    1. Zaret KS, Carroll JS. Pioneer transcription factors: establishing competence for gene expression. Genes Dev. 2011;25:2227–41. doi: 10.1101/gad.176826.111. - DOI - PMC - PubMed

Publication types