. 2020 Jun;63(6):1174-1185.
doi: 10.1007/s00125-020-05114-7. Epub 2020 Mar 10.

Slow progressors to type 1 diabetes lose islet autoantibodies over time, have few islet antigen-specific CD8+ T cells and exhibit a distinct CD95hi B cell phenotype

Affiliations

Slow progressors to type 1 diabetes lose islet autoantibodies over time, have few islet antigen-specific CD8+ T cells and exhibit a distinct CD95hi B cell phenotype

Stephanie J Hanna et al. Diabetologia. 2020 Jun.

Abstract

Aims/hypothesis: The aim of this study was to characterise islet autoantibody profiles and immune cell phenotypes in slow progressors to type 1 diabetes.

Methods: Immunological variables were compared across peripheral blood samples obtained from slow progressors to type 1 diabetes, individuals with newly diagnosed or long-standing type 1 diabetes, and healthy individuals. Polychromatic flow cytometry was used to characterise the phenotypic attributes of B and T cells. Islet autoantigen-specific B cells were quantified using an enzyme-linked immunospot (ELISpot) assay and islet autoantigen-specific CD8+ T cells were quantified using peptide-HLA class I tetramers. Radioimmunoassays were used to detect islet autoantibodies. Sera were assayed for various chemokines, cytokines and soluble receptors via ELISAs.

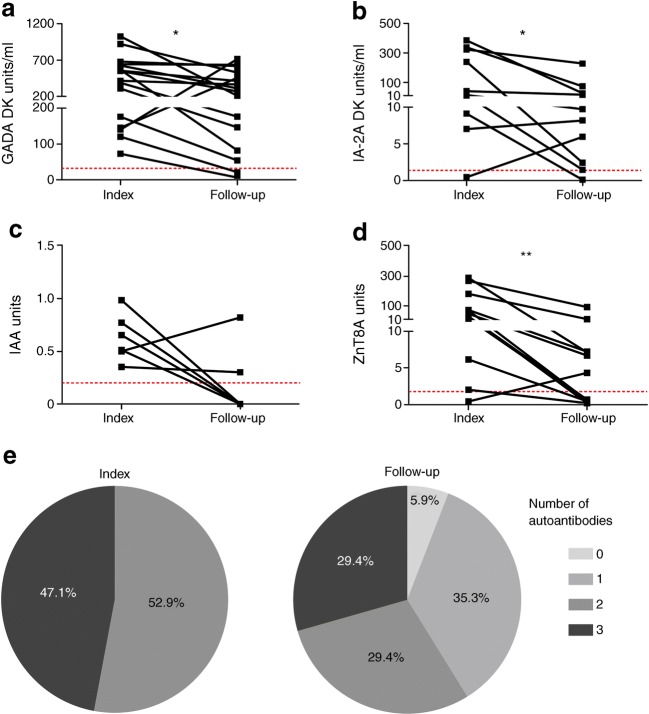
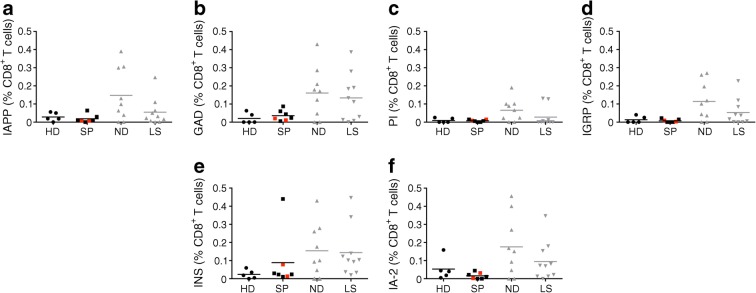
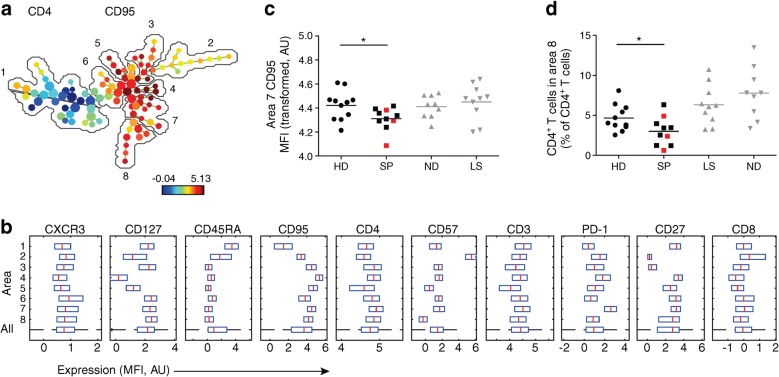
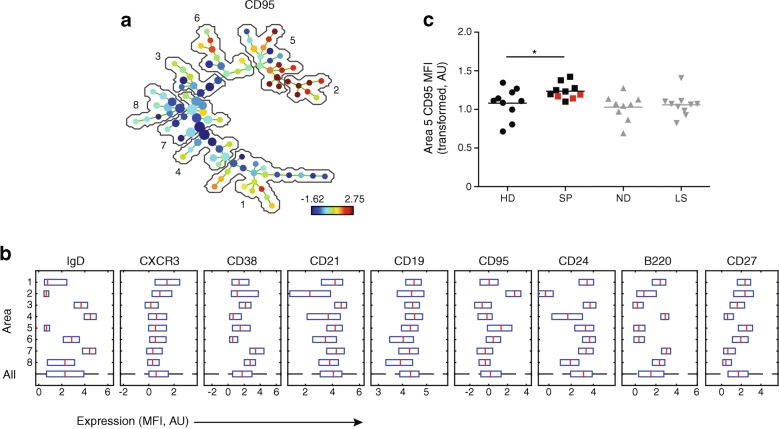
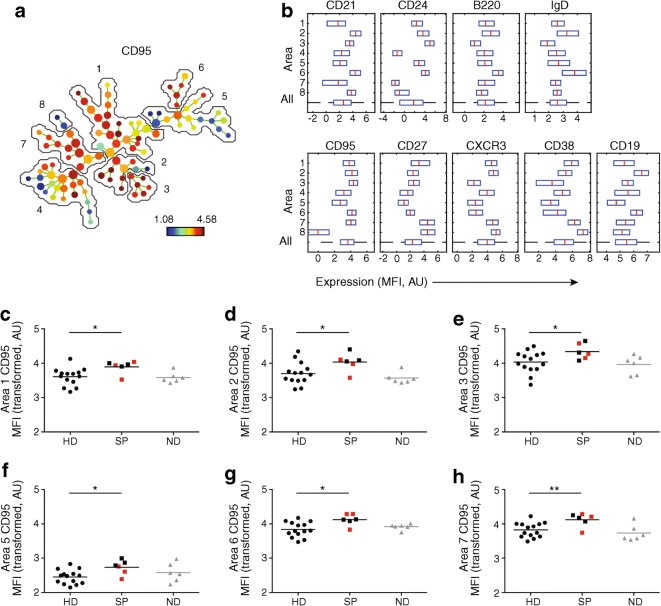
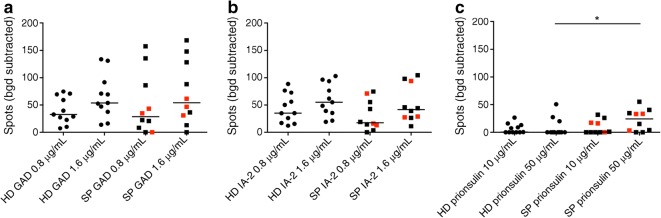
Results: Islet autoantibodies were lost over time in slow progressors. Various B cell subsets expressed higher levels of CD95 in slow progressors, especially after polyclonal stimulation, compared with the corresponding B cell subsets in healthy donors (p < 0.05). The phenotypic characteristics of CD4+ and CD8+ T cells were similar in slow progressors and healthy donors. Lower frequencies of CD4+ T cells with a central memory phenotype (CD27int, CD127+, CD95int) were observed in slow progressors compared with healthy donors (mean percentage of total CD4+ T cells was 3.00% in slow progressors vs 4.67% in healthy donors, p < 0.05). Autoreactive B cell responses to proinsulin were detected at higher frequencies in slow progressors compared with healthy donors (median no. of spots was 0 in healthy donors vs 24.34 in slow progressors, p < 0.05) in an ELISpot assay. Islet autoantigen-specific CD8+ T cell responses were largely absent in slow progressors and healthy donors. Serum levels of DcR3, the decoy receptor for CD95L, were elevated in slow progressors compared with healthy donors (median was 1087 pg/ml in slow progressors vs 651 pg/ml in healthy donors, p = 0.06).

Conclusions/interpretation: In this study, we found that slow progression to type 1 diabetes was associated with a loss of islet autoantibodies and a distinct B cell phenotype, consistent with enhanced apoptotic regulation of peripheral autoreactivity via CD95. These phenotypic changes warrant further studies in larger cohorts to determine their functional implications.

Keywords: Autoantibodies; B cells; CD95; DcR3; ELISpot; Peptide-HLA class I tetramers; Proinsulin; Slow progressors to type 1 diabetes; T cells.


Figures

Fig. 1
Fig. 1
Loss of autoantibodies in some slow progressors over time. Islet autoantibody titres were measured in follow-up samples obtained from slow progressors (n = 17) at least 10 years after initial testing (index) as part of the BOX study. Follow-up samples were acquired at the time of sampling for immune cell analysis (n = 10), before/at diagnosis (n = 3), or as recently as possible (n = 4). (ad) Only titres for individuals positive for a specific autoantibody are shown: (a) GADA (n = 16); (b) IA-2A (n = 10); (c) IAA (n = 6); (d) ZnT8A (n = 12). Dotted lines indicate the threshold for seropositive islet autoantibody titres: GADA ≥33 DK units/ml; IA-2A ≥1.4 DK units/ml; IAA ≥0.2 units; ZnT8A ≥1.8 units. GADA and IA-2A titres are expressed in DK units/ml derived from a standard curve developed for the NIDDK-sponsored Islet Autoantibody Harmonization Program. IAA and ZnT8A titres are expressed in units derived from in-house standard curves, measured in duplicate in 5 μl and 2 μl of serum respectively. *p < 0.05 and **p < 0.01 for follow-up vs index (determined using the Wilcoxon matched pairs test). (e) Proportion of individuals with 0, 1, 2 or 3 autoantibodies (GADA, IA-2A, IAA and/or ZnT8A); p = 0.007 determined using Fisher’s exact test comparing groups of ≥2 and <2 autoantibodies for index vs follow-up samples
Fig. 2
Fig. 2
Islet autoantigen-specific CD8+ T cell responses are not found in slow progressors. HLA-A2+ participants were tested for CD8+ T cell responses to known islet autoantigens using peptide–HLA-A2 tetramers (ESM Table 2). Background staining was determined using a non-interfacing peptide–HLA-A2 tetramer. Results are shown as background-subtracted frequencies among CD8+ T cells. Tetramer responses are shown to: (a) islet amyloid polypeptide (KLQVFLIVL); (b) GAD (VMNILLQYVV); (c) proinsulin (ALWGPDPAAA); (d) islet-specific glucose-6-phosphatase catalytic subunit-related protein (VLFGLGFAI); (e) insulin (HLVEALYLV); (f) IA-2 (MVWESGCTV). Red squares denote slow progressors who tested seropositive for a single islet autoantibody at the time of immune cell analysis. Horizontal lines indicate median values. Results for people with newly diagnosed and long-standing type 1 diabetes are shown in grey to add context and to represent a positive control in the assay but were not included in the statistical analysis shown on the graph due to small sample sizes and lack of age matching between newly diagnosed and slow-progressing donors. HD, healthy donors; IA-2, insulin antigen-2; IAPP, islet amyloid polypeptide; IGRP, islet-specific glucose-6-phosphatase catalytic subunit-related protein; INS, insulin; LS, long-standing type 1 diabetes; ND, newly diagnosed type 1 diabetes; PI, proinsulin; SP, slow progressors
Fig. 3
Fig. 3
Phenotypic characteristics of T cells in slow progressors indicate decreased CD95 expression and a decreased percentage of central memory T cells. Expression of the indicated markers was assessed using flow cytometry. (a) SPADE image of pooled CD4+ T cells from all participants, auto-partitioned into eight annotated areas with node size scaled to the log number of cells in each node, showing median CD95 expression as a heatmap. Based on the expression of CD27 and CD45RA, the cells in the different areas were designated as follows: area 1, naive (CD27+CD45RA+); area 2, effector (CD27CD45RAint); area 3, effector memory (CD27CD45RA); areas 4–8, memory (CD27int/+CD45RA). (b) SPADE boxplots showing marker distribution in each area or in all areas for the pooled CD4+ T cell samples depicted in (a). Central red lines indicate median values and the ends of blue boxes indicate interquartile ranges. The dashed horizontal line at the bottom indicates the ‘All’ category. (c) CD95 expression (transformed values) in CD4+ T cell area 7 for each participant. (d) Percentage of CD4+ T cells in CD4+ T cell area 8 for each participant. In (c) and (d), horizontal lines indicate mean values and red squares denote slow progressors who tested seropositive for a single islet autoantibody at the time of immune cell analysis. *p < 0.05 for slow progressors vs healthy donors (determined using an unpaired Student’s t test). Results for people with newly diagnosed and long-standing type 1 diabetes are shown in grey to add context but were not included in statistical analysis due to small sample sizes and lack of age matching between newly diagnosed and slow-progressing individuals. AU, arbitrary unit; HD, healthy donors; LS, long-standing type 1 diabetes; MFI, median fluorescence intensity; ND, newly diagnosed type 1 diabetes; SP, slow progressors
Fig. 4
Fig. 4
Phenotypic characterisation of unstimulated B cells in slow progressors demonstrate increased expression of CD95 among B cells with a switched memory phenotype. Expression of the indicated markers in unstimulated samples was assessed using flow cytometry. (a) SPADE image of pooled B cells from all participants, auto-partitioned into eight annotated areas with node size scaled to the log number of cells in each node, showing median CD95 expression as a heatmap. Based on the expression of CD27 and IgD, the cells in the different areas were designated as follows: areas 1, 2 and 5, switched memory (CD27+IgD); area 3, unswitched (CD27intIgD+); areas 4 and 7, naive (CD27IgD+); area 6, transitional (CD27intIgDint); area 8, naive/switched (CD27IgDint). (b) SPADE boxplots showing marker distribution in each area or in all areas for the pooled samples depicted in (a). Central red lines indicate median values and the ends of blue boxes indicate interquartile ranges. The dashed horizontal line at the bottom indicates the ‘All’ category. (c) CD95 expression (transformed values) in area 5 for each participant. Horizontal lines indicate mean values and red squares denote slow progressors who tested seropositive for a single islet autoantibody at the time of immune cell analysis. *p < 0.05 for slow progressors vs healthy donors (determined using an unpaired Student’s t test). Results for people with newly diagnosed and long-standing type 1 diabetes are shown in grey to add context but were not included in statistical analysis due to small sample sizes and lack of age matching between newly diagnosed and slow-progressing individuals. AU, arbitrary unit; HD, healthy donors; LS, long-standing type 1 diabetes; MFI, median fluorescence intensity; ND, newly diagnosed type 1 diabetes; SP, slow progressors
Fig. 5
Fig. 5
Phenotypic characteristics of stimulated B cells in slow progressors show increased CD95 expression compared with cells from healthy donors. Expression of the indicated markers in stimulated samples was assessed using flow cytometry. (a) SPADE image of pooled B cells from all participants, auto-partitioned into eight annotated areas with node size scaled to the log number of cells in each node, showing median CD95 expression as a heatmap. Based on the expression of CD27 and IgD, the cells in the different areas were designated as follows: area 1, switched memory (CD27+IgD); area 2, memory (CD27intIgDint); area 3, switched memory (CD27intIgD); areas 4 and 5, switched (CD27IgD); area 6, naive (CD27IgD+); areas 7 and 8, switched memory (CD27++IgD). (b) SPADE boxplots of marker distribution in each area or in all areas for the pooled samples depicted in (a). Central red lines indicate median values and the ends of blue boxes indicate interquartile ranges. The dashed horizontal line at the bottom indicates the ‘All’ category. (ch) CD95 expression (transformed values) in areas 1 (c), 2 (d), 3 (e), 5 (f), 6 (g) and 7 (h) for each participant. In (ch), horizontal lines indicate mean values and red squares denote slow progressors who tested seropositive for a single islet autoantibody at the time of immune cell analysis. *p < 0.05 and **p < 0.01 for slow progressors vs healthy donors (determined using an unpaired Student’s t test). Results for people with newly diagnosed type 1 diabetes are shown in grey to add context but were not included in statistical analysis due to small sample sizes and lack of age matching between newly diagnosed and slow-progressing individuals. AU, arbitrary unit; HD, healthy donors; MFI, median fluorescence intensity; ND, newly diagnosed type 1 diabetes; SP, slow progressors
Fig. 6
Fig. 6
Islet autoantigen-specific B cell responses in slow progressors, measured by ELISpot, are increased to proinsulin but not GAD or IA-2. B cell responses to the indicated islet autoantigens were quantified using an ELISpot assay to detect secreted IgG. Background responses were determined in the absence of islet autoantigens. Results are shown as the number of background-subtracted spots per 4 × 105 input PBMCs. Counts were averaged over at least six wells for each condition. ELISpot counts are shown for: (a) GAD at 0.8 μg/ml and 1.6 μg/ml; (b) IA-2 at 0.8 μg/ml and 1.6 μg/ml; (c) proinsulin at 10 μg/ml and 50 μg/ml. Horizontal lines indicate median values. Red squares denote slow progressors who tested seropositive for a single islet autoantibody at the time of immune cell analysis. *p < 0.05 for slow progressors vs healthy donors (determined using the Mann–Whitney U test). Bgd, background; HD, healthy donors; SP, slow progressors

Similar articles

Cited by

References

    1. Ziegler AG, Rewers M, Simell O, et al. Seroconversion to multiple islet autoantibodies and risk of progression to diabetes in children. JAMA. 2013;309(23):2473–2479. doi: 10.1001/jama.2013.6285. - DOI - PMC - PubMed
    1. Long AE, Wilson IV, Becker DJ, et al. Characteristics of slow progression to diabetes in multiple islet autoantibody-positive individuals from five longitudinal cohorts: the SNAIL study. Diabetologia. 2018;61(6):1484–1490. doi: 10.1007/s00125-018-4591-5. - DOI - PMC - PubMed
    1. Hull CM, Peakman M, Tree TIM. Regulatory T cell dysfunction in type 1 diabetes: what’s broken and how can we fix it? Diabetologia. 2017;60(10):1839–1850. doi: 10.1007/s00125-017-4377-1. - DOI - PMC - PubMed
    1. Lohmann T, Laue S, Nietzschmann U, et al. Reduced expression of Th1-associated chemokine receptors on peripheral blood lymphocytes at diagnosis of type 1 diabetes. Diabetes. 2002;51(8):2474–2480. doi: 10.2337/diabetes.51.8.2474. - DOI - PubMed
    1. Yamada S, Oikawa Y, Sakai GEN, Atsumi Y, Maruyama T, Shimada A. Expression levels of CXC chemokine receptors 3 are associated with clinical phenotype of type 1 diabetes. Ann N Y Acad Sci. 2006;1079(1):186–189. doi: 10.1196/annals.1375.029. - DOI - PubMed

Publication types

MeSH terms