

Transcriptomic analysis of expression of genes regulating cell cycle progression in porcine ovarian granulosa cells during short-term in vitro primary culture
- PMID: 32157392
- PMCID: PMC7299926
- DOI: 10.1007/s00418-020-01860-2
Transcriptomic analysis of expression of genes regulating cell cycle progression in porcine ovarian granulosa cells during short-term in vitro primary culture
Abstract
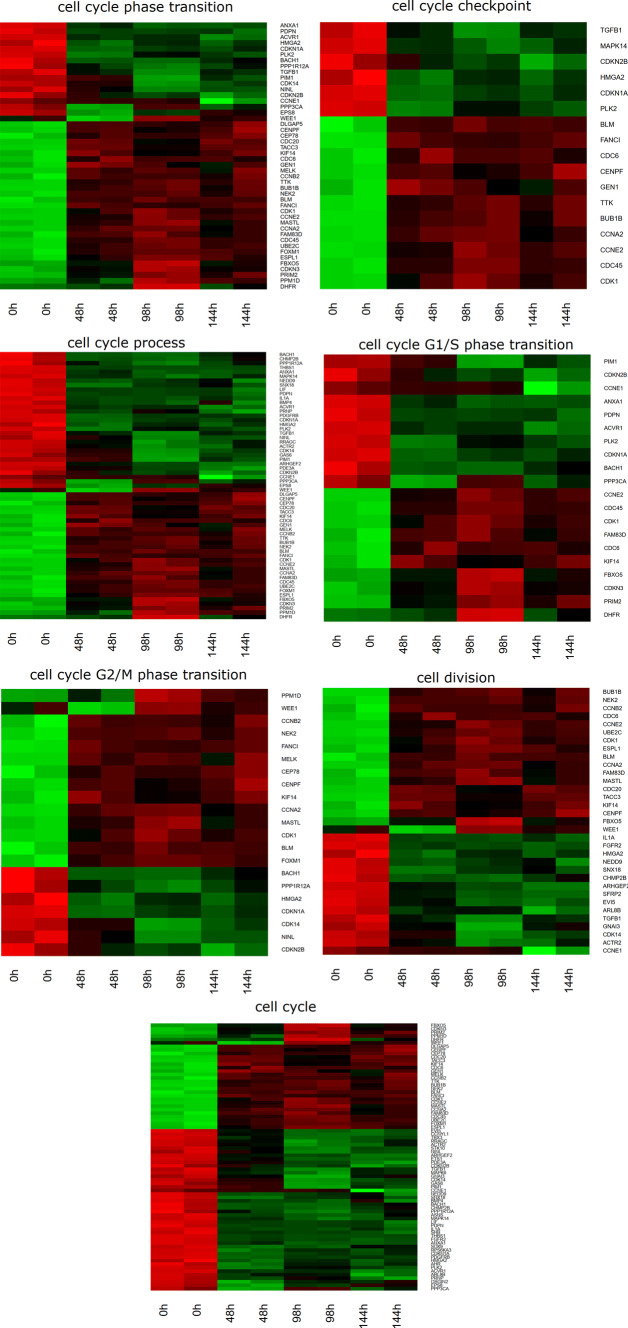
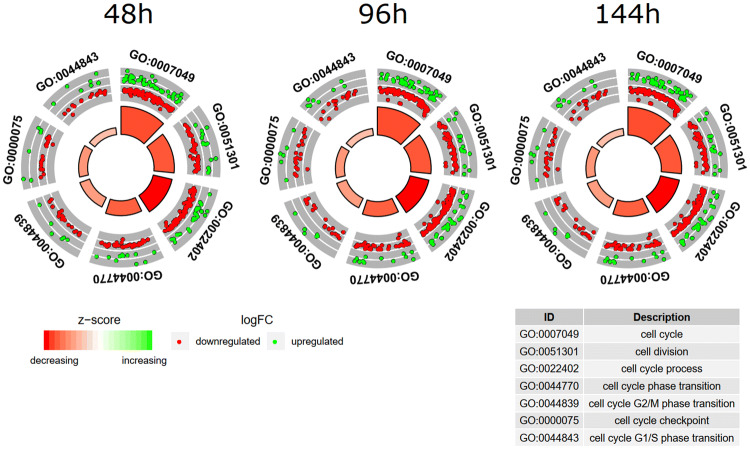
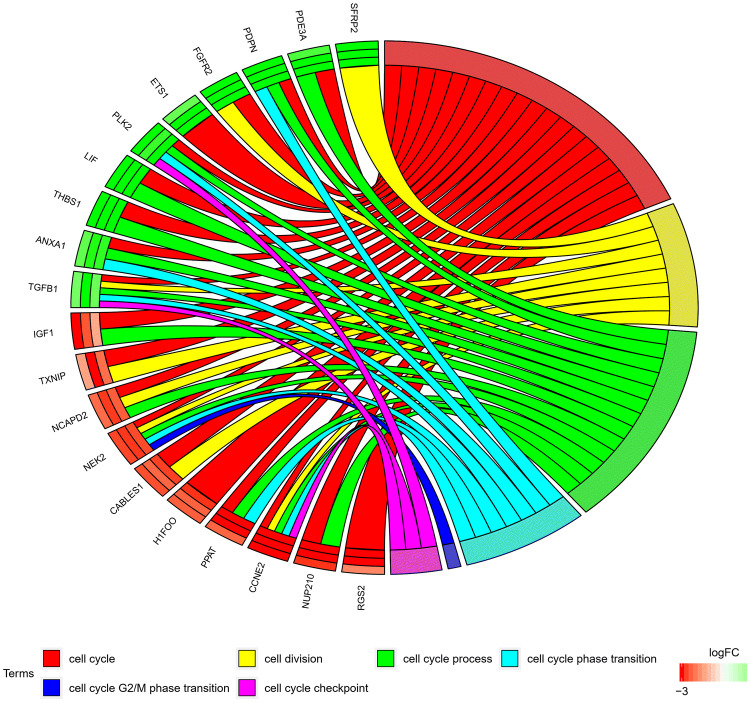
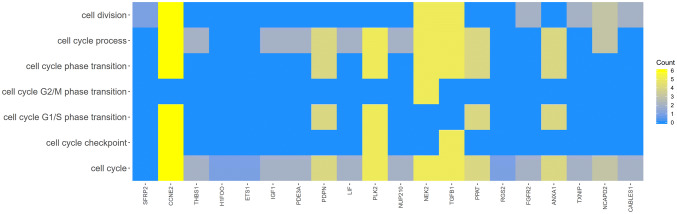
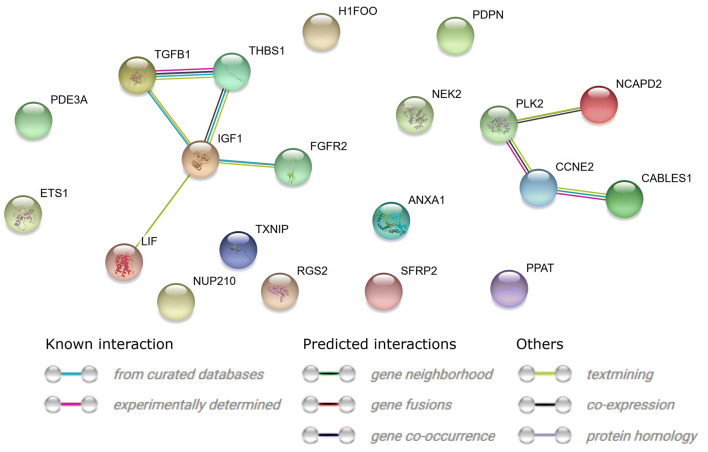
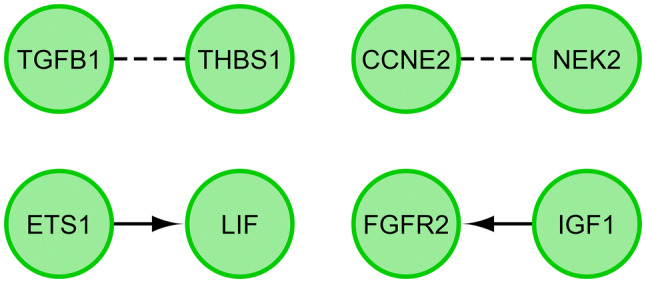
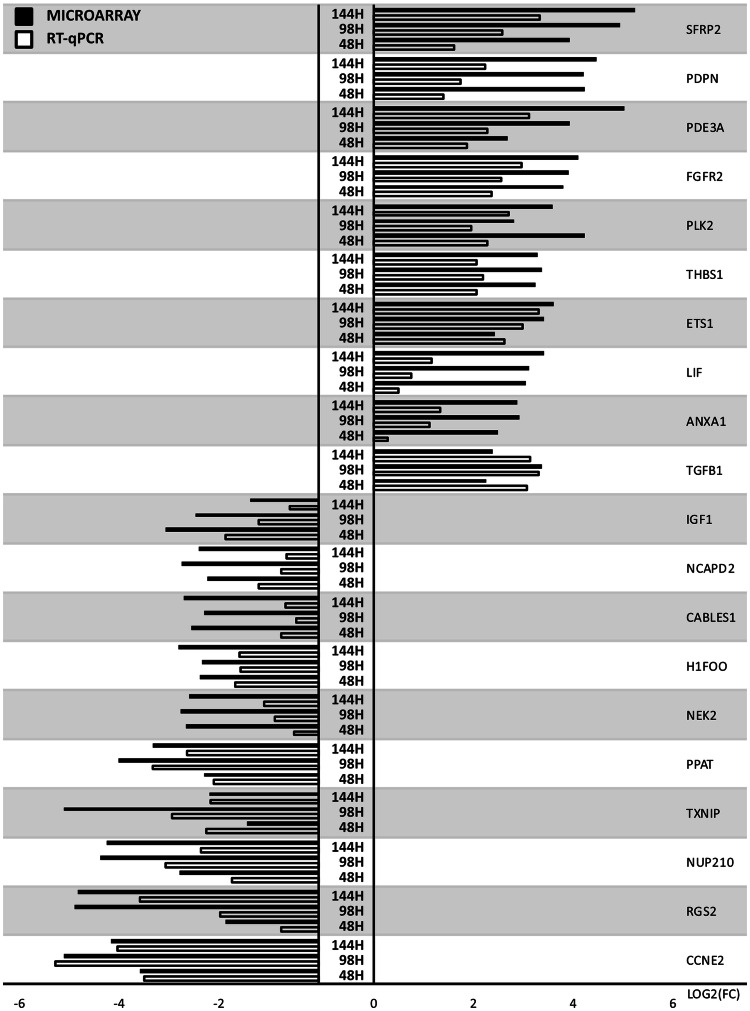
The primary function of ovarian granulosa cells (GCs) is the support of oocytes during maturation and development. Molecular analyses of granulosa cell-associated processes, leading to improvement of understanding of the cell cycle events during the formation of ovarian follicles (folliculogenesis), may be key to improve the in vitro fertilization procedures. Primary in vitro culture of porcine GCs was employed to examine the changes in the transcriptomic profile of genes belonging to "cell cycle", "cell division", "cell cycle process", "cell cycle phase transition", "cell cycle G1/S phase transition", "cell cycle G2/M phase transition" and "cell cycle checkpoint" ontology groups. During the analysis, microarrays were employed to study the transcriptome of GCs, analyzing the total RNA of cells from specific periods of in vitro cultures. This research was based on material obtained from 40 landrace gilts of similar weight, age and the same living conditions. RNA was isolated at specific timeframes: before the culture was established (0 h) and after 48 h, 96 h and 144 h in vitro. Out of 133 differentially expressed genes, we chose the 10 most up-regulated (SFRP2, PDPN, PDE3A, FGFR2, PLK2, THBS1, ETS1, LIF, ANXA1, TGFB1) and the 10 most downregulated (IGF1, NCAPD2, CABLES1, H1FOO, NEK2, PPAT, TXNIP, NUP210, RGS2 and CCNE2). Some of these genes known to play key roles in the regulation of correct cell cycle passage (up-regulated SFRP2, PDE3A, PLK2, LIF and down-regulated CCNE2, TXNIP, NEK2). The data obtained provide a potential reference for studies on the process of mammalian folliculogenesis, as well as suggests possible new genetic markers for cell cycle progress in in vitro cultured porcine granulosa cells.
Keywords: Granulosa cells; Microarray; Ovarian follicle; Pig; Primary culture.
Conflict of interest statement
All authors declare that they have no conflict of interest.
Figures
Similar articles
-
Transcriptomic profile of cell cycle progression genes in human ovarian granulosa cells.J Biol Regul Homeost Agents. 2019 Jan-Feb,;33(1):39-51. J Biol Regul Homeost Agents. 2019. PMID: 30761814
-
New Molecular Markers Involved in Regulation of Ovarian Granulosa Cell Morphogenesis, Development and Differentiation during Short-Term Primary In Vitro Culture-Transcriptomic and Histochemical Study Based on Ovaries and Individual Separated Follicles.Int J Mol Sci. 2019 Aug 15;20(16):3966. doi: 10.3390/ijms20163966. Int J Mol Sci. 2019. PMID: 31443152 Free PMC article.
-
The processes of cellular growth, aging, and programmed cell death are involved in lifespan of ovarian granulosa cells during short-term IVC - Study based on animal model.Theriogenology. 2020 May;148:76-88. doi: 10.1016/j.theriogenology.2020.02.044. Epub 2020 Mar 3. Theriogenology. 2020. PMID: 32160576
-
In vitro models for oocyte development.Theriogenology. 1998 Jan 15;49(2):451-60. doi: 10.1016/s0093-691x(97)00417-2. Theriogenology. 1998. PMID: 10732026 Review.
-
Meta-analysis of gene expression profiles in granulosa cells during folliculogenesis.Reproduction. 2016 Jun;151(6):R103-10. doi: 10.1530/REP-15-0594. Epub 2016 Mar 15. Reproduction. 2016. PMID: 26980808 Review.
Cited by
-
Expression of genes regulating cell division in porcine follicular granulosa cells.Cell Div. 2023 Aug 7;18(1):12. doi: 10.1186/s13008-023-00094-7. Cell Div. 2023. PMID: 37550786 Free PMC article.
-
Bisphenol A and bisphenol S both disrupt ovine granulosa cell steroidogenesis but through different molecular pathways.J Ovarian Res. 2023 Feb 3;16(1):30. doi: 10.1186/s13048-023-01114-4. J Ovarian Res. 2023. PMID: 36737804 Free PMC article.
-
New Gene Markers Expressed in Porcine Oviductal Epithelial Cells Cultured Primary In Vitro Are Involved in Ontological Groups Representing Physiological Processes of Porcine Oocytes.Int J Mol Sci. 2021 Feb 19;22(4):2082. doi: 10.3390/ijms22042082. Int J Mol Sci. 2021. PMID: 33669854 Free PMC article.
-
Exploration of the Antioxidant Effect of Spermidine on the Ovary and Screening and Identification of Differentially Expressed Proteins.Int J Mol Sci. 2023 Mar 17;24(6):5793. doi: 10.3390/ijms24065793. Int J Mol Sci. 2023. PMID: 36982867 Free PMC article.
-
Genome-Wide Association Analysis and Genetic Parameters for Egg Production Traits in Peking Ducks.Animals (Basel). 2024 Jun 27;14(13):1891. doi: 10.3390/ani14131891. Animals (Basel). 2024. PMID: 38998005 Free PMC article.
References
-
- Borys S, Brązert M, Jankowski M, et al. Enzyme linked receptor protein signaling pathway is one of the ontology groups that are highly up-regulated in porcine oocytes before in vitro maturation. J Biol Regul Homeost Agents. 2018;32:21–35. - PubMed
-
- Borys-Wójcik S, Kocherova I, Celichowski P, et al. Protein oligomerization is the biochemical process highly up-regulated in porcine oocytes before in vitro maturation (IVM) Med J Cell Biol. 2018;6:155–162. doi: 10.2478/acb-2018-0025. - DOI
-
- Budna J, Celichowski P, Karimi P, et al. Does porcine oocytes maturation in vitro is regulated by genes involved in transforming growth factor beta receptor signaling pathway? Adv Cell Biol. 2017;5:1–14. doi: 10.1515/acb-2017-0001. - DOI
MeSH terms
Grants and funding
LinkOut - more resources
Full Text Sources
Research Materials
Miscellaneous
