

Principles of temporal association cortex organisation as revealed by connectivity gradients
- PMID: 32157450
- PMCID: PMC7270054
- DOI: 10.1007/s00429-020-02047-0
Principles of temporal association cortex organisation as revealed by connectivity gradients
Abstract
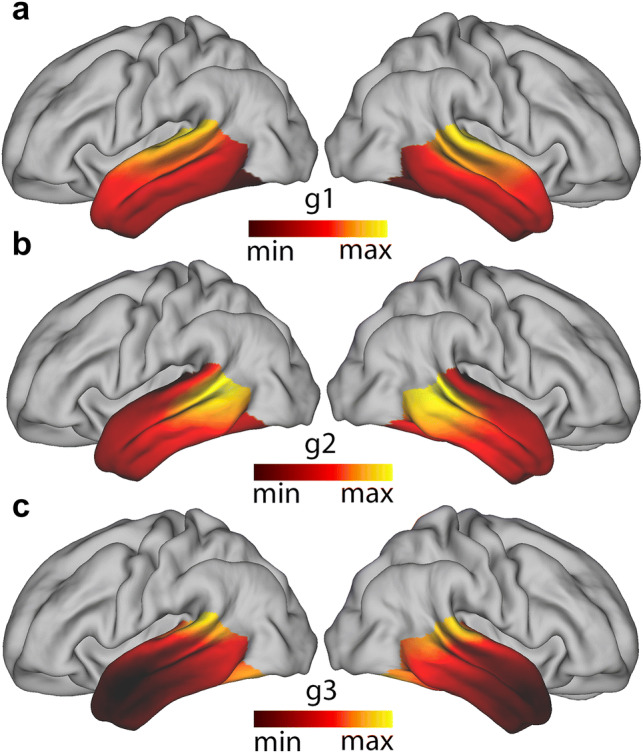
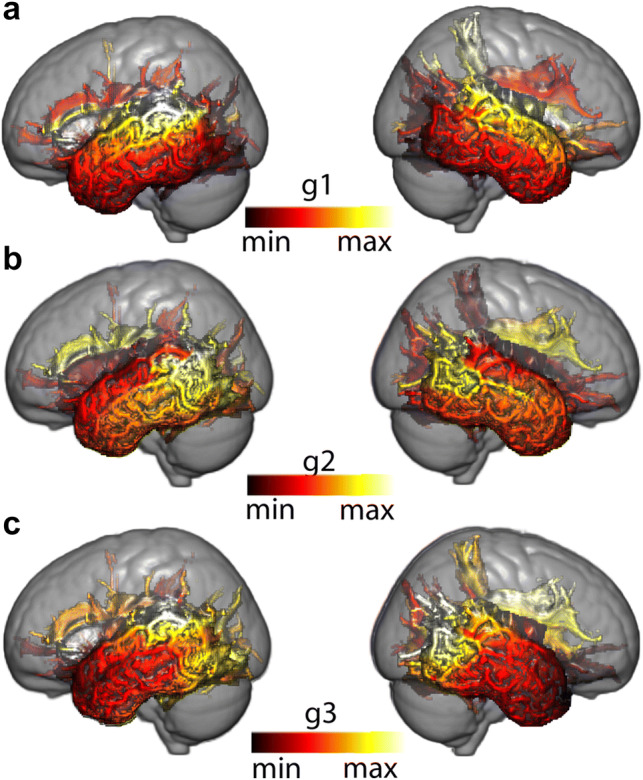
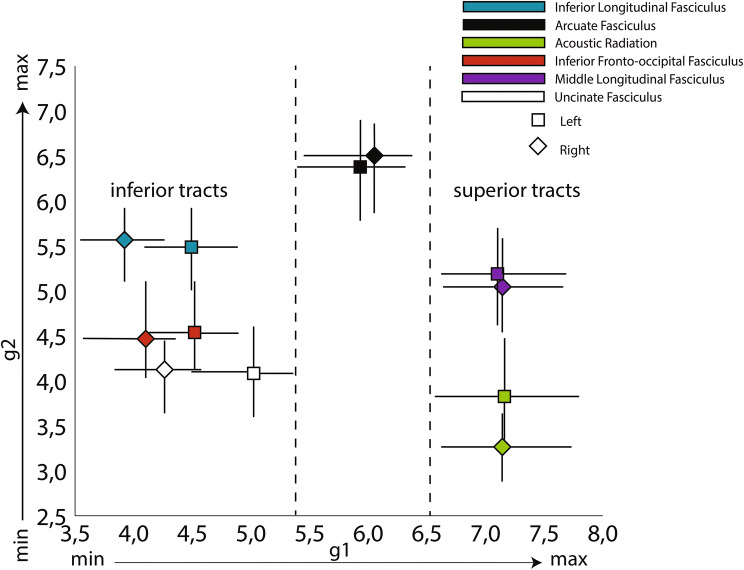
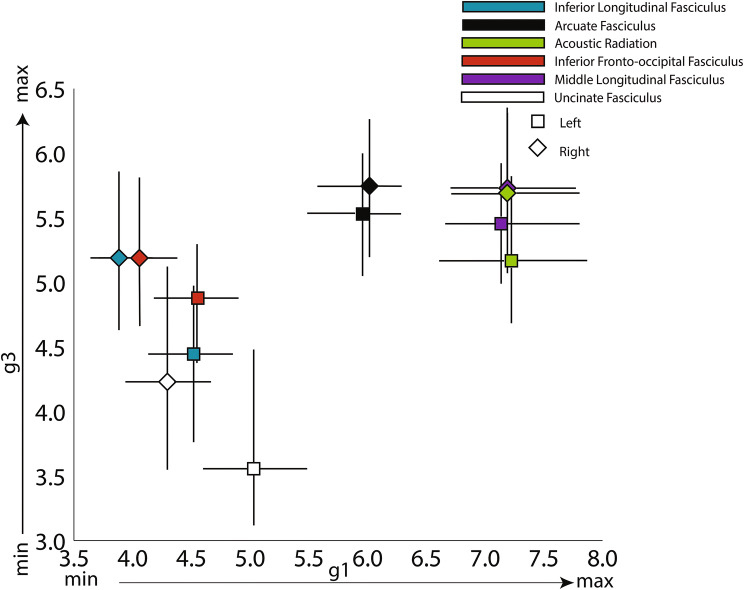
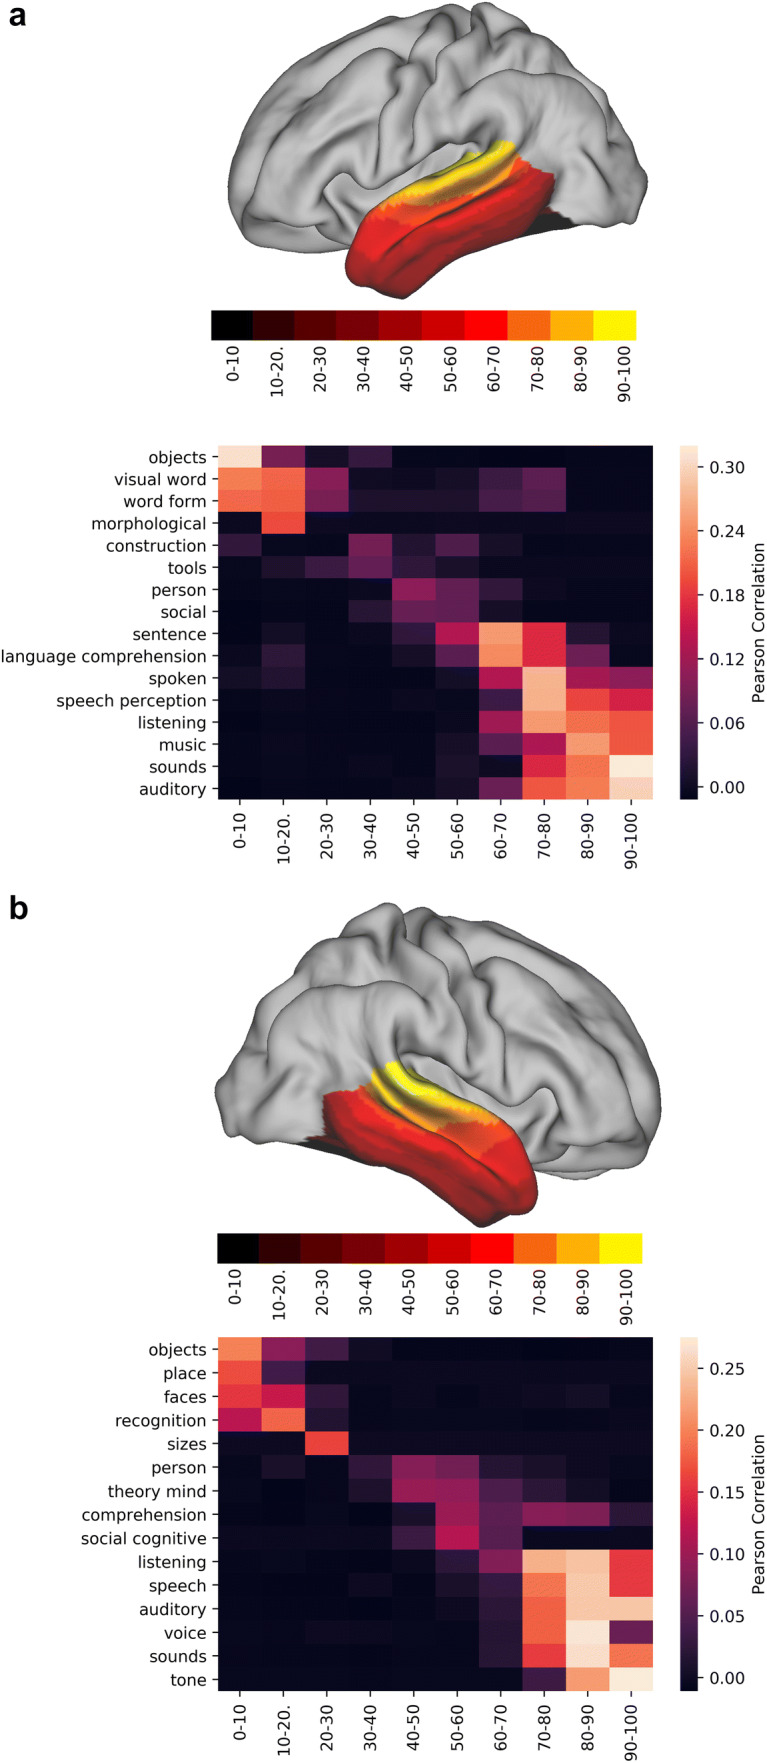
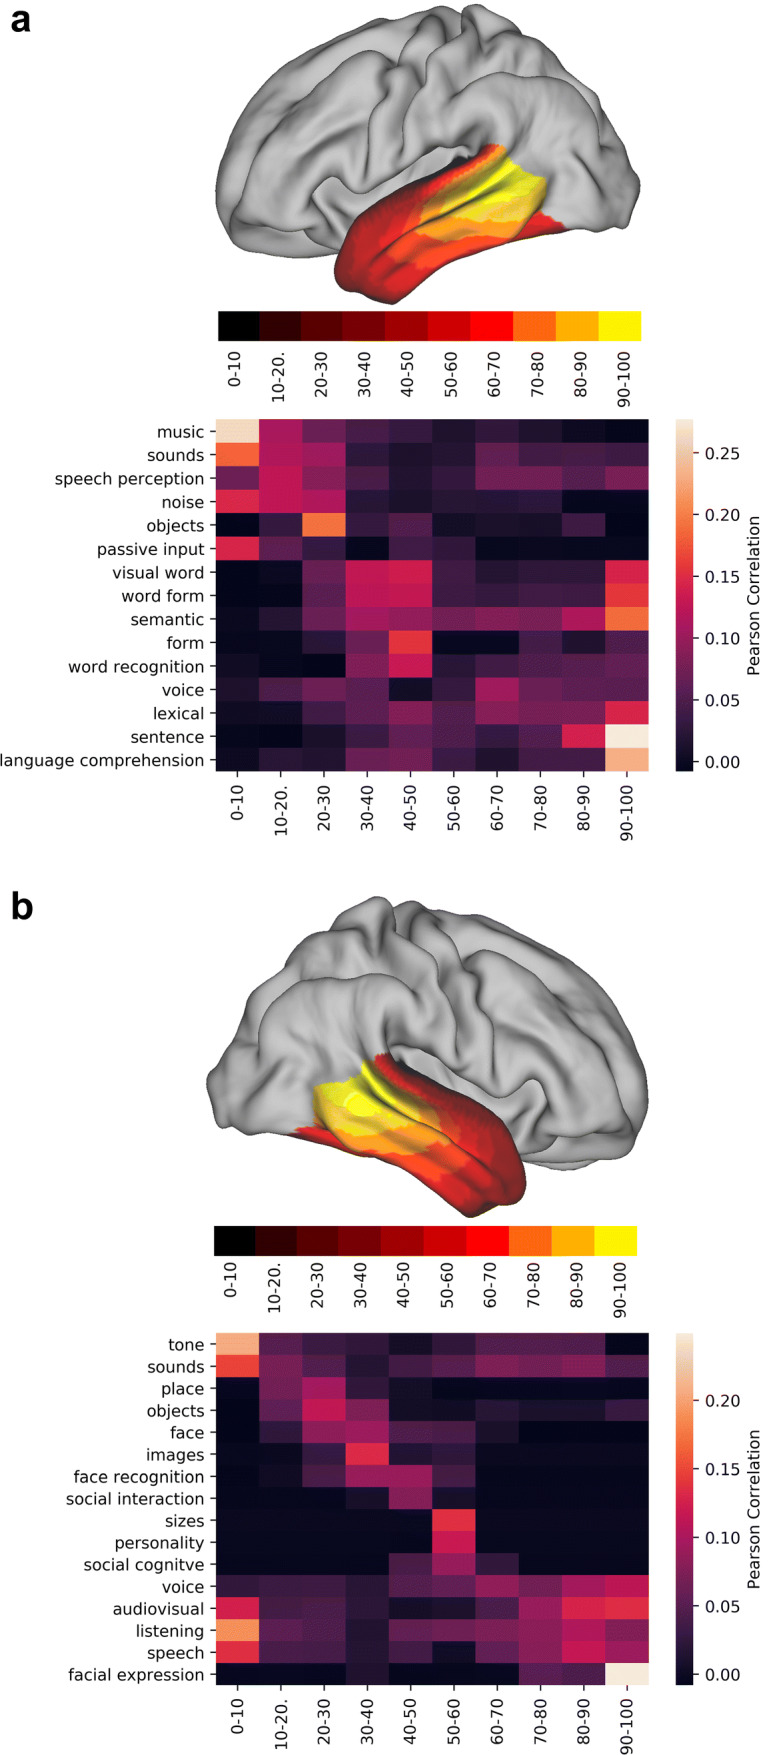
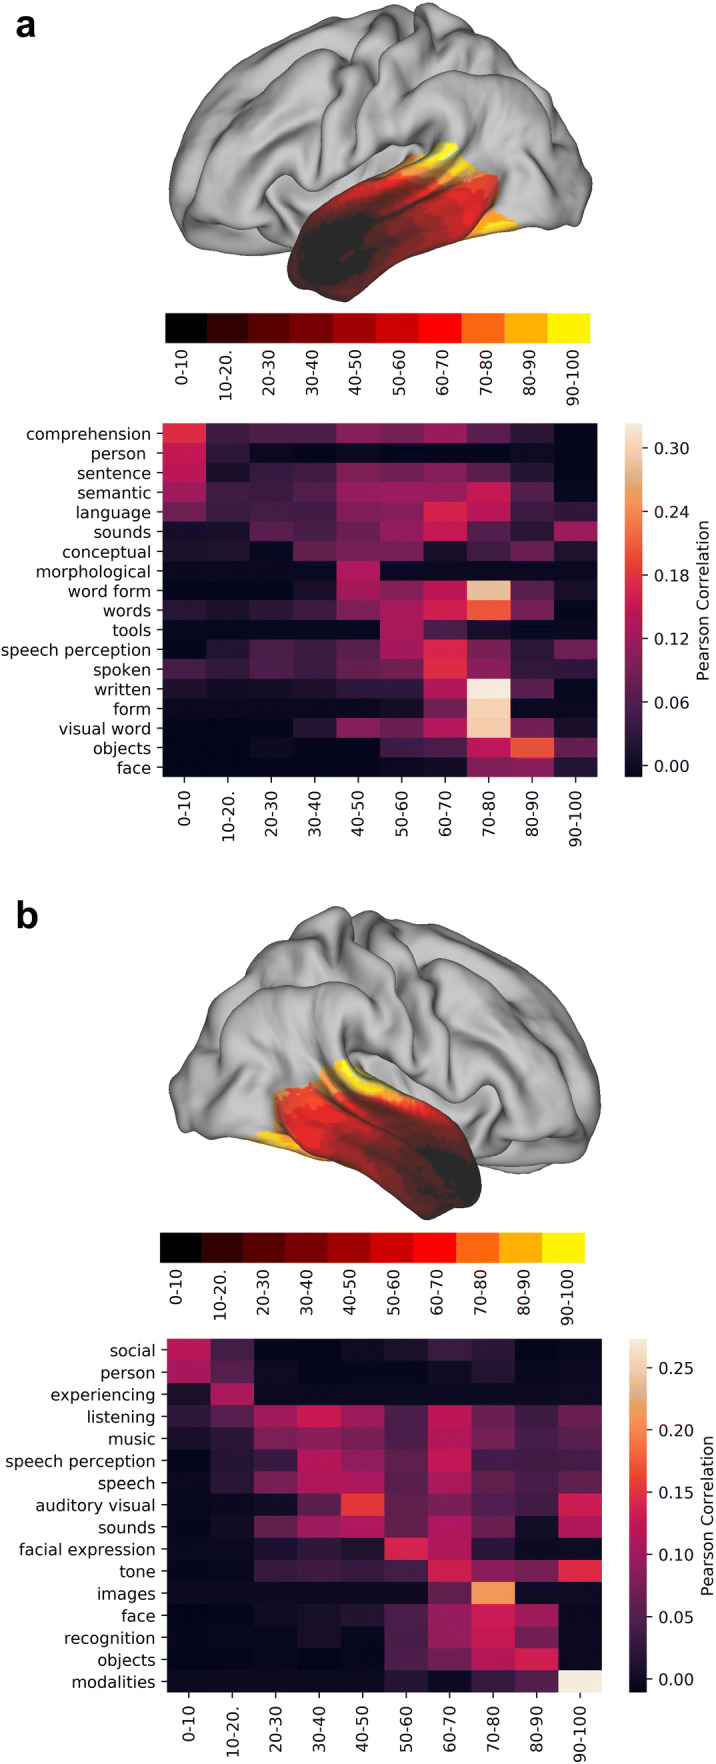
To establish the link between structure and function of any large area of the neocortex, it is helpful to identify its principles of organisation. One way to establish such principles is to investigate how differences in whole-brain connectivity are structured across the area. Here, we use Laplacian eigenmaps on diffusion MRI tractography data to investigate the organisational principles of the human temporal association cortex. We identify three overlapping gradients of connectivity that are, for the most part, consistent across hemispheres. The first gradient reveals an inferior-superior organisation of predominantly longitudinal tracts and separates visual and auditory unimodal and multimodal cortices. The second gradient radiates outward from the posterior middle temporal cortex with the arcuate fascicle as a distinguishing feature; the third gradient is concentrated in the anterior temporal lobe and emanates towards its posterior end. We describe the functional relevance of each of these gradients through the meta-analysis of data from the neuroimaging literature. Together, these results unravel the overlapping dimensions of structural organization of the human temporal cortex and provide a framework underlying its functional multiplicity.
Keywords: Connectivity gradients; Laplacian eigenmapping; Temporal lobe; Tractography.
Conflict of interest statement
The authors declare that they have no conflict of interest
Figures
Similar articles
-
Decoding the superior parietal lobule connections of the superior longitudinal fasciculus/arcuate fasciculus in the human brain.Neuroscience. 2014 Sep 26;277:577-83. doi: 10.1016/j.neuroscience.2014.07.035. Epub 2014 Jul 30. Neuroscience. 2014. PMID: 25086308
-
Mapping temporo-parietal and temporo-occipital cortico-cortical connections of the human middle longitudinal fascicle in subject-specific, probabilistic, and stereotaxic Talairach spaces.Brain Imaging Behav. 2017 Oct;11(5):1258-1277. doi: 10.1007/s11682-016-9589-3. Brain Imaging Behav. 2017. PMID: 27714552 Free PMC article.
-
Connectivity gradients on tractography data: Pipeline and example applications.Hum Brain Mapp. 2021 Dec 15;42(18):5827-5845. doi: 10.1002/hbm.25623. Epub 2021 Sep 24. Hum Brain Mapp. 2021. PMID: 34559432 Free PMC article.
-
Anatomical variability of the arcuate fasciculus: a systematical review.Surg Radiol Anat. 2019 Aug;41(8):889-900. doi: 10.1007/s00276-019-02244-5. Epub 2019 Apr 26. Surg Radiol Anat. 2019. PMID: 31028450
-
An emergent functional parcellation of the temporal cortex.Neuroimage. 2018 Apr 15;170:385-399. doi: 10.1016/j.neuroimage.2017.04.024. Epub 2017 Apr 15. Neuroimage. 2018. PMID: 28419851 Review.
Cited by
-
Conduct disorder symptomatology is associated with an altered functional connectome in a large national youth sample.Dev Psychopathol. 2022 Oct;34(4):1573-1584. doi: 10.1017/S0954579421000237. Epub 2021 Apr 14. Dev Psychopathol. 2022. PMID: 33851904 Free PMC article.
-
Hippocampal connectivity patterns echo macroscale cortical evolution in the primate brain.Nat Commun. 2024 Jul 16;15(1):5963. doi: 10.1038/s41467-024-49823-8. Nat Commun. 2024. PMID: 39013855 Free PMC article.
-
Gradients of Brain Organization: Smooth Sailing from Methods Development to User Community.Neuroinformatics. 2024 Oct;22(4):623-634. doi: 10.1007/s12021-024-09660-y. Epub 2024 Apr 3. Neuroinformatics. 2024. PMID: 38568476 Review.
-
Frontotemporal dementia: A unique window on the functional role of the temporal lobes.Handb Clin Neurol. 2022;187:429-448. doi: 10.1016/B978-0-12-823493-8.00011-0. Handb Clin Neurol. 2022. PMID: 35964986 Free PMC article. Review.
-
Correspondence of functional connectivity gradients across human isocortex, cerebellum, and hippocampus.Commun Biol. 2023 Apr 12;6(1):401. doi: 10.1038/s42003-023-04796-0. Commun Biol. 2023. PMID: 37046050 Free PMC article.
References
-
- Belkin M, Niyogi P. Laplacian eigenmaps for dimensionality reduction and data representation. Neural Comput. 2003;15:1373–1396. doi: 10.1162/089976603321780317. - DOI
MeSH terms
Grants and funding
- 024.001.006/Nederlandse Organisatie voor Wetenschappelijk Onderzoek
- MSCA-IF 844734/H2020 Marie Skłodowska-Curie Actions
- 016.veni.171.068/Nederlandse Organisatie voor Wetenschappelijk Onderzoek
- vidi 864-12-003/Nederlandse Organisatie voor Wetenschappelijk Onderzoek
- MSCA-IF 750026/H2020 Marie Skłodowska-Curie Actions
LinkOut - more resources
Full Text Sources
