. 2020 Oct;68(10):1968-1986.
doi: 10.1002/glia.23816. Epub 2020 Mar 11.

Toxoplasma infection induces microglia-neuron contact and the loss of perisomatic inhibitory synapses

Affiliations

Toxoplasma infection induces microglia-neuron contact and the loss of perisomatic inhibitory synapses

Gabriela L Carrillo et al. Glia. 2020 Oct.

Abstract

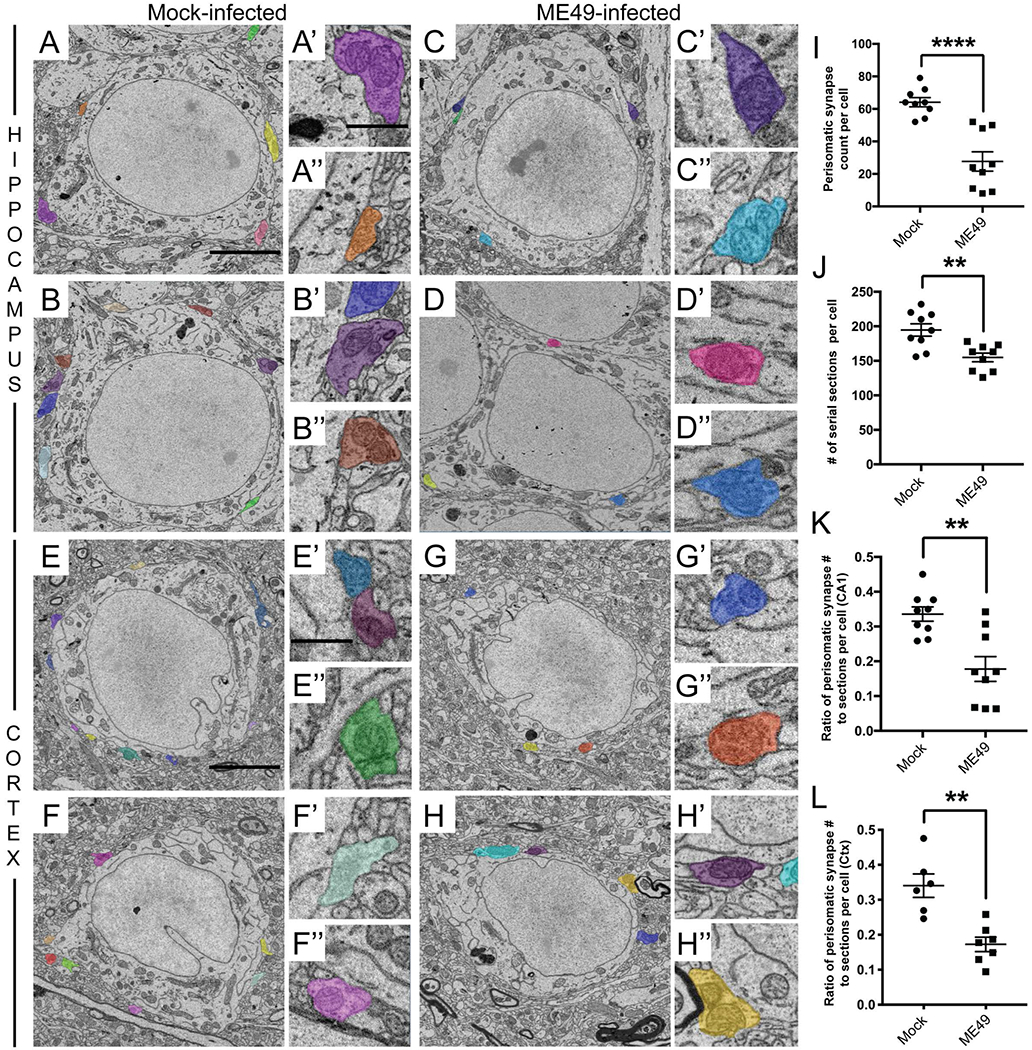
Infection and inflammation within the brain induces changes in neuronal connectivity and function. The intracellular protozoan parasite, Toxoplasma gondii, is one pathogen that infects the brain and can cause encephalitis and seizures. Persistent infection by this parasite is also associated with behavioral alterations and an increased risk for developing psychiatric illness, including schizophrenia. Current evidence from studies in humans and mouse models suggest that both seizures and schizophrenia result from a loss or dysfunction of inhibitory synapses. In line with this, we recently reported that persistent T. gondii infection alters the distribution of glutamic acid decarboxylase 67 (GAD67), an enzyme that catalyzes GABA synthesis in inhibitory synapses. These changes could reflect a redistribution of presynaptic machinery in inhibitory neurons or a loss of inhibitory nerve terminals. To directly assess the latter possibility, we employed serial block face scanning electron microscopy (SBFSEM) and quantified inhibitory perisomatic synapses in neocortex and hippocampus following parasitic infection. Not only did persistent infection lead to a significant loss of perisomatic synapses, it induced the ensheathment of neuronal somata by myeloid-derived cells. Immunohistochemical, genetic, and ultrastructural analyses revealed that these myeloid-derived cells included activated microglia. Finally, ultrastructural analysis identified myeloid-derived cells enveloping perisomatic nerve terminals, suggesting they may actively displace or phagocytose synaptic elements. Thus, these results suggest that activated microglia contribute to perisomatic inhibitory synapse loss following parasitic infection and offer a novel mechanism as to how persistent T. gondii infection may contribute to both seizures and psychiatric illness.

Keywords: Toxoplasma gondii; hippocampus; inhibitory synapse; microglia; neocortex; perisomatic synapse.


Conflict of interest statement

CONFLIST OF INTEREST STATEMENT

The authors have no conflicts of interest to report.

Figures

Figure 1.
Figure 1.. Disruption of inhibitory synapses in hippocampus and neocortex of Toxoplasma-infected mice.
A-D. GAD67-immunostaining of inhibitory synapses in mock- (A) and ME49- (C) infected hippocampi. Hippocampal regions CA1, CA3, and dentate gyrus (DG) are shown in A. ME49 infection induced a redistribution of GAD67-immunoreactivity, as can be seen in high magnification images of the CA1 region of hippocampus (B,D). Binarized, inverted images of GAD67-immunoreactivity in CA1 shows a concentration of inhibitory synapses in stratum pyramidalis (SP) of mock-infected tissue (B’). In contrast, this signal is redistributed out of SP in ME49-infected mice (D’). E-H. GAD67-immunostaining of inhibitory synapses in layer V of mock- (E) and ME49- (G) infected neocortex. High magnification images of layer V in mock-infected tissue (F) shows GAD67+ perisomatic synapses clustering around cell bodies (arrows). Fewer GAD67+ perisomatic synapses are present in ME49-infected layer V (H). F’,H’ show binarized, inverted images of GAD67-immunoreactivity in layer V of mock- and ME49-infected mice. I. Quantification of GAD67-immunoreactivity in SP (versus non-SP regions) of the CA1 region of hippocampus of mock and ME49-infected mice. Bars represent means +/− SEM. ** indicates p<0.01 by Students T-test (n=6 animals per condition). J,K. Quantification of the area of binarized, inverted GAD67-immunoreactivity in CA1 (J) and layer V of neocortex (K) of mock and ME49-infected mice. Bars represent means +/− SEM. * indicates p<0.05 and *** indicates p<0.001 by Students T-test (n=3 animals per condition). L-O. High magnification images of GAD67+ inhibitory terminals on NeuroTrace-labeled somas in layer V of mock- (L,M) and ME49- (N,O) neocortex. I’-L’ show binarized, inverted images of GAD67-immunoreactivity in mock- (L’,M’) and ME49- (N’,O’) neocortex. Arrows indicate GAD67+ perisomatic synapses. Arrowheads in L highlight two small, NeuroTrace-labeled cells contacting the soma of a pyramidal neuron. P. Quantification of the density of GAD67+ perisomatic nerve terminals along the surface of neuronal somata in mock, ME49 or Type III (CEP) Toxoplasma. Each data point represents one cell. In the case of the Type III (CEP) Toxoplasma red data points depict cells from animals with high cyst burden mice and gray data point depict cells from low cyst burden mice. Q. Average density of GAD67+ perisomatic nerve terminals along the surface of neuronal somata in mock, ME49 or Type III (CEP) Toxoplasma from data plotted in P. Bars represent means +/− SEM. **** indicates p<0.0001 by Students T-test (n=4–5 animals per condition). Scale bar in A = 500 μm for A,C; in B = 100 μm for B,B’,D,D’; in E = 200 μm for E,G; in F = 50 μm for F,F’,H,H’; in L = 10 μm for L-O; L’-O’.
Figure 2.
Figure 2.. Serial block face scanning electron microscopic (SBFSEM) analysis of mock- and ME49-infected brain tissue.
A, B. Low magnification SBFSEM images of cerebral cortex of mock- (A) and ME49- (B) infected mice. Cortical layers IV, V, and VI are labeled. Arrows highlight layer V pyramidal neurons. Arrowhead in B highlights a Toxoplasma gondii cyst. BV – blood vessels. Scale bar in A = 50 μm for A,B. C. High magnification montage of 3 adjacent SBFSEM datasets. Each dataset consists of ~500 serial 50 μm x 50 μm micrographs, each 60 nm thick. In these micrographs, neurons are pseudocolored yellow, myeloid-derived cells / microglia are red, and a Toxoplasma gondii cyst is pseudocolored blue.
Figure 3.
Figure 3.. Toxoplasma infection leads to a loss of perisomatic synapses in hippocampus and layer V of neocortex.
A-D. SBFSEM micrographs of neurons in stratum pyramidalis of the CA1 region of hippocampus of mock- (A,B) and ME49- (C,D) infected mice. Perisomatic nerve terminals are pseudocolored and shown in the insets in A’-D’ and A”-D”. Scale bar in A = 7 μm for A-D and in A’ = 850 nm for A’-D’ and A”-D”. E-H. SBFSEM micrographs of neurons in layer V of the neocortex of mock- (E,F) and ME49- (G,H) infected mice. Perisomatic nerve terminals are pseudocolored and shown in the insets in E’-H’ and E”-H”. Scale bar in E = 5 μm for E-H and in E’ = 150 nm for E’-H’ and E”-H”. I. Quantification of perisomatic nerve terminals on entire neuronal somata in stratum pyramidalis of the hippocampus of mock- and ME49- infected mice. Each data point represents the total perisomatic synapses on one cell. Lines represent means +/− SEM. **** indicates p<0.0001 by Student’s t-test (n= 9 total cells; 3 cells from 3 animals per condition). J. Quantification of cell thickness in stratum pyramidalis of mock- and ME49- infected hippocampi. Each data point represents the number of serial sections per cell. Lines represent means +/− SEM. ** indicates p<0.01 by Student’s t-test (n= 9 total cells; 3 cells from 3 animals per condition). K. Despite reduced neuronal thickness in ME49-infected tissue, the ratio of perisomatic nerve terminal number to soma thickness is significantly reduced in parasite infected hippocampi. Each data point represents the ratio of perisomatic synapses to somata thickness per cell. Lines represent means +/− SEM. ** indicates p<0.01 by Student’s t-test (n= 9 total cells; 3 cells from 3 animals per condition). L. The ratio of perisomatic nerve terminal number to soma thickness is significantly reduced in layer V of ME49-infected neocortex. Each data point represents the ratio of perisomatic synapses to somata thickness per cell. Lines represent means +/− SEM. ** indicates p<0.01 by Student’s t-test (n=7 total cells from 3 animals per condition).
Figure 4.
Figure 4.. Myeloid-derived cells ensheath neuronal somata in Toxoplasma-infected neocortex.
A. Twelve SBFSEM micrographs through the same pyramidal neuron (pseudocolored yellow) in layer V of ME49-infected neocortex. The three myeloid-derived cells ensheathing this neuron are pseudocolored blue, green, and red. Scale bar = 2.5 μm for all panels.
Figure 5.
Figure 5.. Widespread ensheathment of cells by microglia in the hippocampus and neocortex of Toxoplasma-infected mice.
A,B. Confocal images of immunolabeling of myeloid-derived cells with antibodies against Iba1 and labeling of nuclei with DAPI in mock- (A) and ME49- (B) infected CA1 of hippocampus. SP denotes stratum pyramidalis. Arrows highlight cells ensheathed by Iba1+ cells. C,D. Iba1-immunolabeling and cell labeling with NeuroTrace in mock- (C) and ME49-(D) infected CA1 of hippocampus. Arrows highlight cells ensheathed by Iba1+ cells in ME49-infected tissue. E,F. Genetic labeling of microglia in mock- (E) and ME49- (F) infected CA1 of Cx3cr1-GFP mice. Arrows highlight cells ensheathed by GFP+ myeloid-derived cells / microglia in ME49-infected tissue. G,H. Immunolabeling of myeloid-derived cells with antibodies against Iba1 and labeling of nuclei with DAPI in mock- (G) and ME49- (H) infected layer V of neocortex. Arrows highlight cells ensheathed by Iba1+ cells. I,J. Iba1-immunolabeling and cell labeling with NeuroTrace in mock- (I) and ME49- (J) infected layer V of neocortex. Arrows highlight cells ensheathed by Iba1+ cells in ME49-infected tissue. K,L. Genetic labeling of myeloid-derived cells / microglia in mock- (K) and ME49- (L) infected neocortex of Cx3cr1-GFP mice. Arrows highlight cells ensheathed by GFP+ cells in ME49-infected tissue. M,N. Quantification of the number of DAPI+ cell somas ensheathed by Iba1+ cells in stratum pyramidalis of CA1 (M) or layer V of neocortex (N). Lines represent means +/− SEM. ** indicates p<0.01 and **** indicates p<0.0001 by Student’s t-test (n=4 animals per condition). O,P. Quantification of the number of DAPI+ cell somas ensheathed by GFP+ cells in stratum pyramidalis of CA1 (O) or layer V of neocortex (P). Lines represent means +/− SEM. ** indicates p<0.01 by Student’s t-test (n=3 animals per condition). Q,R. GFP+ cells ensheath neuronal somas (labeled with NeuroTrace) in ME49-infected tissue. S. Quantification of the percent soma surface area of NeuroTrace+ cells (arrows) ensheathed by GFP+ cells in layer V of neocortex of mock or ME49-infected Cx3cr1-GFP mice. (Q,R). Lines represent means +/− SEM. ** indicates p<0.01 by Student’s t-test (n=3 animals per condition). T,T’. Individual NeuroTrace+/GFP- cells from mock (T) or ME49-infected (T’) Cx3cr1-GFP mice (from data in S) plotted based on percent somal surface area covered by GFP+ cells versus number of GAD67+ perisomatic synapses. Scale bar in A = 50 μm for A-L, in Q = 10 μm for Q,R.
Figure 6.
Figure 6.. Microglia ensheath both excitatory and inhibitory neurons in parasite-infected hippocampus and neocortex.
A-D. In situ hybridization for Syt1 mRNA and Gad1 mRNA to label excitatory and inhibitory neurons, respectively, in CA1 of mock- or ME49-infected Cx3cr1-GFP mice. Arrows highlight Syt1+ and Gad1+ cells ensheathed by GFP+ microglia. E-H. In situ hybridization for Syt1 mRNA and Gad1 mRNA to label excitatory and inhibitory neurons, respectively, in cortical layer V of mock- or ME49-infected Cx3cr1-GFP mice. Arrows highlight Syt1+ and Gad1+ cells ensheathed by GFP+ microglia. Scale bar in A = 50 μm for all panels.
Figure 7.
Figure 7.. Perisomatic synapses are ensheathed by microglia in Toxoplasma-infected brain tissue.
A-C. Examples of 3 perisomatic nerve terminals (in blue) ensheathed by microglia (in red) on a neocortical neuron (yellow). 5 micrographs shown for each example from this SBFSEM dataset. Black arrowheads indicate electron dense lysosomes. Scale bar in A = 1 μm for all panels.
Figure 8.
Figure 8.. Phagocytic microglia ensheath neurons in Toxoplasma-infected brain tissue.
A,B. SBFSEM micrographs show lysosomes/phagosomes within the microglial ensheathing neuronal cell somas in ME49-infected hippocampus (A) and cortex (B). Electron dense lysosomes highlighted by red arrowheads. Neuronal somas pseudocolored in yellow. Microglia pseudocolored in green and red. C-J. Immunolabeling for CD68 in stratum pyramidalis (SP) of CA1 (Hp) and layer V of neocortex (Ctx) in mock- or ME49-infected Cx3cr1-GFP mice. Maximum projection confocal images shown. Arrows highlight microglia with elevated levels of CD68, a marker of lysosomal activity and phagocytosis, in ME49-infected cortex and hippocampus. K. Confocal image showing Iba1+ cells that ensheath neuronal somata contain GAD67+ puncta in ME49-infected neocortex. L-L”, M-M”. High magnification consecutive single optical sections (from K) highlighting GAD67+ puncta (arrows) within the Iba1+ cells. Scale bar in A = 1 μm; in B = 1.25 μm; in C = 50 μm for C-J; in K = 10 μm; in L = 2 μm for L-L”, M-M”.

References

    1. Alsaady I, Tedford E, Alsaad M, Bristow G, Kohli S, Murray M, Reeves M, Vijayabaskar MS, Clapcote SJ, Wastling J, et al. (2019). Downregulation of the Central Noradrenergic System by Toxoplasma gondii Infection. Infect Immun 87. - PMC - PubMed
    1. Baraban SC, Southwell DG, Estrada RC, Jones DL, Sebe JY, Alfaro-Cervello C, Garcia-Verdugo JM, Rubenstein JL, and Alvarez-Buylla A (2009). Reduction of seizures by transplantation of cortical GABAergic interneuron precursors into Kv1.1 mutant mice. Proc Natl Acad Sci U S A 106, 15472–15477. - PMC - PubMed
    1. Bartos M, Vida I, Frotscher M, Meyer A, Monyer H, Geiger JR, and Jonas P (2002). Fast synaptic inhibition promotes synchronized gamma oscillations in hippocampal interneuron networks. Proc Natl Acad Sci U S A 99, 13222–13227. - PMC - PubMed
    1. Belforte JE, Zsiros V, Sklar ER, Jiang Z, Yu G, Li Y, Quinlan EM, and Nakazawa K (2010). Postnatal NMDA receptor ablation in corticolimbic interneurons confers schizophrenia-like phenotypes. Nat Neurosci 13, 76–83. - PMC - PubMed
    1. Berdoy M, Webster JP, and Macdonald DW (2000). Fatal attraction in rats infected with Toxoplasma gondii. Proc Biol Sci 267, 1591–1594. - PMC - PubMed

Publication types