

TMEM135 regulates primary ciliogenesis through modulation of intracellular cholesterol distribution
- PMID: 32157776
- PMCID: PMC7202201
- DOI: 10.15252/embr.201948901
TMEM135 regulates primary ciliogenesis through modulation of intracellular cholesterol distribution
Abstract
Recent evidence has linked the lysosomal cholesterol accumulation in Niemann-Pick type C1 with anomalies associated with primary ciliogenesis. Here, we report that perturbed intracellular cholesterol distribution imposed by lysosomal cholesterol accumulation during TMEM135 depletion is closely associated with impaired ciliogenesis. TMEM135 depletion does not affect the formation of the basal body and the ciliary transition zone. TMEM135 depletion severely blunts Rab8 trafficking to the centrioles without affecting the centriolar localization of Rab11 and Rabin8, the upstream regulators of Rab8 activation. Although TMEM135 depletion prevents enhanced IFT20 localization at the centrioles, ciliary vesicle formation is not affected. Furthermore, enhanced IFT20 localization at the centrioles is dependent on Rab8 activation. Supplementation of cholesterol in complex with cyclodextrin rescues Rab8 trafficking to the centrioles and Rab8 activation, thereby recovering primary ciliogenesis in TMEM135-depleted cells. Taken together, our data suggest that TMEM135 depletion prevents ciliary vesicle elongation, a characteristic of impaired Rab8 function. Our study thus reveals a previously uncharacterized effect of erroneous intracellular cholesterol distribution on impairing Rab8 function and primary ciliogenesis.
Keywords: IFT20; Rab8; TMEM135; intracellular cholesterol transport; peroxisome; primary cilia.
© 2020 The Authors. Published under the terms of the CC BY 4.0 license.
Conflict of interest statement
The authors declare that they have no conflict of interest.
Figures
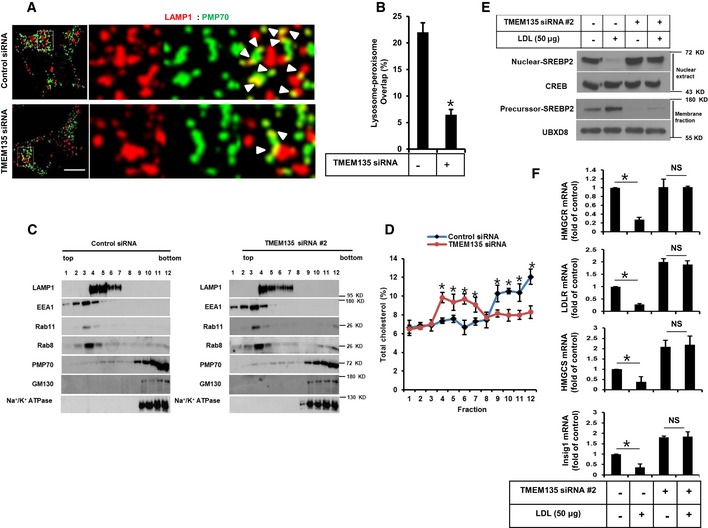
RPE1 cells were transfected with either scramble or TMEM135 siRNAs and immunostained for LAMP1 as a lysosome marker (red) and PMP70 as a peroxisome marker (green). Scale bar, 10 μm.
Quantification of overlap signal between lysosomes and peroxisomes shown in (A). Data represent mean ± SD (n = 3 experiments), and 50 cells were scored per condition per experiment. *P < 0.05, Student's t‐test.
Subcellular fractions of a discontinuous sucrose gradient collected from top to bottom, separated by SDS–PAGE, and immunoblotted for LAMP1, EEA1, Rab11, Rab8, PMP70, GM130, and Na+/K+ ATPase.
Quantification of total cholesterol in the subcellular fractions shown in (C). Data represent mean ± SD (n = 3 experiments), *P < 0.05, Student's t‐test.
Cells transfected with TMEM135 siRNA were subjected to a SREBP2 cleavage assay for the precursor of SREBP2 and nuclear SREBP2.
Cells transfected with TMEM135 siRNA were subjected to qPCR. Data represent mean ± SD (n = 3 experiments); *P < 0.05, Student's t‐test.
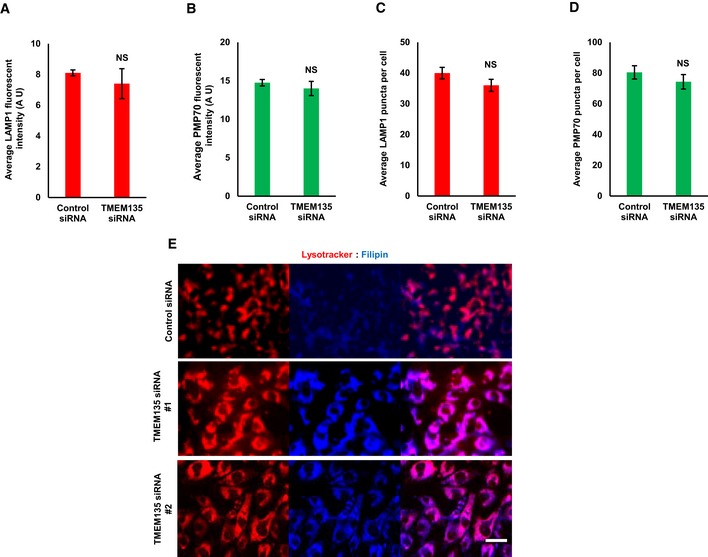
- A–D
RPE1 cells were transfected with either scramble or TMEM135 siRNAs and immunostained for LAMP1 as a lysosome marker (red) and PMP70 as a peroxisome marker (green). (A, B) Fluorescent intensity of lysosome and peroxisome, respectively, within an area of cell was separately measured by ImageJ software. A. U means arbitrary unit. Data represent mean ± SD (n = 3 experiments), and 50 cells were scored per condition per experiment. NS, not significant; P > 0.05, Student's t‐test. (C, D) Lysosome and peroxisome puncta were determined within an area of cell. Data represent mean ± SD (n = 3 experiments), and 50 cells were scored per condition per experiment. NS, not significant; P > 0.05, Student's t‐test.
- E
RPE1 cells were transfected with siRNAs, followed by sequential staining with lysotracker (red) and filipin (blue). Scale bar, 20 μm.
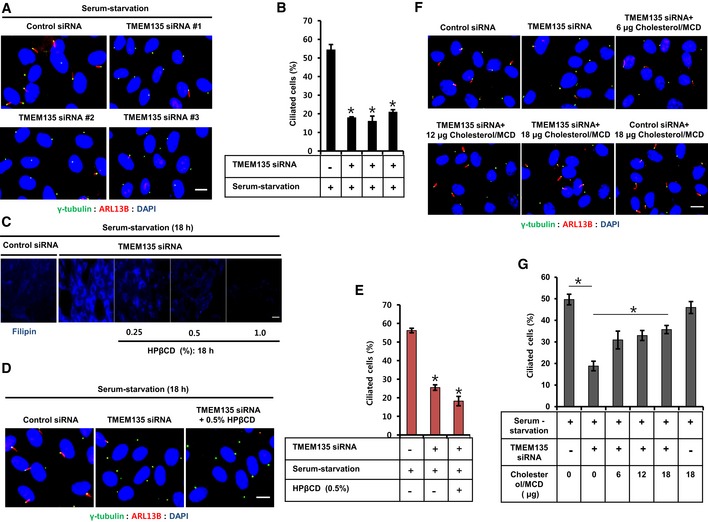
RPE1 cells were transfected with siRNAs as indicated, followed by serum starvation for 24 h, and immunostained for ARL13B (red) and γ‐tubulin (green). Scale bar, 10 μm.
Quantification of the percentage of ciliated cells shown in (A). Data represent mean ± SD (n = 3 experiments), and 250 cells were scored per condition per experiment; *P < 0.05, Student's t‐test.
Cells were transfected with siRNAs as indicated and incubated with HPβCD in serum‐starvation media followed by filipin staining. Scale bar, 20 μm.
Cells were transfected with siRNAs shown in (C) and immunostained for ARL13B (red) and γ‐tubulin (green). Scale bar, 10 μm.
Quantification of the percentage of ciliated cells shown in (D). Data represent mean ± SD (n = 3 experiments), and 250 cells were scored per condition per experiment; *P < 0.05, Student's t‐test.
Cells were transfected with siRNAs as indicated, incubated with cholesterol–MβCD complex in serum‐starvation media, and immunostained for ARL13B (red) and γ‐tubulin (green). Scale bar, 10 μm.
Quantification of the percentage of ciliated cells shown in (F). Data represent mean ± SD (n = 3 experiments), and 250 cells were scored per condition per experiment, *P < 0.05, Student's t‐test.
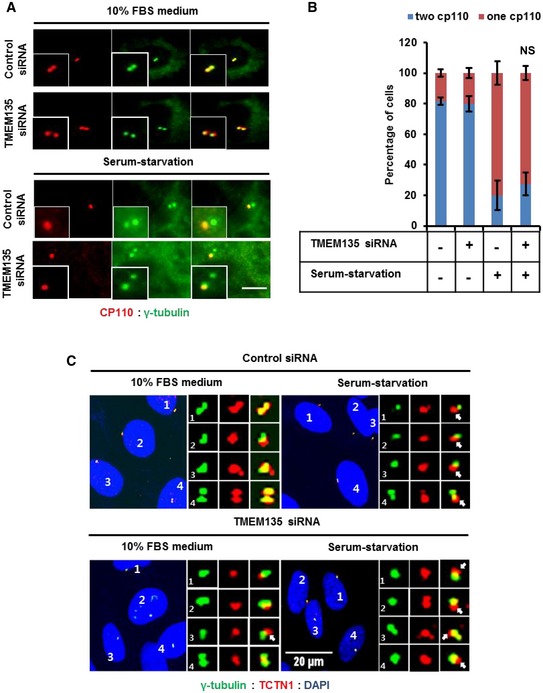
RPE1 cells were transfected with siRNAs as indicated and immunostained with antibodies against CP110 (red) and γ‐tubulin (green). Scale bar, 10 μm.
Quantification of percentage of cells with one or two CP110. Data represent mean ± SD (n = 3 experiments), and 200 cells were scored per condition per experiment. NS, not significant; P > 0.05, Student's t‐test.
Cells were transfected with siRNAs as indicated and immunostained with antibodies against TCTN1 (red) and γ‐tubulin (green). Scale bar, 20 μm.
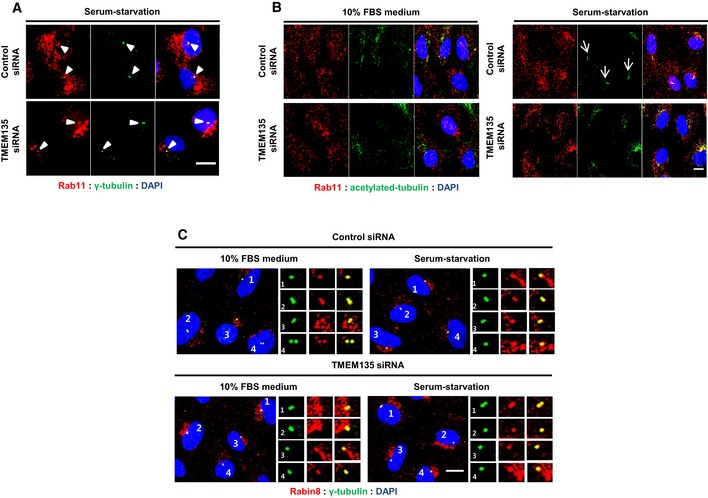
RPE1 cells were transfected with siRNAs as indicated and immunostained with antibodies against Rab11 (red) and γ‐tubulin (green). Scale bar, 10 μm. Arrowheads showing Rab11 localized to centrioles.
Cells were transfected with siRNAs as indicated and immunostained with antibodies against Rab11 (red) and acetylated tubulin (green). Scale bar, 10 μm. Arrows showing primary cilium in the serum‐starved control cells.
RPE1 cells were transfected by siRNAs as indicated and immunostained with antibodies against Rabin8 (red) and γ‐tubulin (green). Scale bar, 10 μm.
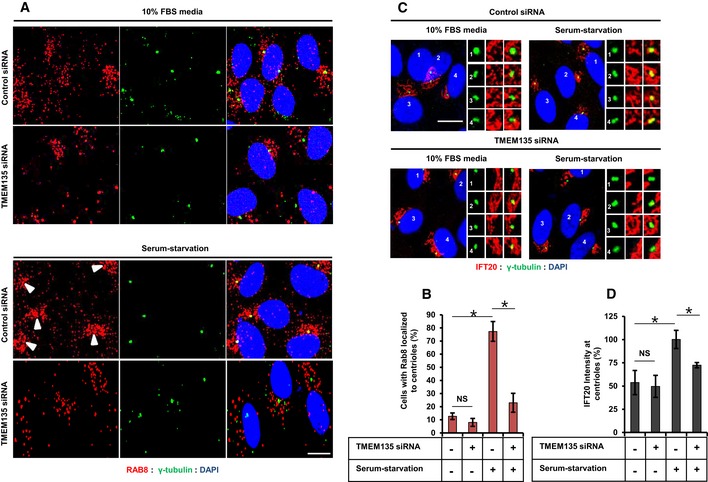
RPE1 cells were transfected with siRNA as indicated, and immunostained for Rab8 (red) and γ‐tubulin (green) in either 10% FBS medium (upper panel) or serum‐starvation medium (lower panel). Scale bar, 10 μm. Arrowhead indicates Rab8 localized to the centrioles.
Quantification of the percentage of cells with Rab8 localized to the centriole shown in (A). Data represent mean ± SD (n = 3 experiments), and 200 cells were scored per condition per experiment; *P < 0.05, Student's t‐test.
Cells were transfected with siRNA shown in (A) and immunostained for IFT20 (red) and γ‐tubulin (green). Scale bar, 10 μm.
Quantification of the percentage of IFT20 intensity at the centrioles in (c). Data represent mean ± SD (n = 3 experiments), and 150 cells were scored per condition per experiment; *P < 0.05, Student's t‐test.
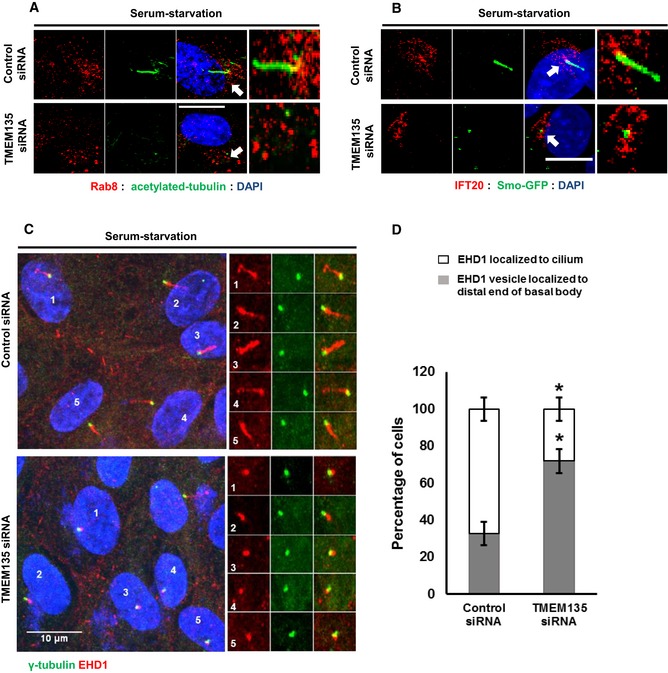
RPE1 cells were transfected with siRNAs as indicated and immunostained with antibodies against Rab8 (red) and acetylated tubulin (green). Scale bar, 10 μm. Arrow showing Rab8 accumulation near the base of the primary cilium in control cells.
SMO‐GFP RPE1 cells were transfected with siRNAs as indicated and immunostained with antibodies against IFT20. Representative confocal images of IFT20 (red) and SMO (green) are shown. Scale bar, 10 μm. Arrow showing the centriolar IFT20 localized at the base of the primary cilium or ciliary vesicle in control and TMEM135‐depleted cells, respectively.
Cells were transfected with siRNAs as indicated and immunostained with antibodies against EHD1 (red) and γ‐tubulin (green). Scale bar, 10 μm.
Quantification of the percentage of cells with EHD1 localized in cilium or at distal end of the basal body (ciliary vesicle). Data represent mean ± SD (n = 3 experiments), and 200 cells were scored per condition per experiment, *P < 0.05, Student's t‐test.
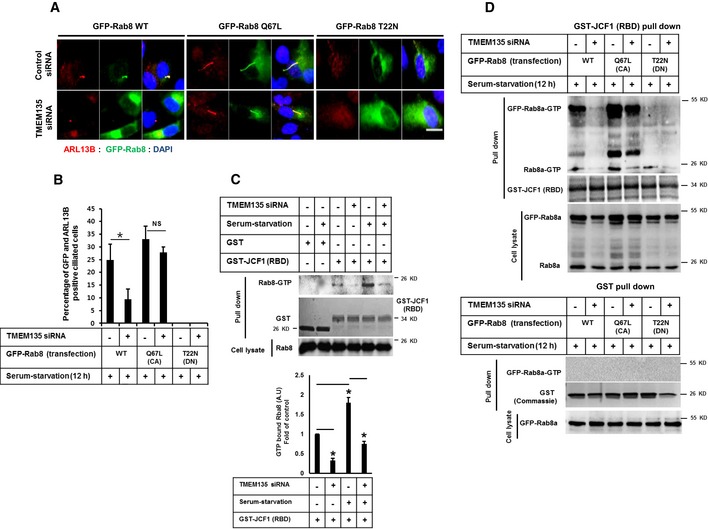
RPE1 cells were transfected with siRNAs as indicated, followed by transfection with wild‐type pGFP‐Rab8a (WT‐Rab8), constitutively active pGFP‐Rab8a (Q67L) (CA‐Rab8), or DN Rab8 dominant‐negative pGFP Rab8a (T22N), incubated in serum‐starved media for 12 h, and immunostained for ARL13B (red), GFP‐Rab8 (green), and DAPI (blue). Scale bar, 10 μm.
Quantification of the percentage of ciliated cells shown in (A). Data represent mean ± SD (n = 3 experiments), and 200 GFP‐positive cells were scored per condition per experiment; *P < 0.05, Student's t‐test.
(Upper panel) Cells were transfected as indicated and the cell lysates were incubated with purified proteins, including GST or GST‐JCF1 (RBD). The amount of GTP‐Rab8 bound to GFT‐JCF1(RBD) was analyzed by Western blot with Rab8 antibody. (Lower panel) Intensity of the bands was quantified by ImageJ software. The amount of GTP‐Rab8 was normalized to the control level. Bar graph represents mean ± SD (n = 3 experiments). *P < 0.05, Student's t‐test.
Cells were transfected as shown in (A), and cell lysates were incubated with purified GST‐JCF1 (RBD) fusion protein. The amount of GTP‐Rab8 bound to GFT‐JCF1(RBD) was analyzed by Western blot with Rab8 antibody. (Lower panel) Cells were transfected as shown in (A), and cell lysates were incubated with purified GST protein. The amount of GTP‐Rab8 bound to GFT‐JCF1(RBD) was analyzed by Western blot with Rab8 antibody.
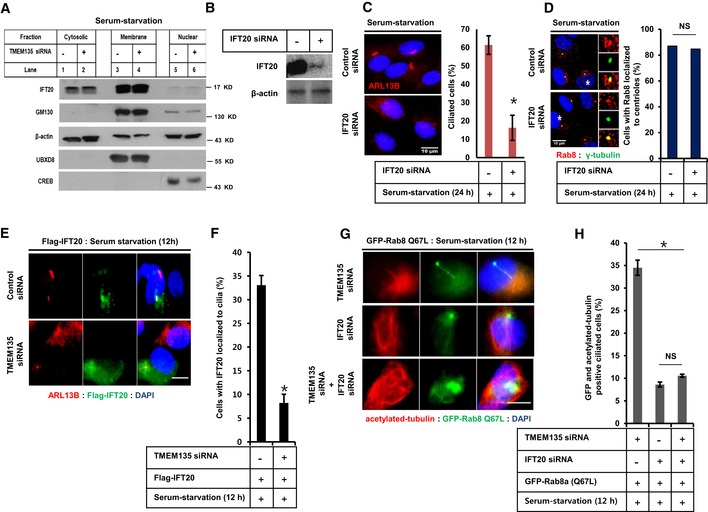
RPE1 cells were transfected with siRNAs as indicated, followed by 24‐h incubation in serum‐starved media. Cells were then and subjected to fractionation, and Western blot for IFT20, the Golgi marker GM130, membrane marker UBXD8, and nuclear marker CREB.
Efficiency of IFT20 knockdown by Western blot.
Cells were transfected with siRNAs as indicated, followed by incubation in serum‐starved media for 24 h, and immunostained for ARL13B (red). Scale bar, 10 μm. The bar graph represents the quantification of the percentage of ciliated cells. Data represent mean ± SD (n = 3 experiments), and 250 cells were scored per condition per experiment; *P < 0.05, Student's t‐test.
Cells were transfected as shown in (C), and immunostained for Rab8 and γ‐tubulin, followed by quantification of the percentage of cells with Rab8 localized to the centriole. Data represent average (n = 2 experiments).
Cells were transfected with siRNAs as indicated, followed by transfection with Flag‐IFT20, incubated in serum‐starvation media for 12 h, and immunostained for ARL13B. Representative fluorescent images of Flag‐IFT20 (green), ARL13B (red), and DAPI (blue) are shown. Scale bar, 10 μm.
Quantification of the percentage of ciliated cells with both the Flag‐IFT20 and ARL13B localized in the cilium. Data represent mean ± SD (n = 3 experiments), and 150 Flag‐positive cells were scored per condition per experiment; *P < 0.05, Student's t‐test.
Cells were transfected with siRNAs as indicated, followed by further transfection with CA‐Rab8, incubated in serum‐starvation media for 12 h, and immunostained for acetylated tubulin. Representative fluorescent images of GFP‐Rab8 Q67L (green), acetylated tubulin (red), and DNA (blue) are shown. Scale bar, 10 μm.
Quantification of the percentage of GFP‐positive ciliated cells (only those cilia having both GFP‐Rab8 and acetylated tubulin on cilium were considered for quantification). Data represent mean ± SD (n = 3 experiments), and 200 GFP‐positive cells were scored per condition per experiment, *P < 0.05, Student's t‐test.
- A
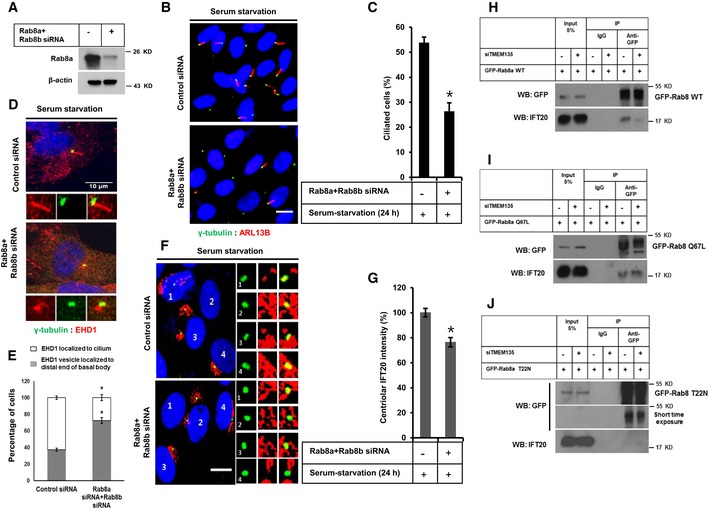
Efficiency of Rab8a depletion confirmed by Western blot in RPE1 cells.
- B
RPE1 cells were transfected by siRNAs as indicated, followed by incubation in serum‐starvation media for 24 h, and immunostained for ARL13B (red) and γ‐tubulin (green). Scale bar, 10 μm.
- C
Quantification of the percentage of ciliated cells shown in (B). Data represent mean ± SD (n = 3 experiments), and 250 GFP‐positive cells were scored per condition per experiment; *P < 0.05, Student's t‐test.
- D
Cells were transfected by siRNA as indicated followed by incubation in serum‐starvation media for 24 h, and immunostained for EHD1 (red) and γ‐tubulin (green). Scale bar, 10 μm.
- E
Quantification of the percentage of cells with EHD1 in cilium or in the distal end of basal body as shown in (D). Data represent mean ± SD (n = 3 experiments), and 150 cells were scored per condition per experiment; *P < 0.05, Student's t‐test.
- F
Cells were transfected by siRNAs as indicated, followed by incubation in serum‐starvation media for 24 h, and immunostained for IFT20 (red) and γ‐tubulin (green). Scale bar, 10 μm.
- G
Quantification of the percentage of IFT20 fluorescent intensity at the centriole shown in (F). Data represent mean ± SD (n = 3 experiments), and 150 were scored per condition per experiment; *P < 0.05, Student's t‐test.
- H–J
Cells were transfected by siRNAs as indicated, followed by transfection with GFP‐Rab8 WT, GFP‐Rab8 Q67L, or GFP‐Rab8 T22N, and further incubated in serum‐starvation media for 12 h. Cell lysate was subjected to immunoprecipitation with anti‐GFP antibody, followed by Western blot with antibody against GFP.
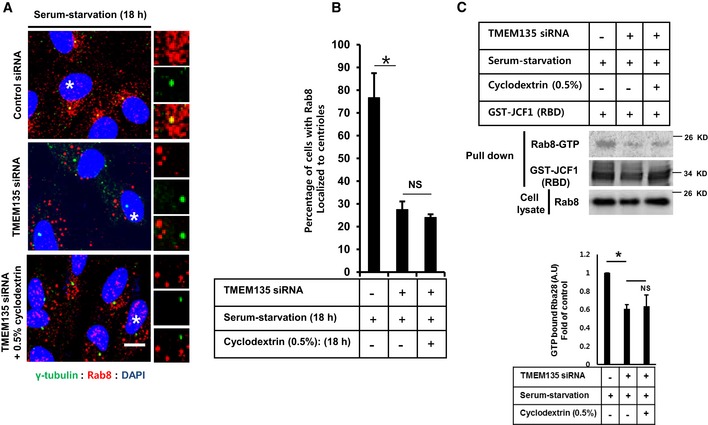
RPE1 cells were transfected with siRNAs as indicated and immunostained with antibodies against Rab8 (red) and γ‐tubulin (green). Scale bar, 10 μm. Representative magnified images are shown from cells labeled with white asterisks.
Quantification of the percentage of cells with Rab8 localized at the centrioles. Data represent mean ± SD (n = 3 experiments), and 200 cells were scored per condition per experiment; *P < 0.05, Student's t‐test.
(Upper panel) Cells were transfected as indicated, and cell lysate was incubated with purified GST‐JCF1 (RBD) fusion protein. The amount of GTP‐Rab8 bound to GFT‐JCF1(RBD) was analyzed by Western blotting with Rab8 antibody. (Lower panel) The intensity of bands was quantified by ImageJ software. The amount of GTP‐Rab8 was normalized to the control level. The bar graph represents mean ± SD (n = 3 experiments). *P < 0.05, Student's t‐test.
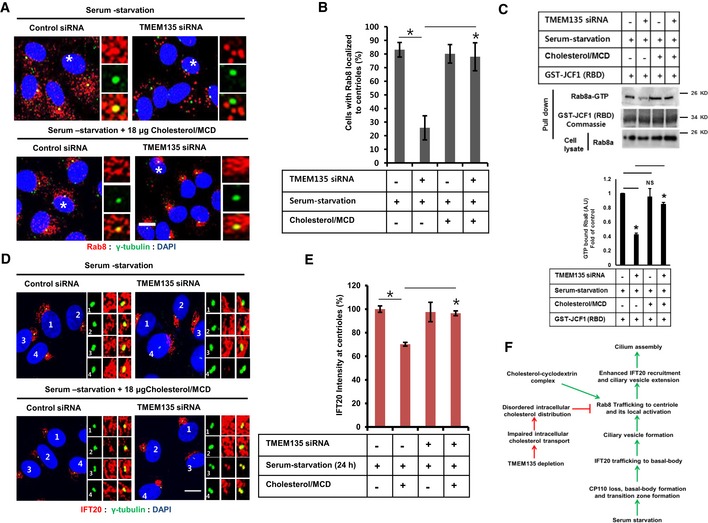
RPE1 cells were transfected as indicated, followed by incubation in serum‐starvation media in the presence or absence of cholesterol/MCD for 24 h, and then immunostained for Rab8 (red) and γ‐tubulin (green). Scale bar, 10 μm. Representative magnified images are shown from cells labeled with white asterisks.
Quantification of the percentage of cells with Rab8 localized to the centriole shown in (A). Data represent mean ± SD (n = 3 experiments), and 200 cells were scored per condition per experiment; *P < 0.05, Student's t‐test.
(Upper panel) Cells were transfected as shown in (A), and cell lysate was incubated with purified GST‐JCF1 (RBD) fusion protein. The amount of GTP‐Rab8 bound to GFT‐JCF1(RBD) was analyzed by Western blot with Rab8 antibody. (Lower panel) The intensity of bands was quantified by ImageJ software. The amount of GTP‐Rab8 was normalized to the control level. The bar graph represents mean ± SD (n = 3 experiments). *P < 0.05, Student's t‐test.
Cells were transfected as shown in (A) and immunostained for IFT20 (red) and γ‐tubulin (green). Scale bar, 10 μm.
Quantification of IFT20 intensity at the centriole shown in (D). Data represent mean ± SD (n = 3 experiments), and 150 cells were scored per condition per experiment; *P < 0.05, Student's t‐test.
A proposed model showing the importance of cholesterol for primary ciliogenesis.
References
-
- Westlake CJ, Baye LM, Nachury MV, Wright KJ, Ervin KE, Phu L, Chalouni C, Beck JS, Kirkpatrick DS, Slusarski DC et al (2011) Primary cilia membrane assembly is initiated by Rab11 and transport protein particle II (TRAPPII) complex‐dependent trafficking of Rabin8 to the centrosome. PNAS 108: 2759–2764 - PMC - PubMed
-
- Molla HA, Ghossoub R, Blisnick T, Meunier A, Serres C, Silbermann F, Emmerson C, Romeo K, Bourdoncle P, Schmitt A et al (2010) The ciliary pocket: an endocytic membrane domain at the base of primary and motile cilia. J Cell Sci 15: 1785–1795 - PubMed
Publication types
MeSH terms
Substances
Grants and funding
LinkOut - more resources
Full Text Sources
Medical
Molecular Biology Databases
Research Materials
