. 2020 Mar 17;9(6):e010240.
doi: 10.1161/JAHA.118.010240. Epub 2020 Mar 11.

PinX1t, a Novel PinX1 Transcript Variant, Positively Regulates Cardiogenesis of Embryonic Stem Cells

Affiliations

PinX1t, a Novel PinX1 Transcript Variant, Positively Regulates Cardiogenesis of Embryonic Stem Cells

Hing Chung Chan et al. J Am Heart Assoc. .

Abstract

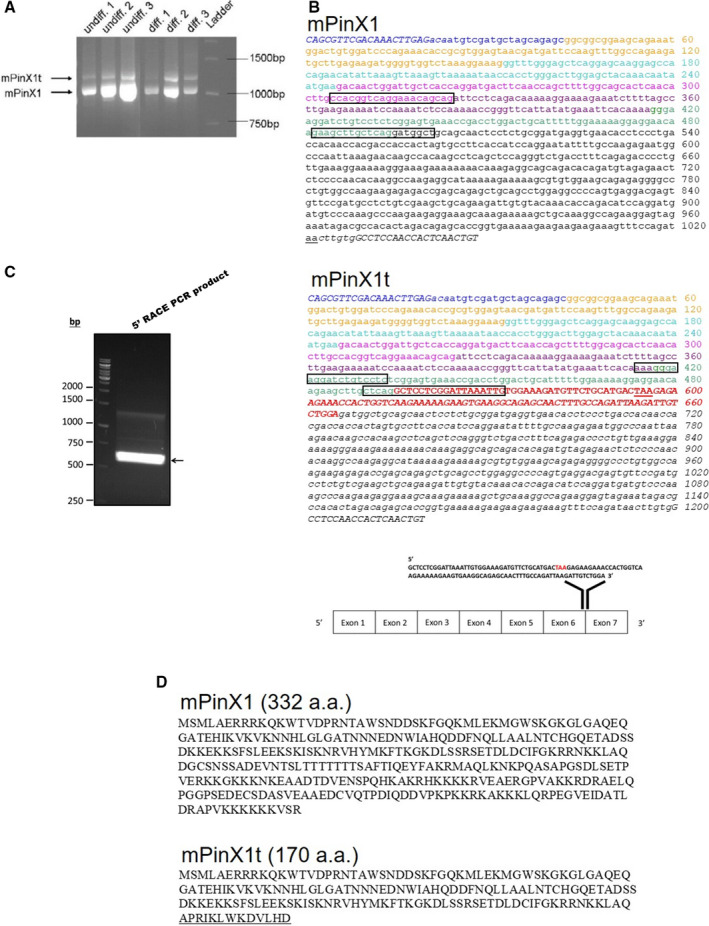
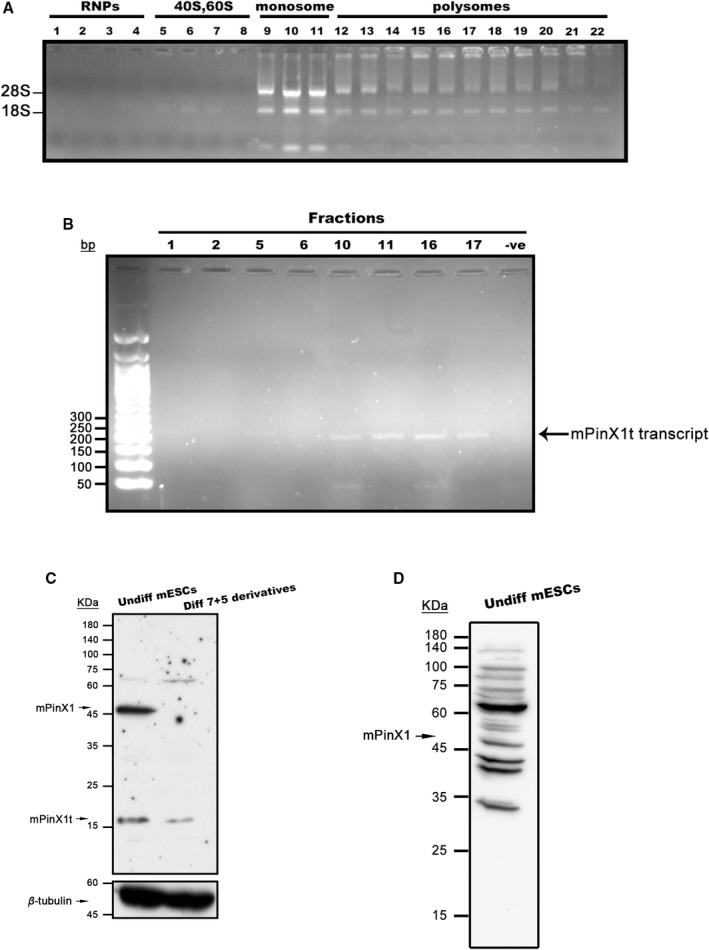
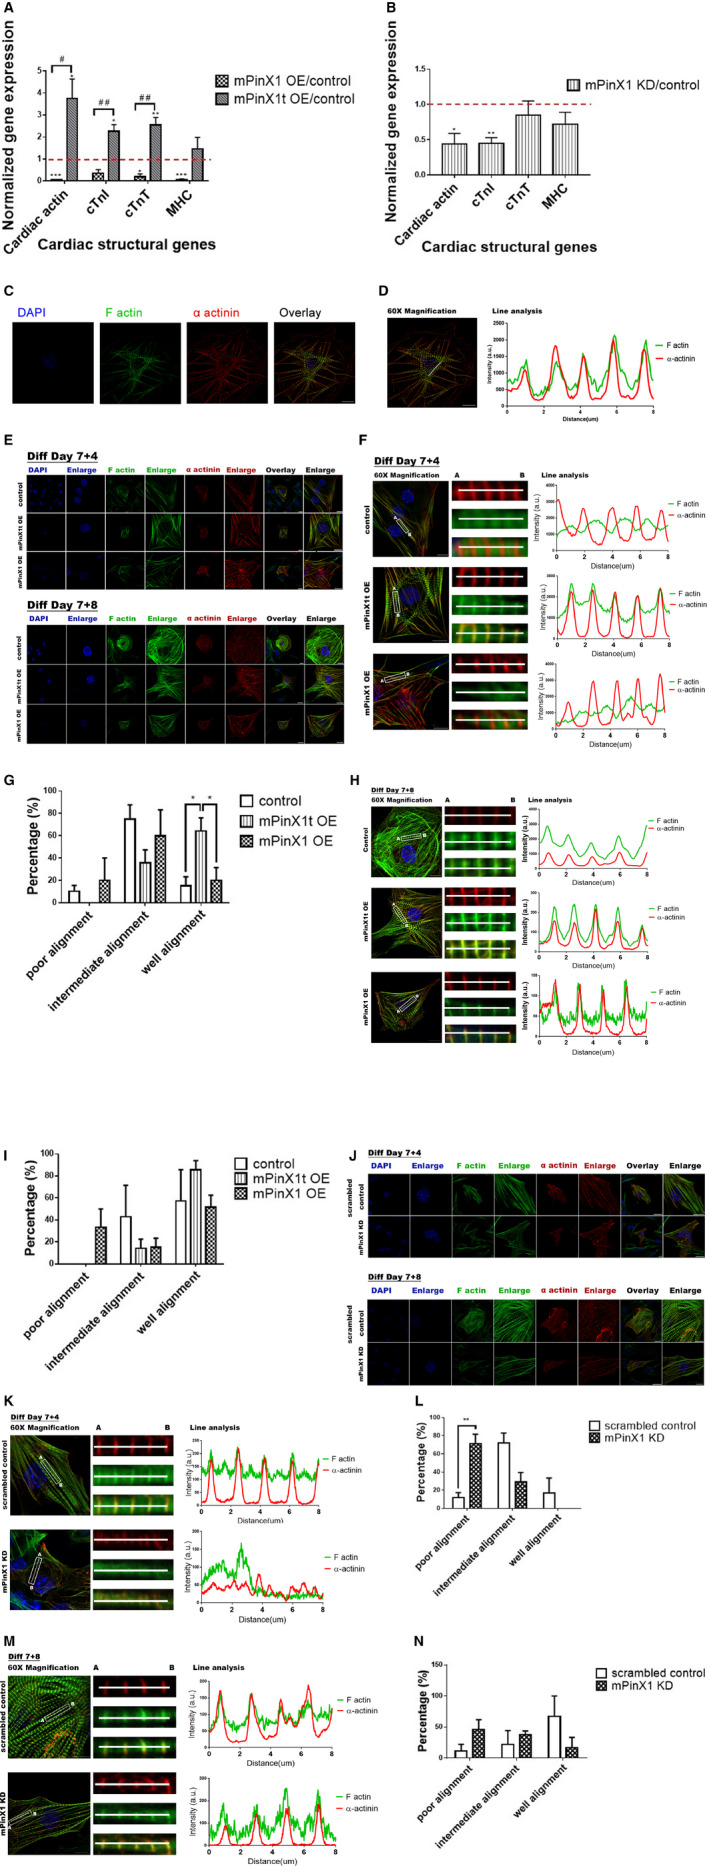
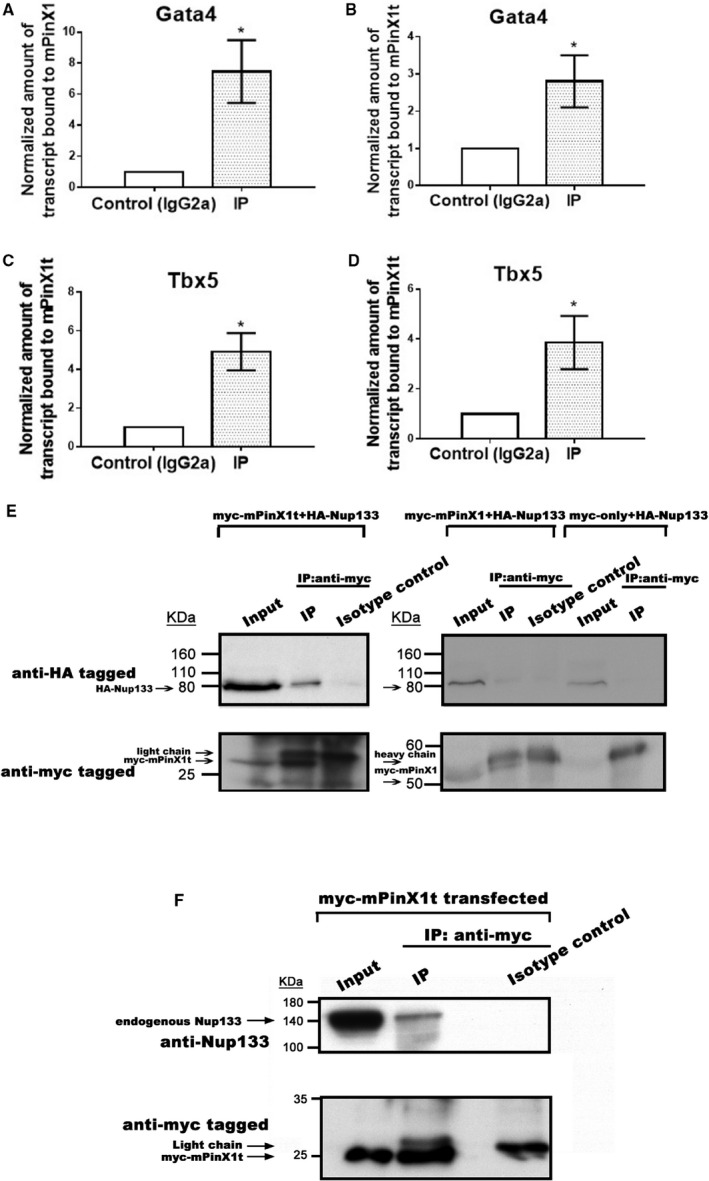
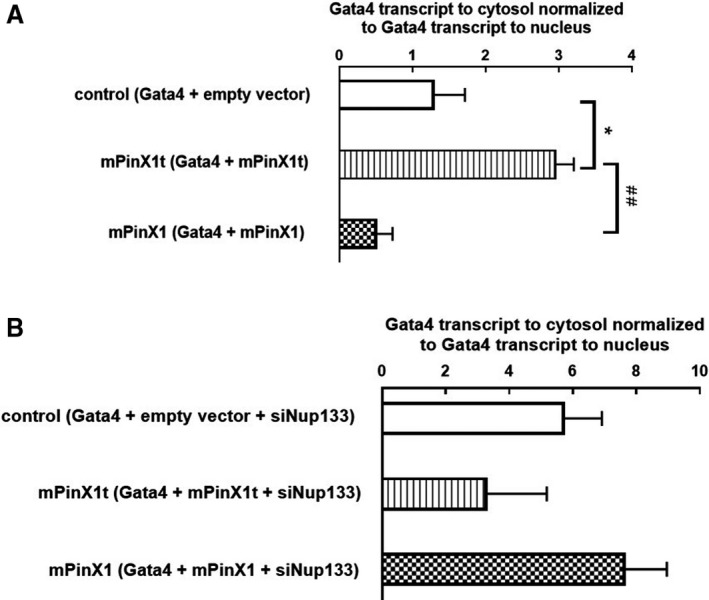
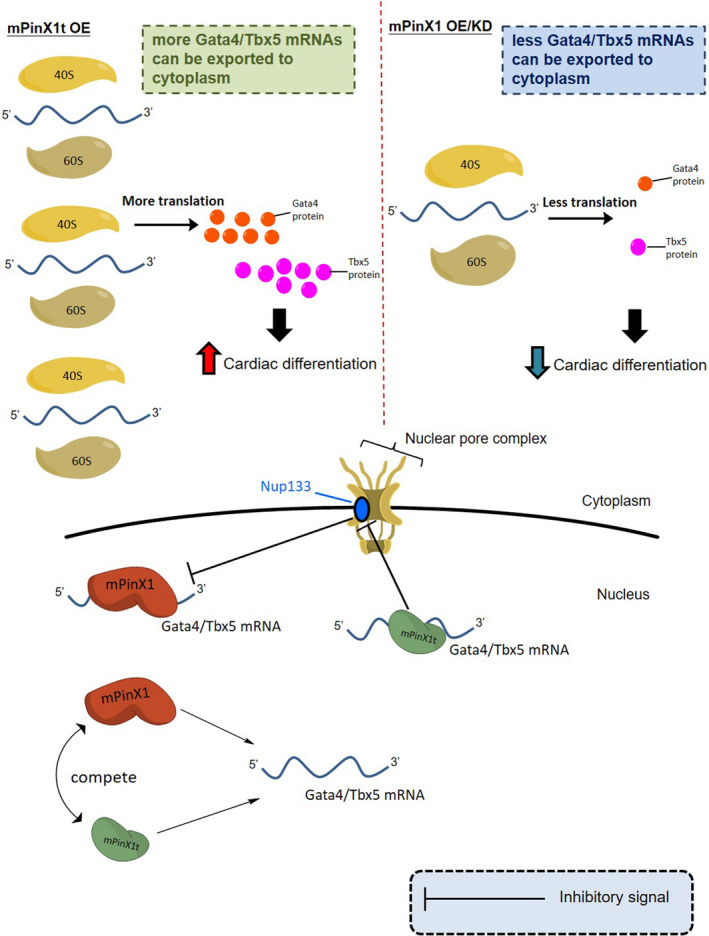
Background Pin2/TRF1-interacting protein, PinX1, was previously identified as a tumor suppressor. Here, we discovered a novel transcript variant of mPinX1 (mouse PinX1), mPinX1t (mouse PinX1t), in embryonic stem cells (ESCs). The aims of this investigation were (1) to detect the presence of mPinX1 and mPinX1t in ESCs and their differentiation derivatives; (2) to investigate the role of mPinX1 and mPinX1t on regulating the characteristics of undifferentiated ESCs and the cardiac differentiation of ESCs; (3) to elucidate the molecular mechanisms of how mPinX1 and mPinX1t regulate the cardiac differentiation of ESCs. Methods and Results By 5' rapid amplification of cDNA ends, 3' rapid amplification of cDNA ends, and polysome fractionation followed by reverse transcription-polymerase chain reaction, mPinX1t transcript was confirmed to be an intact mRNA that is actively translated. Western blot confirmed the existence of mPinX1t protein. Overexpression or knockdown of mPinX1 (both decreased mPinX1t expression) both decreased while overexpression of mPinX1t increased the cardiac differentiation of ESCs. Although both mPinX1 and mPinX1t proteins were found to bind to cardiac transcription factor mRNAs, only mPinX1t protein but not mPinX1 protein was found to bind to nucleoporin 133 protein, a nuclear pore complex component. In addition, mPinX1t-containing cells were found to have a higher cytosol-to-nucleus ratio of cardiac transcription factor mRNAs when compared with that in the control cells. Our data suggested that mPinX1t may positively regulate cardiac differentiation by enhancing export of cardiac transcription factor mRNAs through interacting with nucleoporin 133. Conclusions We discovered a novel transcript variant of mPinX1, the mPinX1t, which positively regulates the cardiac differentiation of ESCs.

Keywords: PinX1; cardiac development; cardiac differentiation; embryonic stem cell; transcript variants.


Figures

Figure 1
Figure 1
Discovery of mPinX1t, the novel transcript variant of mPinX1. A, Presence of 2 splice variants, mPinX1 and mPinX1t, as revealed by RTPCR. In the PCR, primers flanking the coding sequence of mPinX1 were used. Two splice variants were detected in both undifferentiated mESCs (undiff) and their differentiation derivatives (diff). B, cDNA sequences of (upper panel) mPinX1 and (middle panel) mPinX1t. Different colors represent different exons. Note that there is an extra exon in mPinX1t as represented by red and bold nucleotides. Start codon and stop codon are underlined. Italic nucleotides represent nucleotides at the untranslated regions. Italic and bold nucleotides located at the beginning and the end of the sequences represent PCR primer sequences used in (A). Boxed regions indicate the location of primers used in qPCR reactions. (Lower panel) Extra 111 nucleotides of mPinX1t was found to locate between exon 6 and exon 7 of mPinX1 sequence. Stop codon “TAA” is highlighted in red. C, Result of 5′RACE PCR reaction using primer specific for the 5′ added sequence and primer complementary to the mPinX1t sequence. The result indicated the presence of mPinX1t mRNA with intact 5′UTR. D, Amino acid sequence of (upper panel) mPinX1 and (lower panel) mPinX1t. mPinX1t contains the N‐terminal of mPinX1 (1–157 amino acids) but lacks the C‐terminal of mPinX1. Amino acids that are underlined represent the sequence that is present only in mPinX1t. 5′RACE indicates 5′ rapid amplification of cDNA ends; 5′UTR, 5′ untranslated region; mESCs, mouse embryonic stem cells; PCR, polymerase chain reaction; RT‐PCR, reverse transcription polymerase chain reaction.
Figure 2
Figure 2
mPinX1t is a protein encoding gene. A and B, High‐density sucrose gradient polysome fractionation was performed using mESC lysate. A, Nondenaturing RNA agarose gel showing the presence and the integrity of 28S and 18S rRNAs in different fractions. Fractions 1 to 4 represent free ribonucleoprotein fractions; fractions 5 to 8 represent 40S, 60S fractions; fractions 9 to 11 represent monosome fractions; fractions 12 to 22 represent polysome fractions. B, PCR reactions of different fractions showing the presence of mPinX1t transcripts in monosome and polysome fractions. Equal volume of PCR product was loaded onto each lane. “–ve” represents negative control. C, Representative western blot showing the expressions of mPinX1 and mPinX1t proteins in undifferentiated mESCs and mESC differentiation derivatives at day 7+5. β‐Tubulin was used as the loading control. mPinX1 was observed at around 45 kDa and mPinX1t was observed between 15 and 25 kDa. D, Representative western blot showing the expression of mPinX1 proteins in undifferentiated mESCs using an antibody targeting the C‐terminal of mPinX1 (Orb47163). mPinX1 was observed at around 45 kDa; mPinX1t, which lacks the C‐terminal of mPinX1, was not detected. mESC indicates mouse embryonic stem cell; RNPs, ribonucleoproteins; PCR, polymerase chain reaction.
Figure 3
Figure 3
Effects of the overexpression and knockdown of mPinX1/mPinX1t on cardiac differentiation and sarcomere assembly. A, Bar chart showing the change in expressions of cardiac actin, cTnI, cTnT), and myosin heavy chain (MHC) of cells on differentiation day 7+25 in mPinX1 and mPinX1t overexpression lines normalized to that of control. Dotted line indicates the expression level of the control line. Overexpression of mPinX1 (mPinX1 OE) decreased while overexpression of mPinX1t (mPinX1t OE) increased the expressions of cardiac structural genes. Data were presented as mean±SEM (mPinX1 OE group, n=3; mPinX1t OE group, n=5; control group, n=5; where n represents data from each independent differentiations). *P<0.05, ***P<0.001 vs control line. # P<0.05, ## P<0.01 vs mPinX1 overexpression line. B, Bar chart showing the change in expressions of cardiac actin, cTnI, cTnT, and MHC of cells on differentiated day 7+25 in mPinX1 knockdown line normalized to that of control. Dotted line indicates the expression level of the control line. Knockdown of mPinX1 (mPinX1 KD) decreased the expression of cardiac structural genes. Data were presented as mean±SEM (n=3; where n represents data from each independent differentiations). *P<0.05, **P<0.01 vs control line. C, Immunostaining of α‐actinin and F‐actin of differentiation day 7+12 cardiomyocyte reveals proper sarcomere formation when cardiomyocytes are mature. Scale bar: 10 μm. D, Line analysis showing α‐actinin and F‐actin patterns of differentiation day 7+12 cardiomyocyte in (C). Mature cardiomyocytes have overlapping pattern of α‐actinin and F‐actin. Scale bar: 10 μm. E, Representative immunostaining results of α‐actinin and F‐actin of cardiomyocytes at early differentiation time point (day 7+4) and intermediate differentiation time point (day 7+8) in control line, mPinX1t overexpression line and mPinX1 overexpression line. Scale bar: 20 μm for photos of overlay views and 10 μm for photos with enlarged views. F, Line analysis of cardiomyocytes at early differentiation time point (day 7+4) in control line, mPinX1t overexpression line and mPinX1 overexpression line shown in (E). Scale bar: 10 μm. G, Bar graph summarizing the effects of mPinX1 and mPinX1t overexpression on sarcomere assembly at early differentiation time point (day 7+4). mPinX1t overexpression cell line showed a higher percentage of cardiomyocytes with a well‐aligned α‐actinin and F‐actin pattern, while it did not have cardiomyocytes with poor alignment. Data were presented as mean±SEM (15 cardiomyocytes from mPinX1 OE group, 19 cardiomyocytes from mPinX1t OE group, and 19 cardiomyocytes from control group were analyzed. Cells were obtained from 3 independent differentiations. The unit of statistical analysis was the number of independent differentiations). *P<0.05. H, Line analysis of cardiomyocytes at intermediate differentiation time point (day 7+8) in control line, mPinX1t overexpression line and mPinX1 overexpression line shown in (E). Scale bar: 10 μm. I, Bar graph summarizing the effects of mPinX1 and mPinX1t overexpression on sarcomere assembly at intermediate differentiation time point (day 7+8). Control, mPinX1 overexpression and mPinX1t overexpression cell lines all had >50% cardiomyocytes showing a well‐aligned α‐actinin and F‐actin pattern. The mPinX1t overexpression cell line had a trend of having higher percentage of cardiomyocytes with a well‐aligned α‐actinin and F‐actin pattern. The mPinX1 overexpression cell line had cardiomyocytes with poorly aligned α‐actinin and F‐actin pattern, while mPinX1t overexpression cell line or the control line did not have cardiomyocyte with poor alignment. Data were presented as mean±SEM (19 cardiomyocytes from mPinX1 OE group, 20 cardiomyocytes from mPinX1t OE group, and 19 cardiomyocytes from control group were analyzed. Cell were obtained from 3 independent differentiations. The unit of statistical analysis was the number of independent differentiations.). J, Representative immunostaining results of α‐actinin and F‐actin of cardiomyocytes at early differentiation time point (day 7+4) and intermediate differentiation time point (day 7+8) in scrambled control line and mPinX1 knockdown line. Scale bar: 20 μm for photos of overlay views and 10 μm for photos with enlarged views. K, Line analysis of cardiomyocytes at early differentiation time point (day 7+4) in scrambled control line and mPinX1 knockdown line shown in (J). Scale bar: 10 μm. L, Bar graph summarizing the effects of mPinX1 knockdown on sarcomere assembly at early differentiation time point (day 7+4). mPinX1 knockdown cell line showed a higher percentage of cardiomyocytes with poorly aligned α‐actinin and F‐actin pattern, while it did not have cardiomyocytes with good alignment. Data were presented as mean±SEM (17 cardiomyocytes from the mPinX1 KD group and 18 cardiomyocytes from the scrambled control group were analyzed. Cells were obtained from 3 independent differentiations. The unit of statistical analysis was the number of independent differentiations.). **P<0.01. M, Line analysis of cardiomyocytes at intermediate differentiation time point (day 7+8) in scrambled control line and mPinX1 knockdown line shown in (J). Scale bar: 10 μm. N, Bar graph summarizing the effects of mPinX1 knockdown on sarcomere assembly at intermediate differentiation time point (day 7+8). mPinX1 knockdown cell line had a trend of having higher percentage of cardiomyocytes with poorly aligned α‐actinin and F‐actin pattern and had a trend of having lower percentage of cardiomyocytes with a well‐aligned α‐actinin and F‐actin pattern. Data were presented as mean±SEM (17 cardiomyocytes from the mPinX1 KD group and 15 cardiomyocytes from the scrambled control group were analyzed. Cells were obtained from 3 independent differentiations. The unit of statistical analysis was the number of independent differentiations.) cTnI indicates cardiac troponin I; cTnT, cardiac troponin T; DAPI 4′,6‐diamidino‐2‐phenylindole.
Figure 4
Figure 4
Both mPinX1 and mPinX1t proteins bound cardiac transcription factor mRNAs, while only mPinX1t protein but not mPinX1 protein‐bound Nucleoporin 133 (Nup133). A through D, RNA immunoprecipitation of HEK293FT cells overexpressed with (A and C) myc‐mPinX1 or (B and D) myc‐mPinX1t and (A and B) Gata4 or (C and D) Tbx5. Anti‐myc was used to perform the immunoprecipitation. IgG2a was used in isotype control experiment. The presence of (A and B) Gata4 mRNA or (C and D) Tbx5 mRNA in the immunoprecipitant was quantitated by subsequent quantitative polymerase chain reaction. The results showed that both mPinX1 and mPinX1t proteins could bind to Gata4 mRNA and Tbx5 mRNA. Data were presented as mean±SEM (n=3; where n represents independent RNA immunoprecipitation experiments). *P<0.05 vs control. E, Coimmunoprecipitation assay of HEK293FT cells overexpressed with myc‐mPinX1t (left panel) or myc‐mPinX1 and HA‐Nup133 (right panel). (Left panel) In the immunoprecipitant of anti‐myc (which contained myc‐mPinX1t), HA‐Nup133 was detected. No HA‐Nup133 was detected in the isotype control group. (Right panel) In the immunoprecipitant of anti‐myc (which contained myc‐mPinX1), HA‐Nup133 was not enhanced when compared with isotype control group. Another control experiment was also performed in which myc only and HA‐Nup133 were overexpressed in HE293FT cells. Using anti‐myc for immunoprecipitation, as expected, no HA‐Nup133 was detected in the immunoprecipitant. F, Coimmunoprecipitation assay of HEK293FT cells overexpressed with myc‐mPinX1t. As shown in the input lane, HEK293FT expressed endogenous Nup133. In the immunoprecipitant of anti‐myc (which contained myc‐mPinX1t), endogenous Nup133 was detected. No Nup133 was detected in the isotype control group. DAPI indicates 4′,6‐diamidino‐2‐phenylindole.
Figure 5
Figure 5
mPinX1t increased the ratio of cytosolic Gata4 mRNAs to nuclear Gata4 mRNAs; knockdown of Nup133 abolished the effect. A, Gata4 and empty vector/mPinX1/mPinX1t were overexpressed in HEK293FT, followed by fractionation of cytosolic and nuclear mRNAs. RTqPCR on the Gata4 mRNAs was then performed using the cytosolic and the nuclear fractions. The amount of Gata4 transcripts in cytosol was normalized to that in nucleus. Our results showed that, in mPinX1t and Gata4 co‐transfected group, a higher ratio of cytosolic Gata4 mRNAs to nuclear Gata4 mRNAs was detected when compared with that in control group (empty vector and Gata4 co‐transfected group). On the other hand, mPinX1 and Gata4 co‐transfected group tended to have a lower ratio of cytosolic Gata4 mRNAs to nuclear Gata4 mRNAs. Data were presented as mean±SEM (n=3; where n represents independent experiments). *P<0.05 vs control group. ## P<0.01 vs mPinX1 group. B, Gata4, empty vector/mPinX1/mPinX1t and siRNA against Nup133 (siNup133) were overexpressed in HEK293FT, followed by fractionation of cytosolic and nuclear mRNAs. RTqPCR on the Gata4 mRNAs was then performed using the cytosolic and the nuclear fractions. The amount of Gata4 transcripts in cytosol was normalized to that in nucleus. Our results showed that there was no statistical difference in the ratio of cytosolic Gata4 mRNAs to nuclear Gata4 mRNAs between different groups. Data were presented as mean±SEM (n=3; where n represents independent experiments).
Figure 6
Figure 6
Schematic diagram showing a model of how mPinX1t regulates cardiac differentiation. mPinX1 and mPinX1t contain the RNA‐binding domain G‐Patch. This domain allows mPinX1 and mPinX1t to compete with each other for binding to the mRNAs of the cardiac transcription factors Gata4 and Tbx5. Only mPinX1t would interact with Nucleoporin 133 (Nup133), a component of the nuclear pore complex. We speculate that mammalian Nup133 negatively mediates the transport of mRNAs from nucleus to cytoplasm; mPinX1t interacts with Nup133 and relieves its inhibitory effect on the transport of Gata4 and Tbx5 mRNAs from nucleus to cytoplasm. Therefore, in the presence of mPinX1t, more Gata4 and Tbx5 mRNAs can be exported to the cytoplasm for later translation. This would result in larger amount of cardiac transcription factor proteins produced for cardiac differentiation. In the upper part of the figure, what happens in the cytoplasm under different scenarios are indicated. When mPinX1t is overexpressed, mPinX1t protein would bind to the mRNAs of Gata4 and Tbx5; these mPinX1t proteins would also interact with Nup133 to relieve its inhibitor effect on the transport the mRNAs, so more mRNAs are exported to the cytoplasm for translation. The translated Gata4 and Tbx5 proteins would then function as cardiac transcription factors for cardiac differentiation. When mPinX1 is overexpressed, it competes with mPinX1t and binds to Gata4 and Tbx5 mRNAs. Therefore, less mPinX1t protein binds to Gata4 and Tbx5 mRNAs. On the other hand, when mPinX1 is knocked down, mPinX1t is also knocked down; therefore, there is less mPinX1t protein to interact with Nup133. In both cases, mRNA transport inhibitor effect of Nup133 still exists; export of mRNAs of Gata4 and Tbx5 to the cytoplasm would decrease, leading to a decrease in cardiac differentiation.

References

    1. Pagidipati NJ, Gaziano TA. Estimating deaths from cardiovascular disease: a review of global methodologies of mortality measurement. Circulation. 2013;127:749–756. - PMC - PubMed
    1. Ali SR, Hippenmeyer S, Saadat LV, Luo L, Weissman IL, Ardehali R. Existing cardiomyocytes generate cardiomyocytes at a low rate after birth in mice. Proc Natl Acad Sci USA. 2014;111:8850–8855. - PMC - PubMed
    1. Scott IC. Life before Nkx2. 5: cardiovascular progenitor cells: embryonic origins and development. Curr Top Dev Biol. 2012;100:1–31. - PubMed
    1. Rajala K, Pekkanen‐Mattila M, Aalto‐Setala K. Cardiac differentiation of pluripotent stem cells. Stem Cells Int. 2011;2011:383709. - PMC - PubMed
    1. Bruneau BG, Logan M, Davis N, Levi T, Tabin CJ, Seidman JG, Seidman CE. Chamber‐specific cardiac expression of Tbx5 and heart defects in Holt‐Oram syndrome. Dev Biol. 1999;211:100–108. - PubMed

Publication types

MeSH terms