. 2020 Jun;102(6):1253-1262.
doi: 10.4269/ajtmh.19-0916.

Seasonal Distribution and Meteorological Factors Associated with Hand, Foot, and Mouth Disease among Children in Xi'an, Northwestern China

Affiliations

Seasonal Distribution and Meteorological Factors Associated with Hand, Foot, and Mouth Disease among Children in Xi'an, Northwestern China

Tianci Guo et al. Am J Trop Med Hyg. 2020 Jun.

Abstract

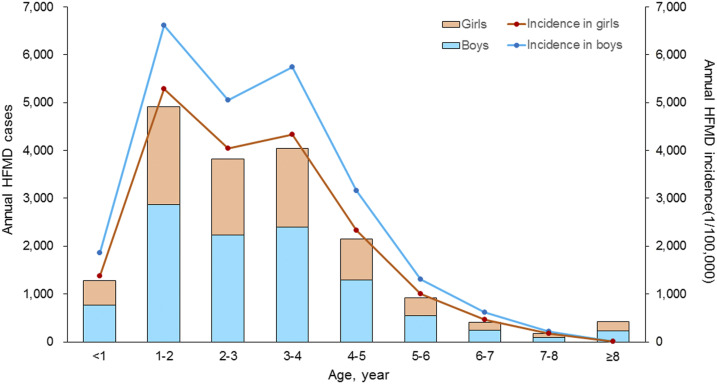
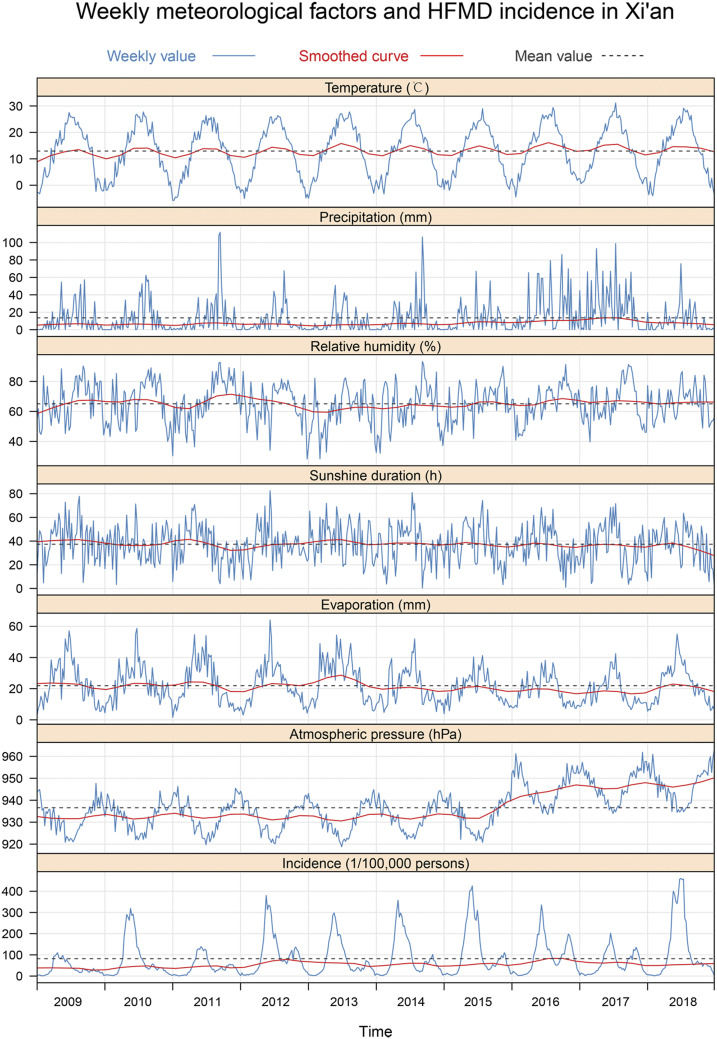
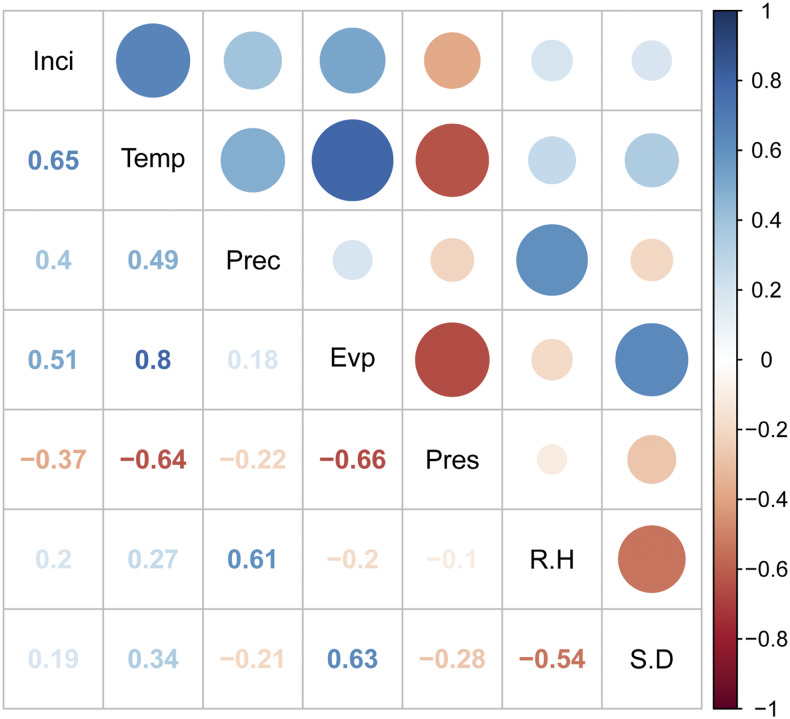
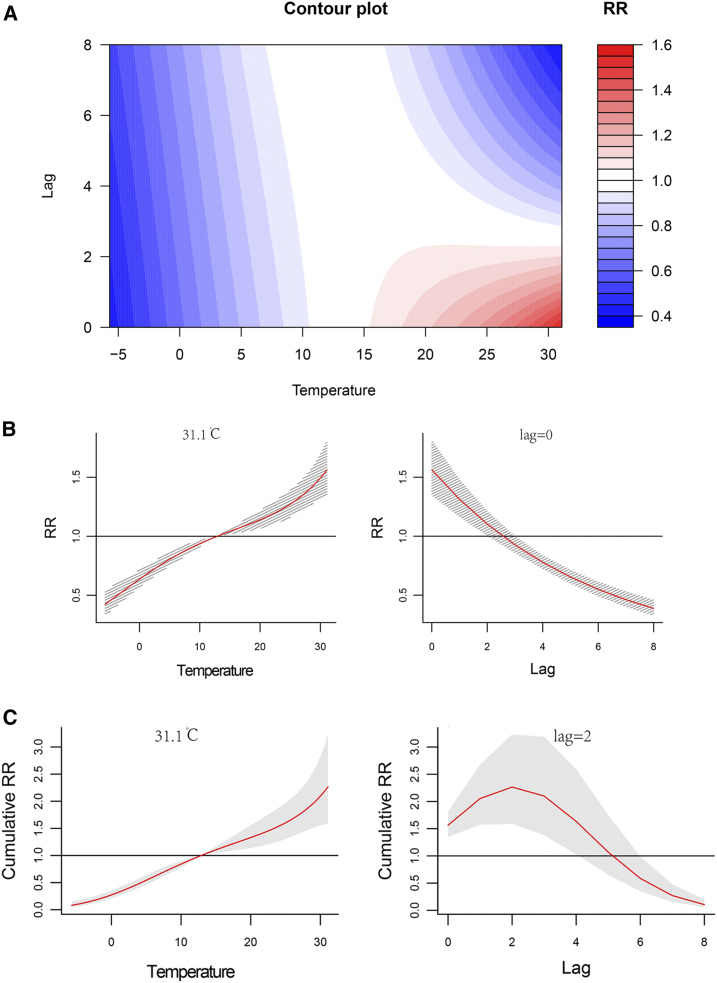
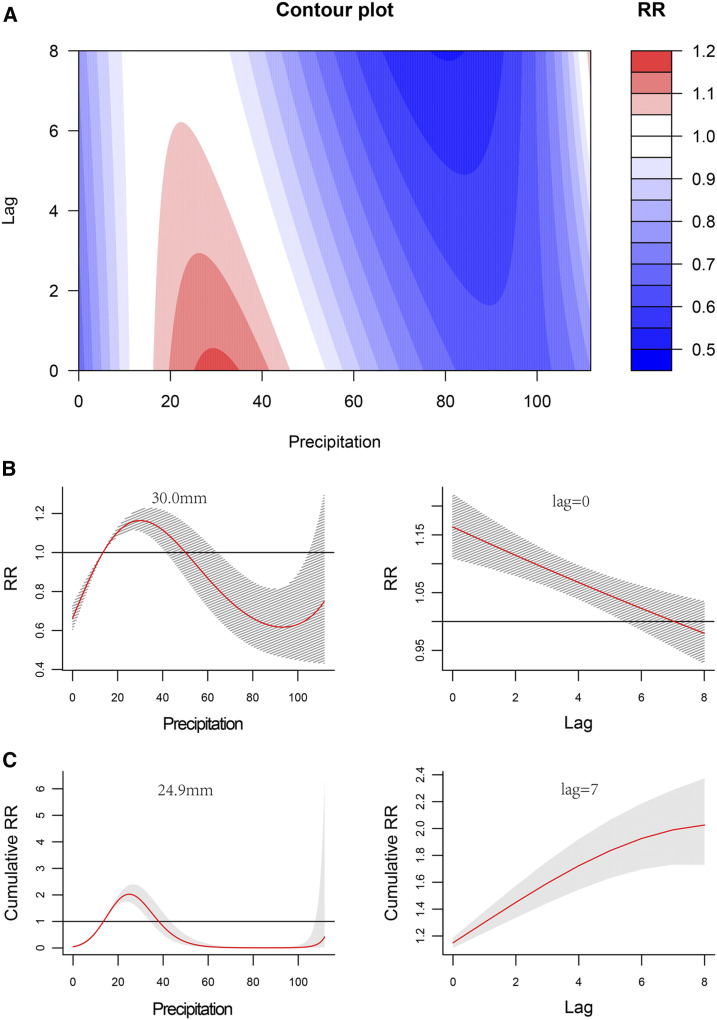
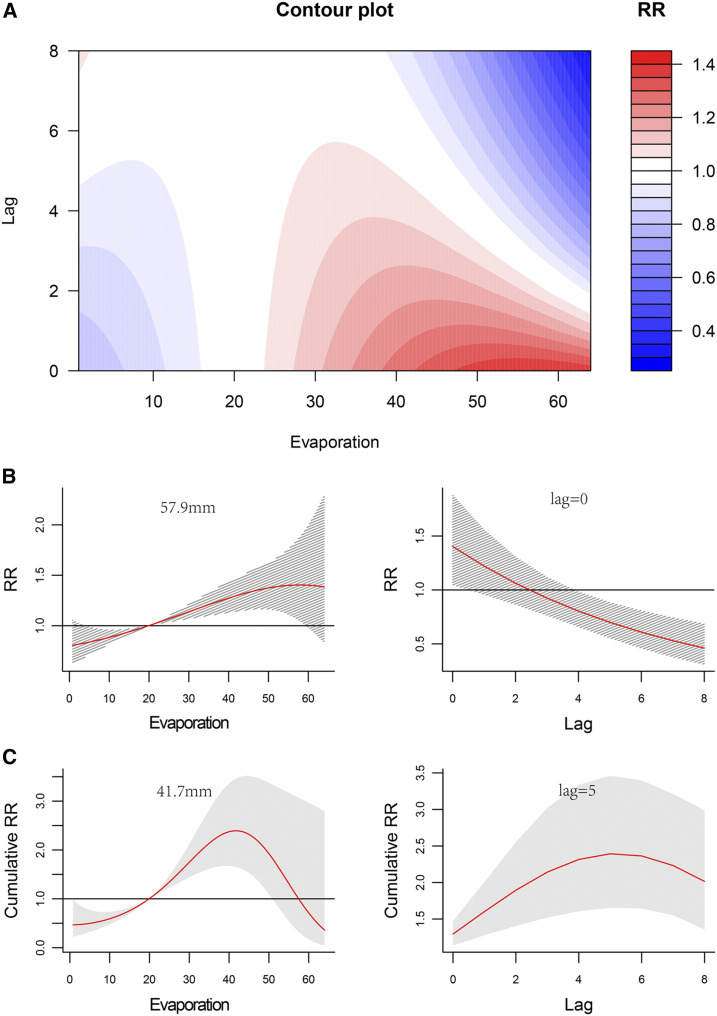
Hand, foot, and mouth disease (HFMD) is a common infectious disease in the Asia-Pacific region that primarily affects children younger than 5 years. Previous studies have confirmed that the seasonal transmission of this disease is strongly related to meteorological factors, but the results are not consistent. In addition, the associations between weather conditions and HFMD in northwestern China have not been investigated. Therefore, we aimed to examine this issue in Xi'an, the largest city of northwestern China that has been suffering from serious HFMD epidemics. In the current study, data for HFMD and six meteorological factors were collected from 2009 to 2018. Using cross-correlation analysis, the Granger causality test, and the distributed lag nonlinear model, we estimated the quantitative relationships and exposure-lag-response effects between weekly meteorological factors and HFMD incidence among children. We found that the seasonal distribution of HFMD in Xi'an has two peaks each year and is significantly impacted by the weekly temperature, precipitation, and evaporation over an 8-week period. Higher values of temperature and evaporation had positive associations with disease transmission, whereas the association between precipitation and HFMD showed an inverted-U shape. The maximum relative risks (RRs) of HFMD for the weekly mean temperature (approximately 31.1°C), weekly cumulative evaporation (57.9 mm), and weekly cumulative precipitation (30.0 mm) were 1.56 (95% CI: 1.35-1.81), 1.40 (95% CI: 1.05-1.88), and 1.16 (95% CI: 1.11-1.70), respectively. The identified risk determinants and lag effects could provide important information for early interventions to reduce the local disease burden.


Conflict of interest statement

Disclaimer: The funders had no role in the study design, data collection, data analysis, data interpretation, or writing of the report.

Disclosure: The corresponding authors had full access to all of the data in this study and had final responsibility for the decision to submit for publication. The authors declare that the research was conducted in the absence of any commercial or financial relationships that could be construed as a potential conflict of interest.

Figures

Figure 1.
Figure 1.
Age and gender distribution of hand, foot, and mouth disease cases in Xi’an city, northwestern China, 2009–2018. This figure appears in color at www.ajtmh.org.
Figure 2.
Figure 2.
Weekly incidence of hand, foot, and mouth disease (HFMD) and meteorological variables in Xi’an city, northwestern China, 2009–2018. (From top to bottom, the curves are temperature, precipitation, relative humidity, sunshine duration, evaporation, atmospheric pressure, and incidence of HFMD, respectively). This figure appears in color at www.ajtmh.org.
Figure 3.
Figure 3.
Cross-correlation coefficients between the weekly meteorological variables and the incidence of hand, foot, and mouth disease (HFMD) in Xi’an city, northwestern China, 2009–2018 (Inci: weekly incidence of HFMD; Temp: weekly mean temperature; Prec: weekly cumulative precipitation; Evp: weekly cumulative evaporation; Pres: weekly mean atmospheric pressure; R.H: weekly mean relative humidity; S.D: weekly cumulative sunshine duration). This figure appears in color at www.ajtmh.org.
Figure 4.
Figure 4.
Nonlinear and lag effects of temperature on the incidence of hand, foot, and mouth disease (HFMD) in Xi’an city, northwestern China, 2009–2018. (A) Contour plots of the combined effect of lag time (weeks) and temperature on the relative risk (RR) of HFMD transmission. (B) Effects of specific temperature and lag time (weeks) on the RR of HFMD transmission. The red lines indicate the mean RRs, and the gray lines indicate the 95% CI. (C) Effect of specific temperature and lag time (weeks) on the cumulative risk of HFMD transmission. The red lines indicate the mean cumulative risks, and the gray areas correspond to the 95% CIs. This figure appears in color at www.ajtmh.org.
Figure 5.
Figure 5.
Nonlinear and lag effects of precipitation on the incidence of hand, foot, and mouth disease (HFMD) in Xi’an city, northwestern China, 2009–2018. (A) Contour plots of the combined effect of lag time (weeks) and precipitation on the relative risk (RR) of HFMD transmission. (B) Effects of specific precipitation and lag time (weeks) on the RR of HFMD transmission. The red lines indicate the mean RRs, and the gray lines indicate the 95% CIs. (C) Effects of specific precipitation and lag time (weeks) on the cumulative risk of HFMD transmission. The red lines indicate the mean cumulative risks, and the gray areas indicate the 95% CIs. This figure appears in color at www.ajtmh.org
Figure 6.
Figure 6.
Nonlinear and lag effects of evaporation on the incidence of hand, foot, and mouth disease (HFMD) in Xi’an City, northwestern China, 2009–2018. (A) Contour plots of the combined effect of evaporation and lag time (weeks) on the relative risk (RR) of HFMD transmission. (B) Effects of specific evaporation and lag time (weeks) on the RR of HFMD transmission. The red lines indicate the mean RRs, and the gray lines indicate the 95% CIs. (C) Effect of specific evaporation and lag time (weeks) on the cumulative risk of HFMD transmission. The red lines indicate the mean cumulative risks, and the gray areas indicate 95% CIs. This figure appears in color at www.ajtmh.org

Similar articles

Cited by

References

    1. Koh WM, Bogich T, Siegel K, Jin J, Chong EY, Tan CY, Chen MI, Horby P, Cook AR, 2016. The epidemiology of hand, foot and mouth disease in Asia: a systematic review and analysis. Pediatr Infect Dis J 35: 285–300. - PMC - PubMed
    1. Huang MC, Wang SM, Hsu YW, Lin HC, Chi CY, Liu CC, 2006. Long-term cognitive and motor deficits after enterovirus 71 brainstem encephalitis in children. Pediatrics 118: 1785–1788. - PubMed
    1. Chang LY, Huang LM, Gau SS, Wu YY, Hsia SH, Fan TY, Lin KL, Huang YC, Lu CY, Lin TY, 2007. Neurodevelopment and cognition in children after enterovirus 71 infection. N Engl J Med 356: 1226–1234. - PubMed
    1. Xing W, et al. 2014. Hand, foot, and mouth disease in China, 2008–12: an epidemiological study. Lancet Infect Dis 14: 308–318. - PMC - PubMed
    1. Song JH, Park K, Shim A, Kwon BE, Ahn JH, Choi YJ, Kim JK, Yeo SG, Yoon K, Ko HJ, 2015. Complete sequence analysis and antiviral screening of medicinal plants for human coxsackievirus a16 isolated in Korea. Osong Public Health Res Perspect 6: 52–58. - PMC - PubMed

Publication types

LinkOut - more resources