Case Reports
. 2020 Feb 25:11:96.
doi: 10.3389/fneur.2020.00096. eCollection 2020.

Hemichorea Associated With Non-ketotic Hyperglycemia: A Case Report and Literature Review

Affiliations
Case Reports

Hemichorea Associated With Non-ketotic Hyperglycemia: A Case Report and Literature Review

Wei Zheng et al. Front Neurol. .

Abstract

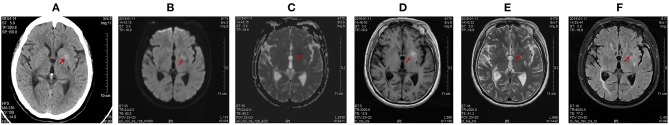
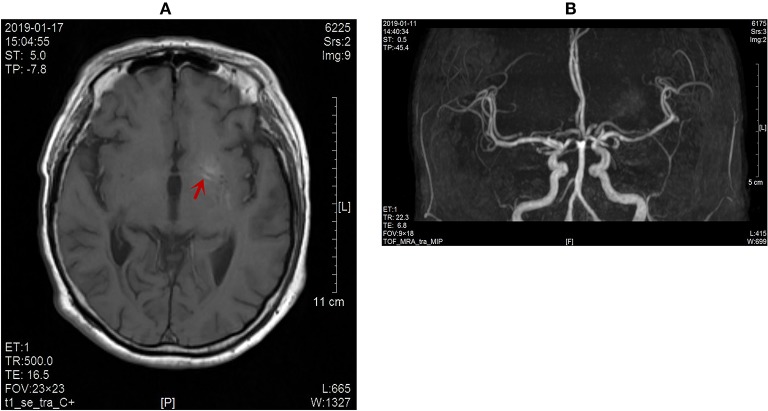
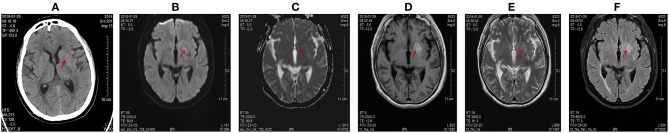
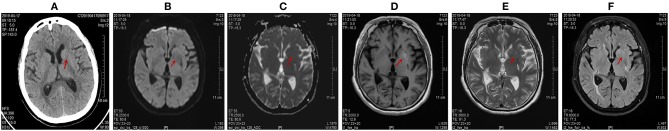
Objective: To explore the clinical manifestation, diagnosis, therapy, and mechanism of hemichorea associated with non-ketotic hyperglycemia (HC-NH) so as to enhance awareness and avoid misdiagnosis or missed diagnosis of the disease. Methods: A case of HC-NH was reported and reviewed in terms of the clinical features, diagnosis and treatment. Results: Hemichorea associated with non-ketotic hyperglycemia is a rare complication of diabetes mellitus, which is commonly seen in elderly women with poorly-controlled diabetes. The condition is characterized by non-ketotic hyperglycemia, unilateral involuntary choreiform movements, and contralateral basal ganglia hyper-intensity by T1-weighted MR imaging or high density on CT scans. Blood glucose control is the basal treatment, in combination with dopamine receptor antagonists and benzodiazepine sedative, in controlling hemichorea. Conclusion: In clinical practice, the possibility of unilateral chorea should be considered for diabetic patients with poor blood glucose control.

Keywords: blood glucose; hemichorea; lentiform nucleus; magnetic resonance imaging; non-ketotic hyperglycemia.


Figures

Figure 1
Figure 1
Computed tomography (CT) of the brain on January 15, 2019 and magnetic resonance imaging (MRI) of the brain on January 11, 2019. Abnormal signals were marked by red arrow. (A) The unenhanced high-density axial CT images within the left lentiform nucleus. The range of this abnormal signal was about 11.4 mm * 10.6 mm, and the CT value was 50.7 Hu. (B) The left lentiform nucleus showed a slightly high signal intensity by diffusion weighted imaging (DWI). (C) The left lentiform nucleus showed an equal signal intensity on ADC images. The ADC value of the abnormal lesion center was 0.636 * 10−3 mm2/s. (D) The left lentiform nucleus with a high signal intensity on T1-weighted MR images. The range of this abnormal signal is about 21 mm * 11 mm. (E) The left lentiform nucleus showed a low signal intensity on T2-weighted scans. (F) The left lentiform nucleus indicated a low signal intensity on fluid-attenuation inversion recovery (FLAIR) sequences.
Figure 2
Figure 2
(A) No obvious enhancement of the lesion on contrast-enhanced MR images (red arrow). (B) No abnormal blood vessel shadow observed on the skull MRA scans.
Figure 3
Figure 3
Computed tomography (CT) scans and magnetic resonance imaging (MRI) images of the brain on January 29, 2019. Abnormal signals were marked by red arrow. (A) The disappearance of the high signal intensity in the left lentiform nucleus on CT scans. The CT value of abnormal lesion center was 36.9 Hu. (B) The left lentiform nucleus showed an equal signal intensity on DWI scans. (C) The left lentiform nucleus showed an equal signal intensity on ADC images. The ADC value of the abnormal lesion center was 0.805 * 10−3 mm2/s. (D) The left lentiform nucleus showed a high signal intensity on axial T1-weighted images, but the range was slightly extended. The range of this abnormal signal was about 22.0 mm * 12.4 mm. (E) The lesion of the left lentiform nucleus changed from low signal to high signal on T2-weighted scans. (F) The lesion of the left lentiform nucleus changed from low signal to high signal on T2-FLAIR images.
Figure 4
Figure 4
Computed tomography (CT) scans the brain on April 17, 2019 and magnetic resonance imaging (MRI) images of the brain on April 18, 2019. Abnormal signals were marked by red arrow. (A) The disappearance of the high signal intensity in the left lentiform nucleus on CT scans. The CT value of the abnormal lesion center was 32 Hu. (B,C) The left lentiform nucleus showed an equal signal intensity on DWI and ADC scans. The ADC value of the abnormal lesion center was 0.846 * 10−3 mm2/s. (D) The lighter and narrowed signal intensity of the left lentiform nucleus on T1-weighted images. The abnormal signal range of the left lentiform nucleus was narrowed to 8 mm * 4 mm. (E,F) The disappearance of the original high signal intensity on T2-weighted and T2-FLAIR images.

References

    1. Qiu J, Cui Y, Sun L, Guo Y, Zhu Z. Hemichorea associated with cavernous angioma and a small errhysis: a case report and literature review. Medicine. (2018) 97:e12889. 10.1097/MD.0000000000012889 - DOI - PMC - PubMed
    1. Cardoso F, Seppi K, Mair KJ, Wenning GK, Poewe W. Seminar on choreas. Lancet Neurol. (2006) 5:589–602. 10.1016/S1474-4422(06)70494-X - DOI - PubMed
    1. Xiao F, Liu M, Wang XF. Involuntary choreiform movements in a diabetic patient. Lancet. (2019) 393:1033. 10.1016/S0140-6736(19)30304-6 - DOI - PubMed
    1. Bedwell SF. Some observations on hemiballismus. Neurology. (1960) 10:619–22. 10.1212/WNL.10.6.619 - DOI - PubMed
    1. Roy U, Das SK, Mukherjee A, Biswas D, Pan K, Biswas A, et al. Irreversible hemichorea-hemiballism in a case of nonketotic hyperglycemia presenting as the initial manifestation of diabetes mellitus. Tremor Other Hyperkinet Mov. (2016) 6:393. - PMC - PubMed

Publication types

LinkOut - more resources