. 2018 Jan 15;2(1):6-24.
doi: 10.1002/2017GH000095. eCollection 2018 Jan.

Coccidioidomycosis Dynamics in Relation to Climate in the Southwestern United States

Affiliations

Coccidioidomycosis Dynamics in Relation to Climate in the Southwestern United States

M E Gorris et al. Geohealth. .

Abstract

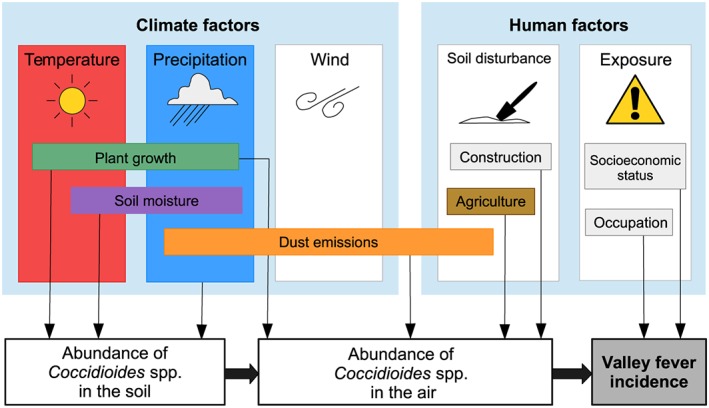
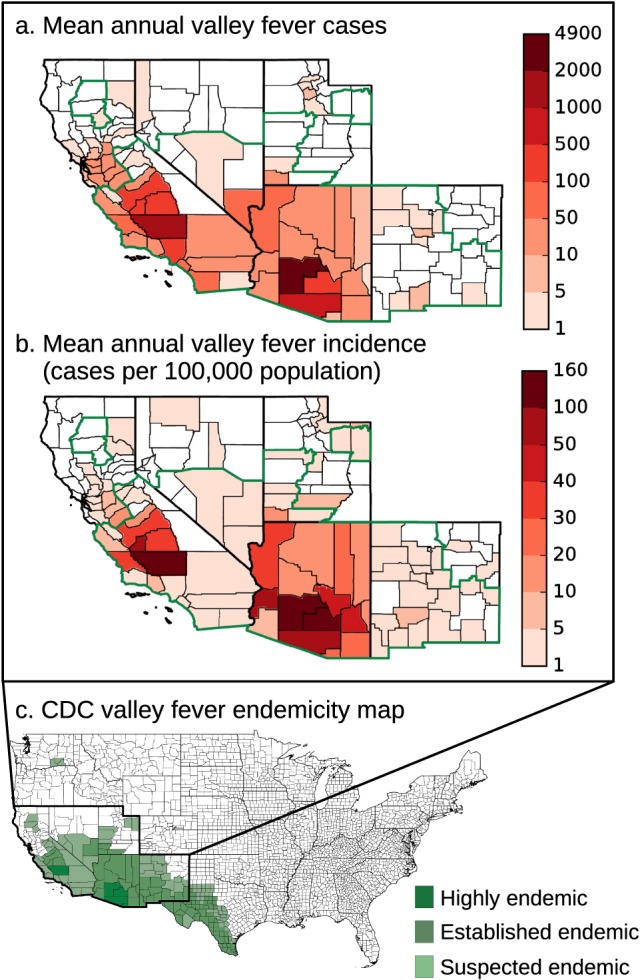
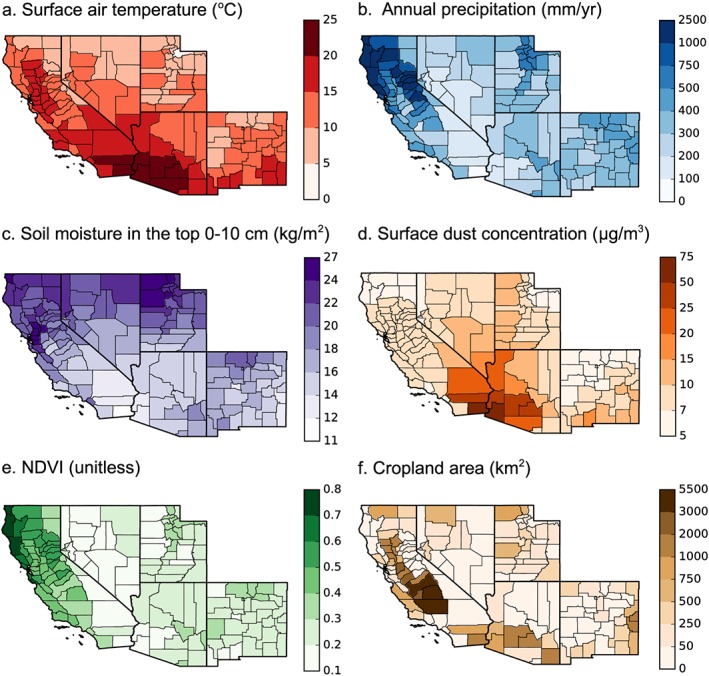
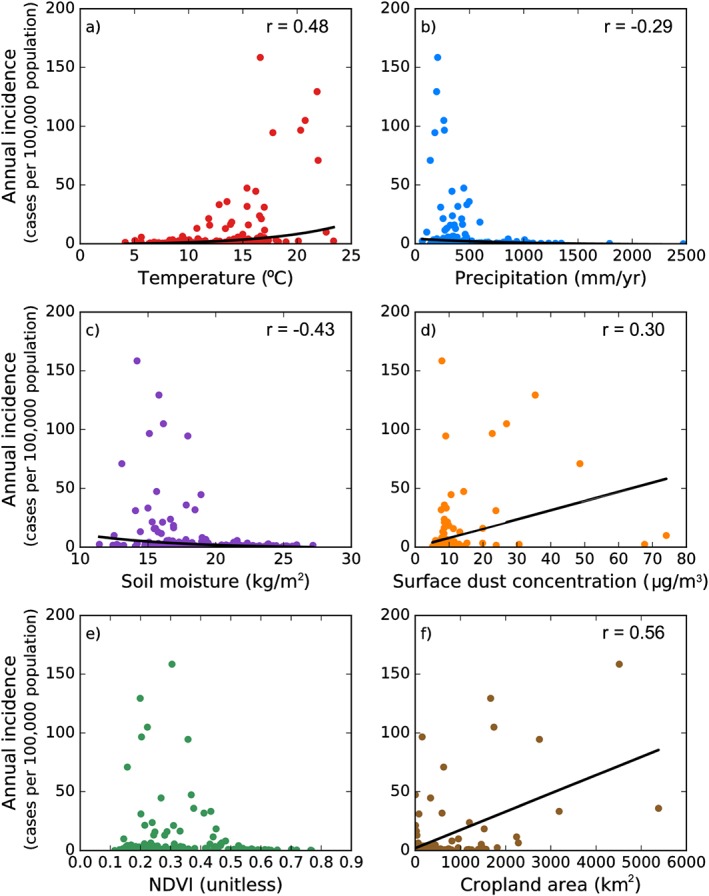
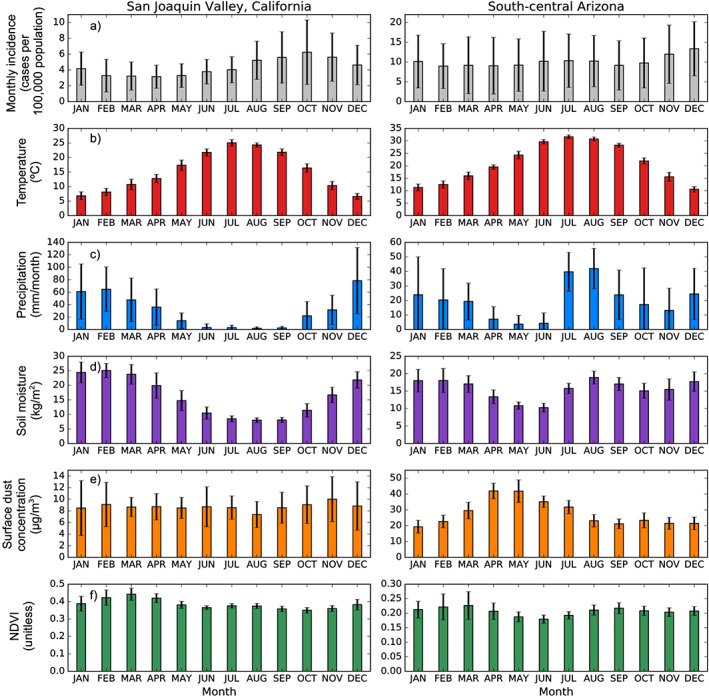
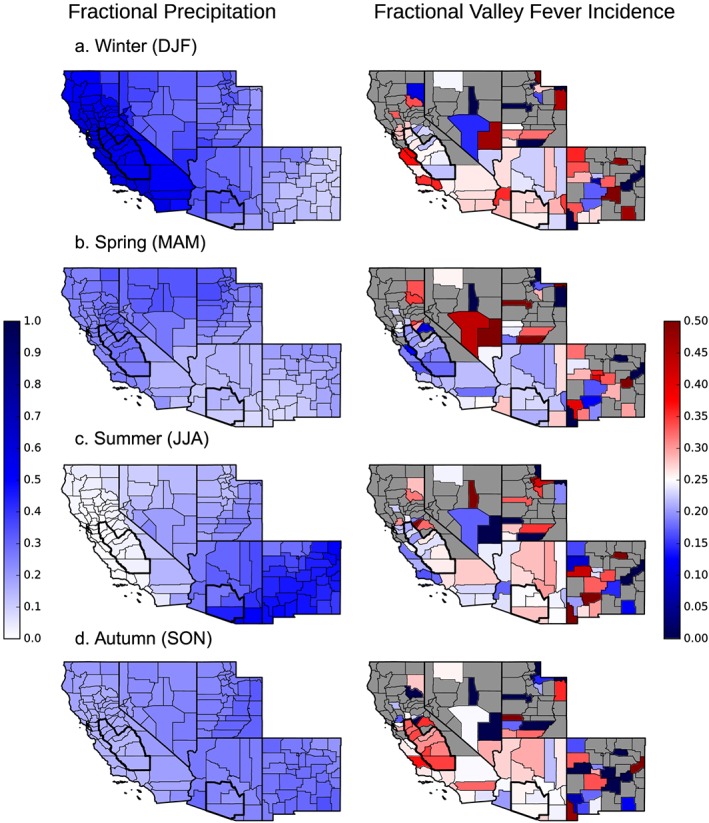
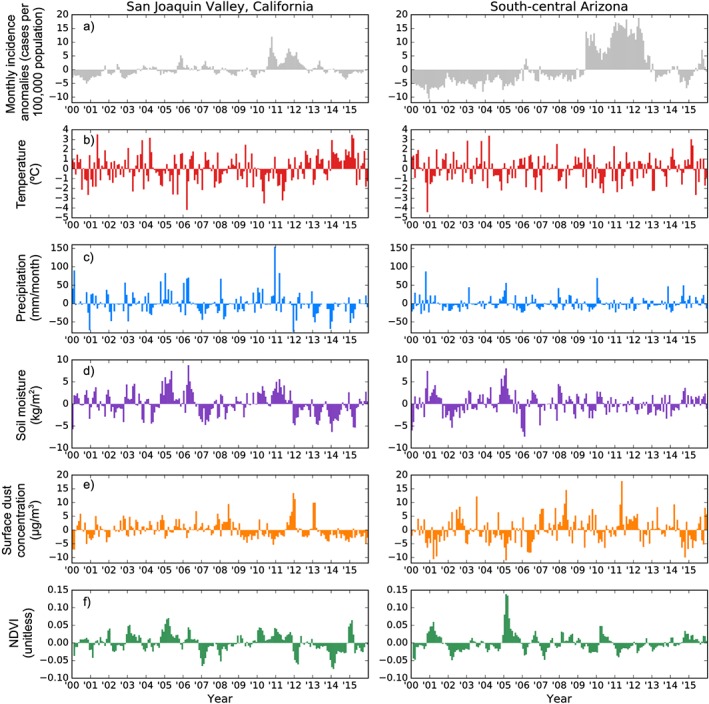
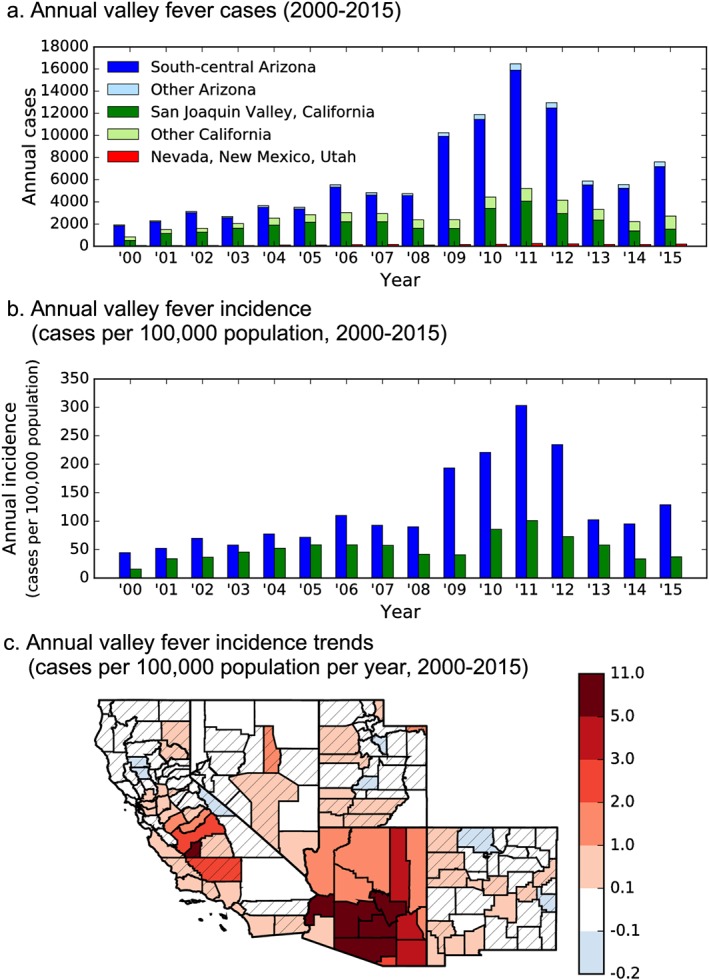
Valley fever is endemic to the southwestern United States. Humans contract this fungal disease by inhaling spores of Coccidioides spp. Changes in the environment can influence the abundance and dispersal of Coccidioides spp., causing fluctuations in valley fever incidence. We combined county-level case records from state health agencies to create a regional valley fever database for the southwestern United States, including Arizona, California, Nevada, New Mexico, and Utah. We used this data set to explore how environmental factors influenced the spatial pattern and temporal dynamics of valley fever incidence during 2000-2015. We compiled climate and environmental geospatial data sets from multiple sources to compare with valley fever incidence. These variables included air temperature, precipitation, soil moisture, surface dust concentration, normalized difference vegetation index, and cropland area. We found that valley fever incidence was greater in areas with warmer air temperatures and drier soils. The mean annual cycle of incidence varied throughout the southwestern United States and peaked following periods of low precipitation and soil moisture. From year-to-year, however, autumn incidence was higher following cooler, wetter, and productive springs in the San Joaquin Valley of California. In southcentral Arizona, incidence increased significantly through time. By 2015, incidence in this region was more than double the rate in the San Joaquin Valley. Our analysis provides a framework for interpreting the influence of climate change on valley fever incidence dynamics. Our results may allow the U.S. Centers for Disease Control and Prevention to improve their estimates of the spatial pattern and intensity of valley fever endemicity.

Keywords: climate; coccidioides; coccidioidomycosis; incidence/epidemiology; mycoses; surveillance/epidemiology.


Conflict of interest statement

The authors declare no conflicts of interest relevant to this study.

Figures

Figure 1
Figure 1
Climate, environmental, and human factors may modulate the abundance of Coccidioides spp. in the soil and air and therefore influence the temporal and spatial patterns of valley fever incidence.
Figure 2
Figure 2
The mean annual maps of valley fever (a) cases and (b) incidence per county from 2000 to 2015 demonstrate that the extent of valley fever differs in some areas than depicted by (c) the CDC (Centers for Disease Control and Prevention, 2017), including the northern San Joaquin Valley and southcentral coast of California. Units are mean annual cases from 2000 to 2015 (Figure 2a) and mean annual incidence from 2000 to 2015 (Figure 2b). Counties considered endemic by the CDC are outlined in green in Figures 2a and 2b.
Figure 3
Figure 3
The mean annual maps of climate and environmental drivers from 2000 to 2015 (except cropland area, which include 2015 data only). (a) Surface air temperature, (b) annual precipitation, (c) average soil moisture in the top 10 cm, (d) surface dust concentration, (e) NDVI, and (f) cropland area.
Figure 4
Figure 4
The spatial relationships between mean annual valley fever incidence and (a) surface air temperature, (b) annual precipitation, (c) average soil moisture in the top 10 cm, (d) surface dust concentration, (e) NDVI, and (f) cropland area. Statistically significant nonlinear relationships for surface air temperature (p < 0.001), annual precipitation (p < 0.001), soil moisture (p < 0.001) and statistically significant linear relationships for surface dust concentration (p < 0.001) and cropland area (p < 0.001) are plotted in black lines. All variables except cropland area are averaged from 2000 to 2015; cropland area is 2015 data only.
Figure 5
Figure 5
Mean annual cycles of valley fever incidence and climate variables in the San Joaquin Valley of California and southcentral Arizona. (a) Monthly valley fever incidence, (b) surface air temperature, (c) monthly precipitation, (d) average soil moisture in the top 10 cm, (e) surface dust concentration, and (f) NDVI. Valley fever incidence reaches seasonal maximums following periods of low environmental moisture. Error bars are the standard deviation of the monthly averages between counties in each subregion.
Figure 6
Figure 6
A seasonality index showing the fraction of annual precipitation and annual valley fever incidence that occurred during each 3 month period. (a) Winter (DJF), (b) spring (MAM), (c) summer (JJA), and (d) autumn (SON) intervals. Counties that averaged less than one valley fever case per 1,000,000 population per year from 2000 to 2015 were masked to reduce the noise associated with small sample sizes.
Figure 7
Figure 7
Monthly climate and valley fever incidence anomalies after removing the mean annual cycle from the original time series for each variable. (a) Valley fever incidence anomalies, (b) surface air temperature anomalies, (c) monthly precipitation anomalies, (d) soil moisture in the top 10 cm anomalies, (e) surface dust concentration anomalies, and (f) NDVI anomalies.
Figure 8
Figure 8
Long‐term trends of valley fever from 2000 to 2015, with relative peaks in 2006 and 2011. (a) Annual cases in California and Arizona are dominated by two subregions of high valley fever cases: the San Joaquin Valley of California and southcentral Arizona, (b) annual incidence in Arizona becomes greater than in California by 2015, and (c) significant changes in annual valley fever incidence occurred throughout the entire state of Arizona and portions of the San Joaquin Valley and southcentral coast of California. Striped counties indicate trends that were not significant at p < 0.10. The units are the change in annual incidence per year.

References

    1. Arizona Department of Health Services (2012). Arizona—Valley fever report, 2007–2011. Arizona Department of Health Services. Phoenix, AZ. Retrieved from http://vfce.arizona.edu/sites/vfce/files/5-year-review-07-11.pdf
    1. Arizona Department of Health Services (2013). Valley fever 2012 annual report. Arizona Department of Health Services. Phoenix, AZ. Retrieved from http://www.azdhs.gov/documents/preparedness/epidemiology-disease-control...
    1. Baptista‐Rosas, R. C. , Catalán‐Dibene, J. , Romero‐Olivares, A. L. , Hinojosa, A. , Cavazos, T. , & Riquelme, M. (2012). Molecular detection of Coccidioides spp. from environmental samples in Baja California: Linking valley fever to soil and climate conditions. Fungal Ecology, 5(2), 177–190. 10.1016/j.funeco.2011.08.004 - DOI
    1. Baptista‐Rosas, R. C. , Hinojosa, A. , & Riquelme, M. (2007). Ecological niche modeling of Coccidioides spp. in western North American deserts. Annals of the New York Academy of Sciences, 1111(1), 35–46. 10.1196/annals.1406.003 - DOI - PubMed
    1. Barker, B. M. , Tabor, J. A. , Shubitz, L. F. , Perrill, R. , & Orbach, M. J. (2012). Detection and phylogenetic analysis of Coccidioides posadasii in Arizona soil samples. Fungal Ecology, 5(2), 163–176. 10.1016/j.funeco.2011.07.010 - DOI