. 2018 Jul 3;2(7):212-223.
doi: 10.1029/2017GH000127. eCollection 2018 Jul.

Heat, Disparities, and Health Outcomes in San Diego County's Diverse Climate Zones

Affiliations

Heat, Disparities, and Health Outcomes in San Diego County's Diverse Climate Zones

Kristen Guirguis et al. Geohealth. .

Abstract

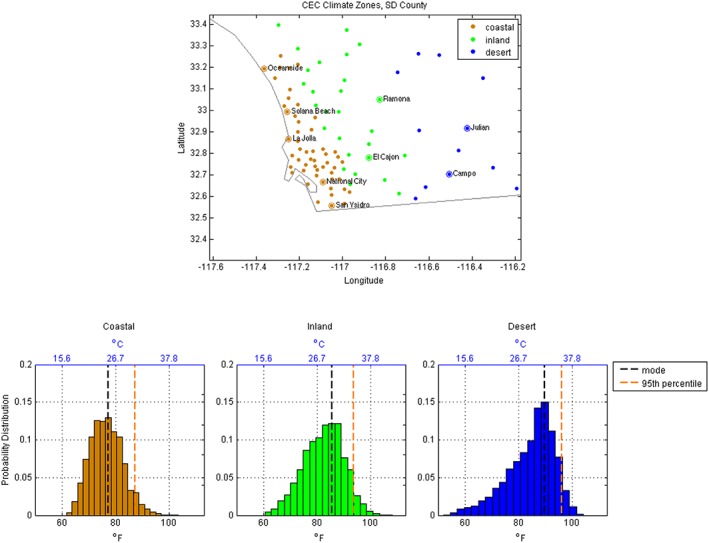
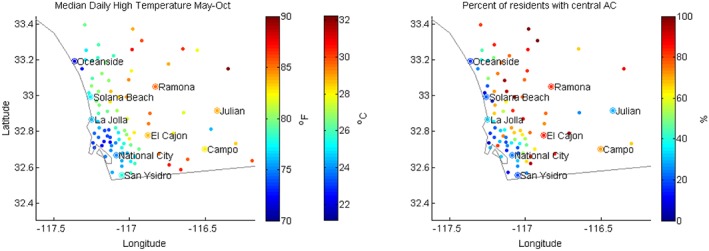
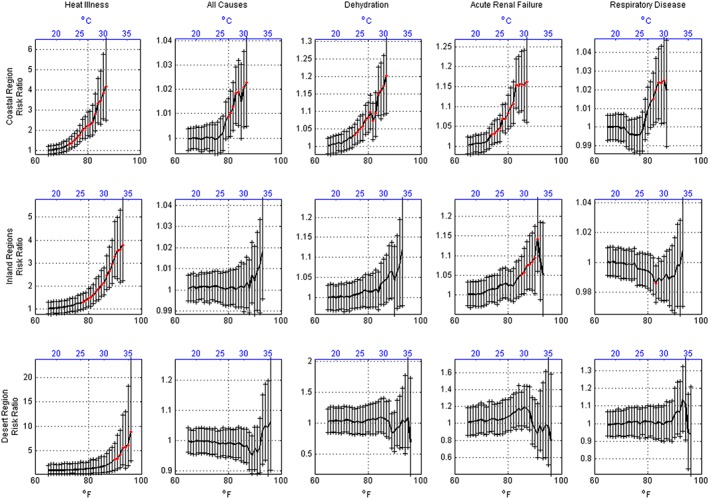
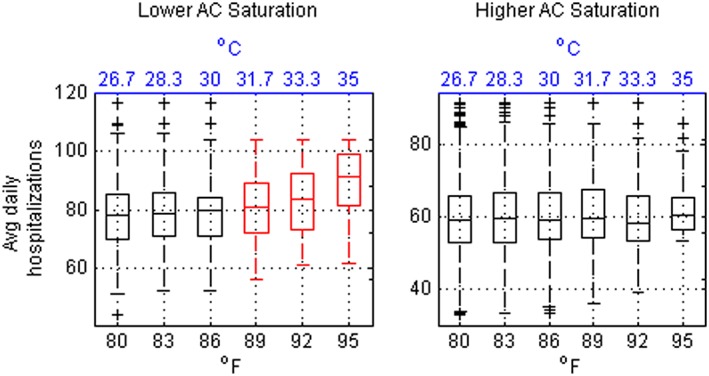
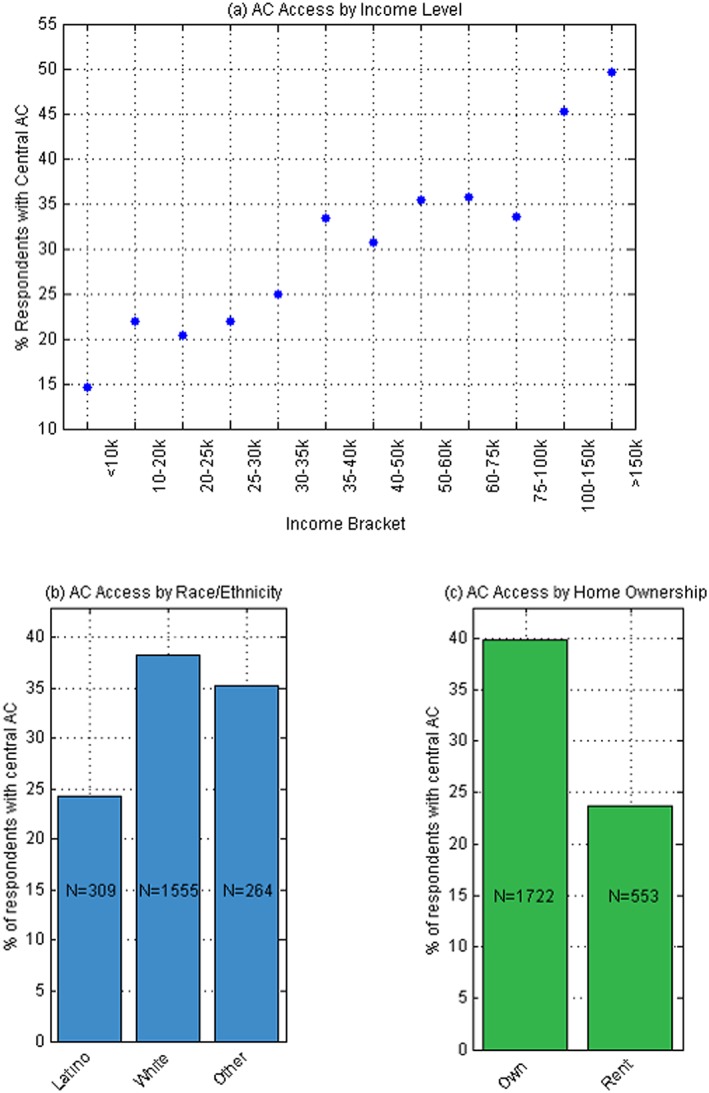
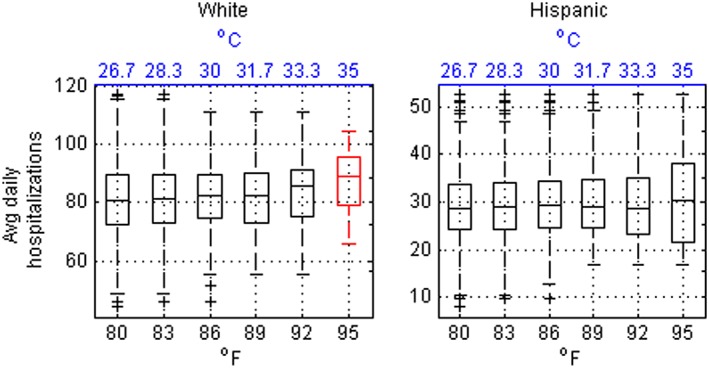
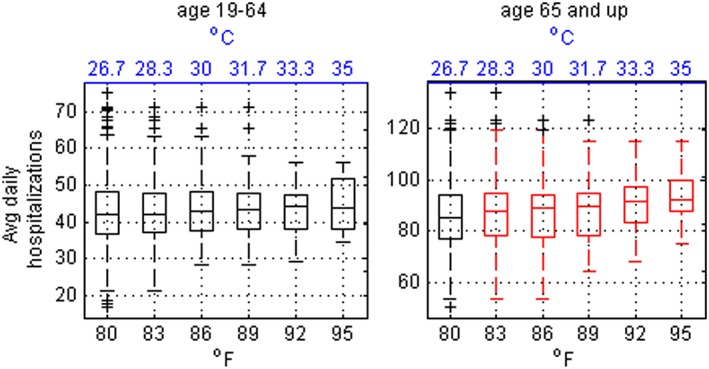
Climate variability and change are issues of growing public health importance. Numerous studies have documented risks of extreme heat on human health in different locations around the world. Strategies to prevent heat-related morbidity and reduce disparities are possible but require improved knowledge of health outcomes during hot days at a small-scale level as important within-city variability in local weather conditions, socio-demographic composition, and access to air conditioning (AC) may exist. We analyzed hospitalization data for three unique climate regions of San Diego County alongside temperature data spanning 14 years to quantify the health impact of ambient air temperature at varying exceedance threshold levels. Within San Diego, coastal residents were more sensitive to heat than inland residents. At the coast, we detected a health impact at lower temperatures compared to inland locations for multiple disease categories including heat illness, dehydration, acute renal failure, and respiratory disease. Within the milder coastal region where access to AC is not prevalent, heat-related morbidity was higher in the subset of zip codes where AC saturation is lowest. We detected a 14.6% increase (95% confidence interval [4.5%, 24.6%]) in hospitalizations during hot weather in comparison to colder days in coastal locations where AC is less common, while no significant impact was observed in areas with higher AC saturation. Disparities in AC ownership were associated with income, race/ethnicity, and homeownership. Given that heat waves are expected to increase with climate change, understanding health impacts of heat and the role of acclimation is critical for improving outcomes in the future.

Keywords: air conditioning; climate zones; disparities; health outcomes; heat extremes; temperature.


Conflict of interest statement

The authors declare no conflicts of interest relevant to this study.

Figures

Figure 1
Figure 1
Top panel shows the three climate zones used in this study based on the California Energy Commission (2015) shown here interpolated to zip code. Lower panels show the warm season T max distribution along with the mode and 95th percentile for each climate zone. The black (blue) temperature scales along the lower (upper) horizontal axis give units in °F (°C).
Figure 2
Figure 2
Median daily maximum temperatures during May–October (left) and AC access in San Diego County showing the percent of local residents who reported having central AC in their homes (right).
Figure 3
Figure 3
Health impact observed for three regions of San Diego County associated with increasing daily maximum temperature threshold levels. The risk ratio was calculated as the average excess hospitalizations observed on days exceeding a given T max temperature threshold compared to the average observed over the all days, independent of any temperature threshold. Error bars give the 95% confidence interval for the estimate. Red markers indicate statistical significance at the 95% level using Monte Carlo resampling. A significant value means the estimate was found to be above the 95th percentile of the resampled distribution.
Figure 4
Figure 4
Daily average hospitalizations for zip codes within the Coastal region for days exceeding a given T max temperature threshold. The left plot shows distributions for zip codes with lower AC saturation and the right plot shows distributions for zip codes with higher AC saturation. Boxplots colored in red are significantly different (α = 0.05, t‐test for unequal means) from a reference taken as days cooler than 75 °F. The AC saturation level is defined as below or above the coastal zone median. Results are for the all causes category. Sample size information is provided in Table 1.
Figure 5
Figure 5
The percent of RASS respondents with central air conditioning in the Coastal region according to income level (a), race/ethnicity (b), and homeownership (c). The race/ethnicity category “Other” refers to American Indians, Asian/Pacific Islanders, and Blacks, which were combined due to small sample size. There were 25,721 RASS respondents in the Coastal region. RASS = Residential Appliance Saturation Study.
Figure 6
Figure 6
As in Figure 4 but for Whites (left) and Hispanics (right) living in the Coastal region. Sample size information is provided in Tables 1 and 2.
Figure 7
Figure 7
As in Figure 4 but for different age categories within the Coastal region.

References

    1. Anderson, G. B. , & Bell, M. L. (2011). Heat waves in the United States: Mortality risk during heat waves and effect modification by heat wave characteristics in 43 US communities. Environmental Health Perspectives, 119(2), 210. - PMC - PubMed
    1. Astrom, D. O. , Bertil, F. , & Joacim, R. (2011). Heat wave impact on morbidity and mortality in the elderly population: A review of recent studies. Maturitas, 69(2), 99–105. 10.1016/j.maturitas.2011.03.008 - DOI - PubMed
    1. Basu, R. (2009). High ambient temperature and mortality: A review of epidemiological studies from 2001 to 2008. Environmental Health, 8(40). 10.1186/1476-069X-8-40 - DOI - PMC - PubMed
    1. Basu, R. , & Malig, B. (2011). High ambient temperature and mortality in California: Exploring the roles of age, disease, and mortality displacement. Environmental Research, 111, 1286–1292. - PubMed
    1. Basu, R. , Pearson, D. , Malig, B. , Broadwin, R. , & Green, S. (2012). The effect of elevated ambient temperature on emergency room visits. Epidemiology, 23, 813–820. - PubMed