. 2018 Aug 3;2(8):229-247.
doi: 10.1029/2018GH000144. eCollection 2018 Aug.

Future Fire Impacts on Smoke Concentrations, Visibility, and Health in the Contiguous United States

Affiliations

Future Fire Impacts on Smoke Concentrations, Visibility, and Health in the Contiguous United States

B Ford et al. Geohealth. .

Abstract

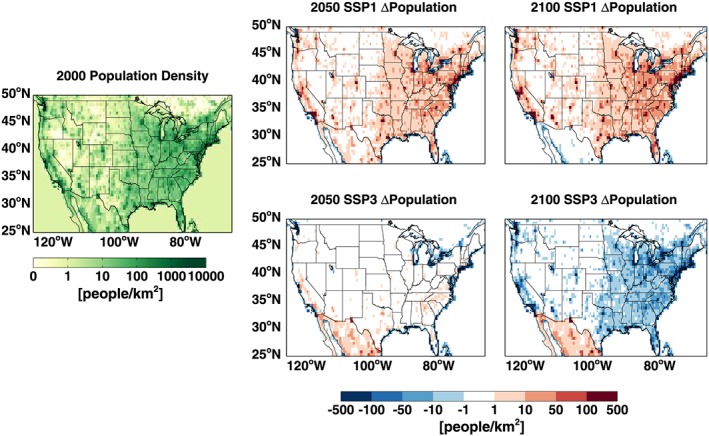
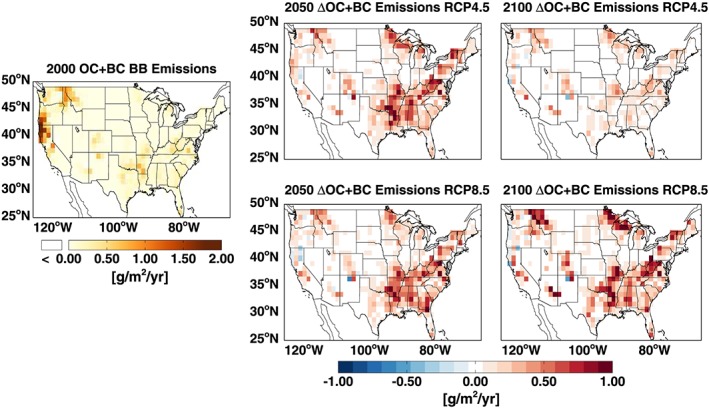
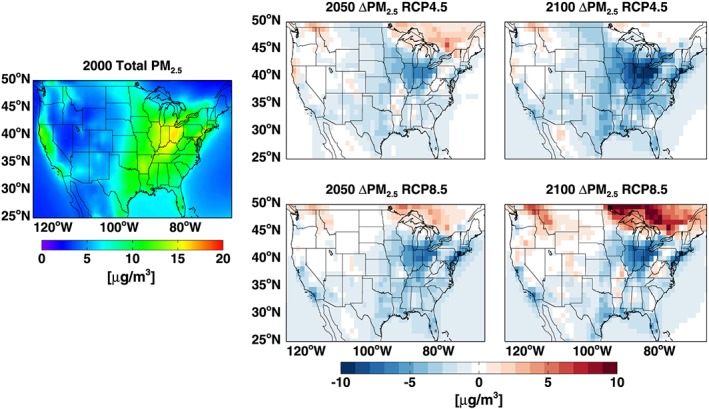
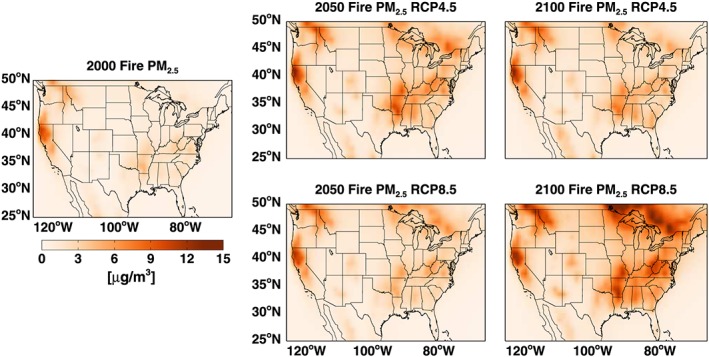
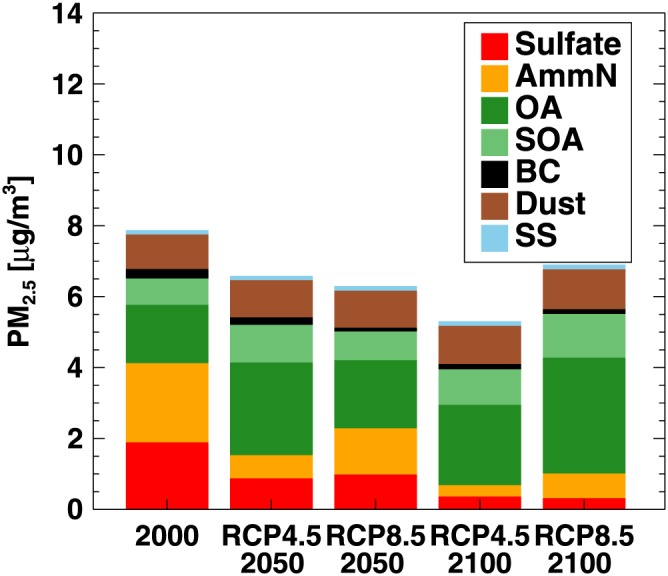
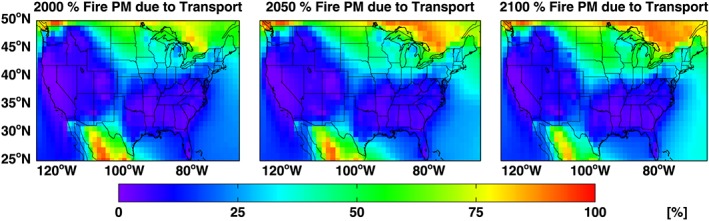
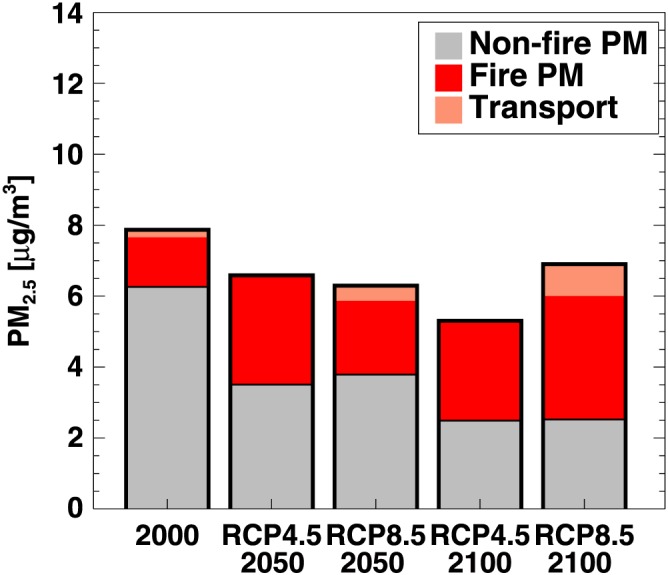
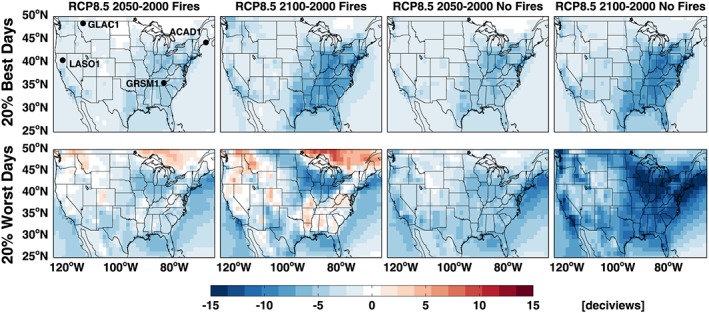
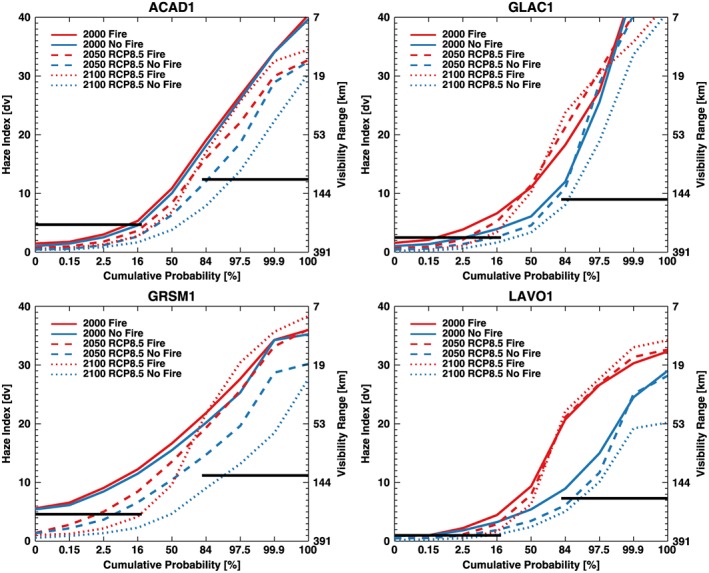
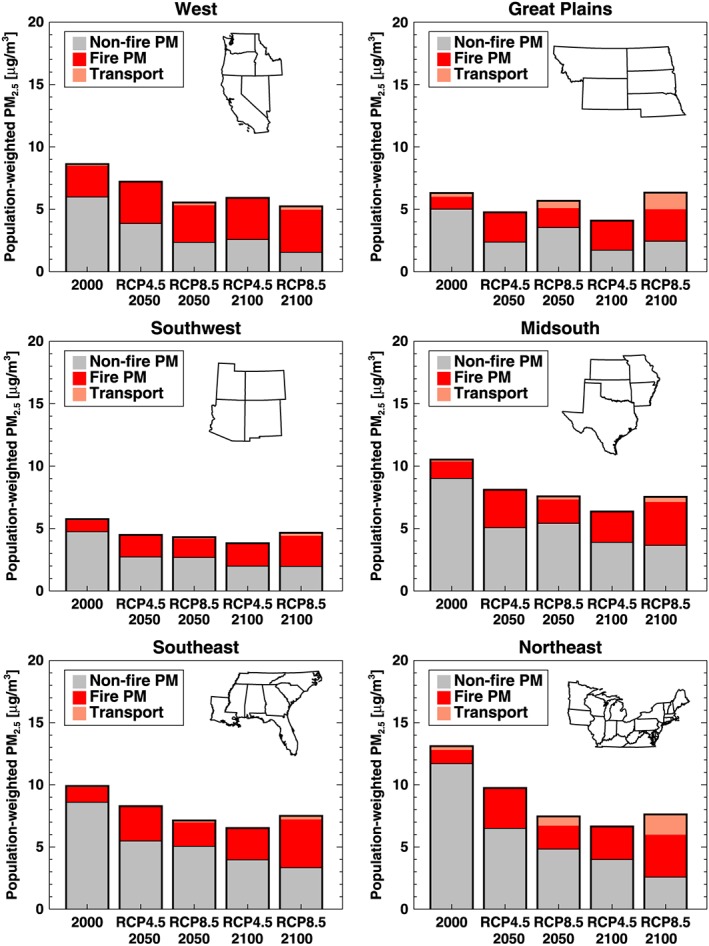
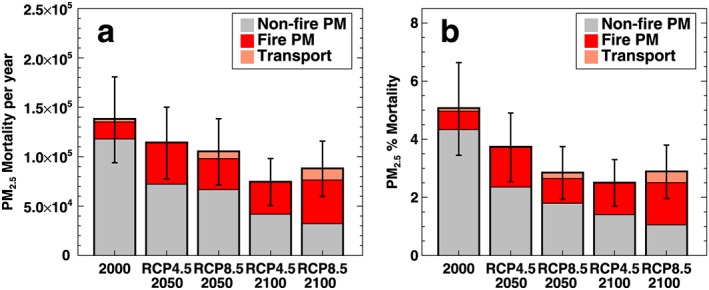
Fine particulate matter (PM2.5) from U.S. anthropogenic sources is decreasing. However, previous studies have predicted that PM2.5 emissions from wildfires will increase in the midcentury to next century, potentially offsetting improvements gained by continued reductions in anthropogenic emissions. Therefore, some regions could experience worse air quality, degraded visibility, and increases in population-level exposure. We use global climate model simulations to estimate the impacts of changing fire emissions on air quality, visibility, and premature deaths in the middle and late 21st century. We find that PM2.5 concentrations will decrease overall in the contiguous United States (CONUS) due to decreasing anthropogenic emissions (total PM2.5 decreases by 3% in Representative Concentration Pathway [RCP] 8.5 and 34% in RCP4.5 by 2100), but increasing fire-related PM2.5 (fire-related PM2.5 increases by 55% in RCP4.5 and 190% in RCP8.5 by 2100) offsets these benefits and causes increases in total PM2.5 in some regions. We predict that the average visibility will improve across the CONUS, but fire-related PM2.5 will reduce visibility on the worst days in western and southeastern U.S. regions. We estimate that the number of deaths attributable to total PM2.5 will decrease in both the RCP4.5 and RCP8.5 scenarios (from 6% to 4-5%), but the absolute number of premature deaths attributable to fire-related PM2.5 will double compared to early 21st century. We provide the first estimates of future smoke health and visibility impacts using a prognostic land-fire model. Our results suggest the importance of using realistic fire emissions in future air quality projections.


Figures

Figure 1
Figure 1
Figure shows the current CONUS population density (average 2006–2010) and the changes in population density projected in 2050 (average of 2040–2050) and 2100 (average of 2090–2100) by the SSP1 and SSP3 projections.
Figure 2
Figure 2
Early 21st century (2000), decadal average OC and BC BB emissions for the CONUS, and the changes for 2040–2050 and 2090–2100 projected with the RCP4.5 and RCP8.5 scenarios.
Figure 3
Figure 3
Total surface PM2.5 concentrations in the CONUS for early 21st century, and the projected change (compared to early 21st century) in surface PM2.5 concentrations by midcentury and late century from the baseline CESM simulations using the RCP4.5 and RCP8.5 scenarios.
Figure 4
Figure 4
Simulated decadal average PM2.5 concentrations due to fire emissions from the land model in 2000 and as projected in 2050 and 2100 in the RCP4.5 and RCP8.5 simulations (with the land model fire emissions).
Figure 5
Figure 5
Average (decadal means) PM2.5 concentrations over the CONUS separated by species for early 21st century, midcentury, and late century from the RCP4.5 and RCP8.5 scenarios.
Figure 6
Figure 6
Percent of smoke PM2.5 due to transport (fires outside the CONUS) for 2000 and in 2050 and 2100 with the RCP8.5 scenario.
Figure 7
Figure 7
Decadal average PM2.5 concentrations over the CONUS separated by source (nonfire, fire, and AK/HI/Mexico/Canadian transported smoke from fires) for early 21st century, midcentury, and late century from the RCP4.5 and RCP8.5 scenarios (simulations to determine transported smoke were only conducted for RCP8.5 scenario).
Figure 8
Figure 8
Change in the haze index calculated for the average of the (top row) 20% best and (bottom row) 20% worst days by 2050 and 2100 in the RCP8.5 scenario determined from our baseline simulation (“fires”) and our FireOff simulation (“no fires”). Sites in Figure 9 are labeled as follows: Acadia National Park in ME (ACAD1), Great Smoky Mountains National Park in TN (GRSM1), and Lassen Volcanic National Park in northern CA (LAVO1).
Figure 9
Figure 9
Cumulative probability distributions of the haze index (equation (3)) and visibility range (equation (4)) at Acadia National Park in ME (ACAD1), Great Smoky Mountains National Park in TN (GRSM1), and Lassen Volcanic National Park in northern CA (LAVO1) for our different RCP8.5 model simulations and time periods. The solid black lines show the 2064 HI targets for the clearest (average of bottom 20%) and haziest (average of top 20%) days at each site. Location of sites is noted in Figure 8.
Figure 10
Figure 10
Decadal average of the annual population‐weighted PM2.5 concentrations for different regions of the CONUS (as defined in Val Martin et al., 2015) separated by source (nonfire, fire, and transported smoke from fires) for early 21st century (2000), midcentury (2050), and late century (2100) from the RCP4.5 and RCP8.5 scenarios (simulations to determine transported smoke were only conducted for the early 21st century and RCP8.5 projection scenarios).
Figure 11
Figure 11
(a) Number and (b) percent of premature deaths attributable to PM2.5 per year in 2000, 2050, and 2100 following the RCP4.5 and RCP8.5 scenarios and separated by source (nonfire, fire, and transported smoke). The black lines show the estimate range for the total attributable deaths from the RR CIs.

References

    1. Anenberg, S. C. , Horowitz, L. W. , Tong, D. Q. , & West, J. J. (2010). An estimate of the global burden of anthropogenic ozone and fine particulate matter on premature human mortality using atmospheric modeling. Environmental Health Perspectives, 118(9), 1189–1195. 10.1289/ehp.0901220 - DOI - PMC - PubMed
    1. Anenberg, S. C. , West, J. J. , Yu, H. , Chin, M. , Schulz, M. , Bergmann, D. , et al. (2014). Impacts of intercontinental transport of anthropogenic fine particulate matter on human mortality. Air Quality, Atmosphere and Health, 7(3), 369–379. 10.1007/s11869-014-0248-9 - DOI
    1. Balch, J. K. , Bradley, B. A. , Abatzoglou, J. T. , Nagy, R. C. , Fusco, E. J. , & Mahood, A. L. (2017). Human‐started wildfires expand the fire niche across the United States. Proceedings of the National Academy of Sciences, 114(11), 2946–2951. 10.1073/pnas.1617394114 - DOI - PMC - PubMed
    1. Burnett, R. T. , Pope, C. A. III , Ezzati, M. , Olives, C. , Lim, S. S. , Mehta, S. , et al. (2014). An integrated risk function for estimating the global burden of disease attributable to ambient fine particulate matter exposure. Environmental Health Perspectives. 10.1289/ehp.1307049 - DOI - PMC - PubMed
    1. Crouse, D. L. , Peters, P. A. , van Donkelaar, A. , Goldberg, M. S. , Villeneuve, P. J. , Brion, O. , et al. (2012). Risk of nonaccidental and cardiovascular mortality in relation to long‐term exposure to low concentrations of fine particulate matter: A Canadian National‐Level Cohort Study. Environmental Health Perspectives, 120(5), 708–714. 10.1289/ehp.1104049 - DOI - PMC - PubMed

LinkOut - more resources