

Spatial-Temporal Assessment of Environmental Factors Related to Dengue Outbreaks in São Paulo, Brazil
- PMID: 32159042
- PMCID: PMC7007072
- DOI: 10.1029/2019GH000186
Spatial-Temporal Assessment of Environmental Factors Related to Dengue Outbreaks in São Paulo, Brazil
Abstract
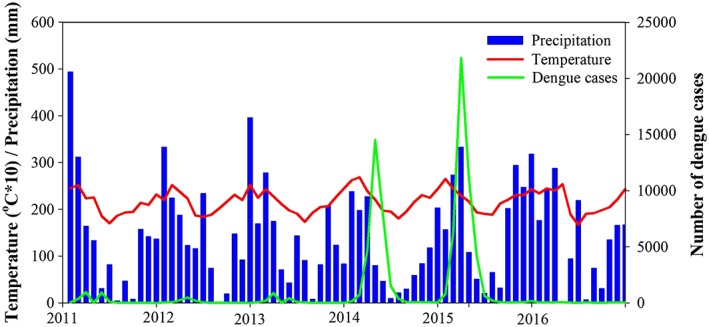
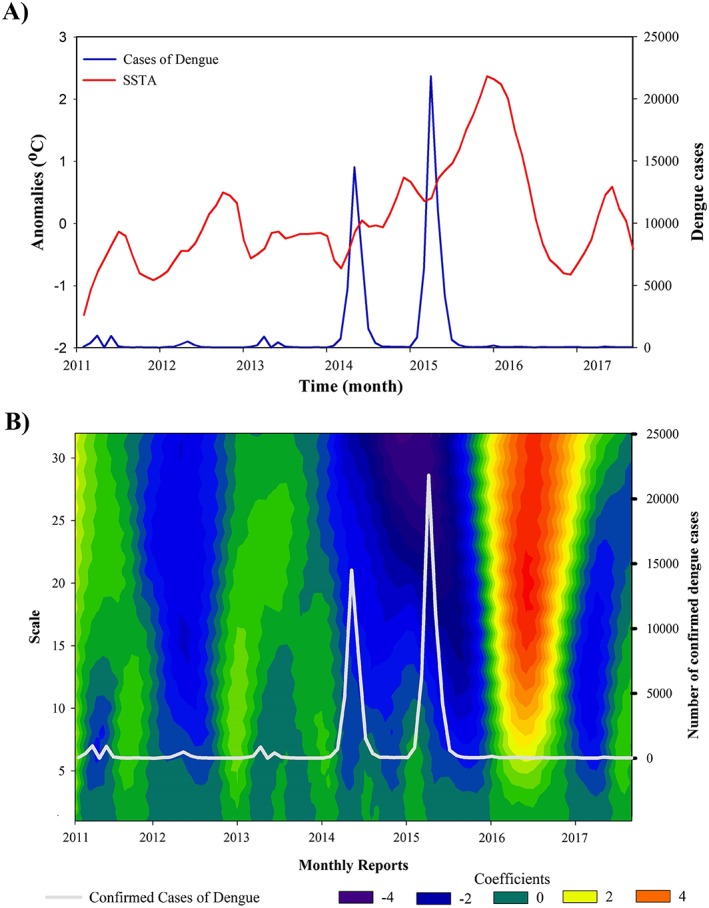
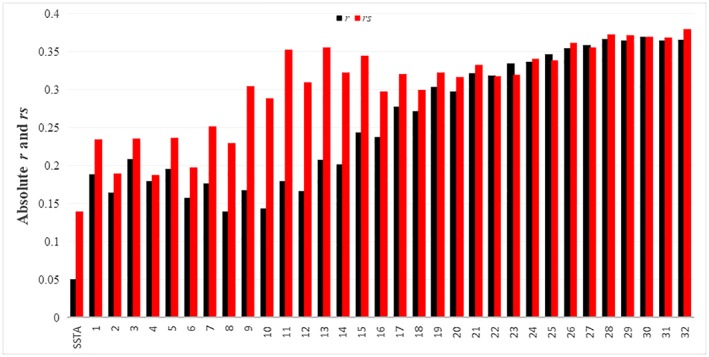
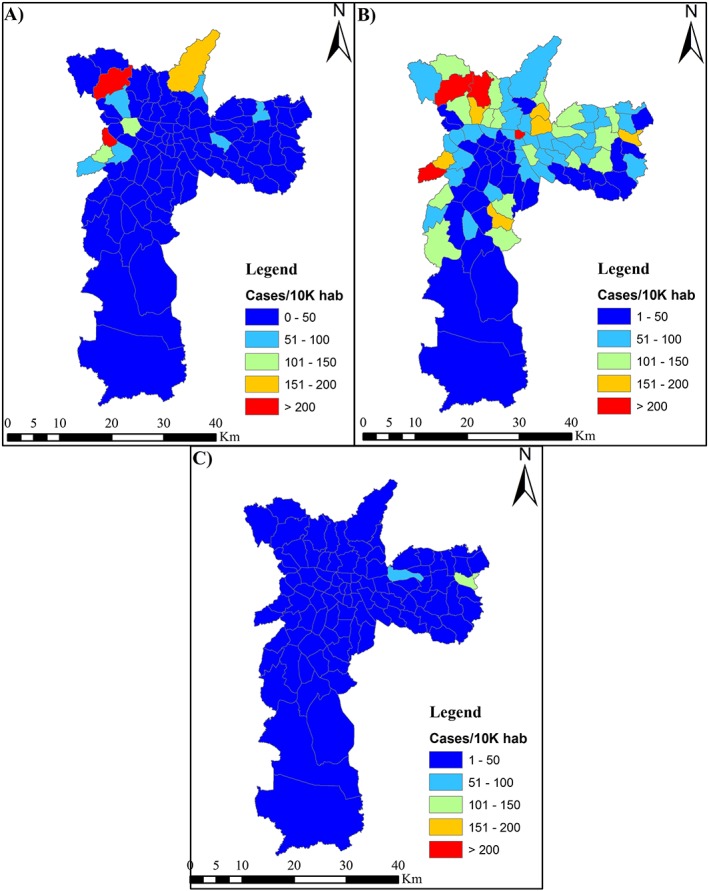
Dengue fever, a disease caused by a vector-borne flavivirus, is endemic to tropical countries, but its occurrence has been reported worldwide. This study aimed to understand important factors contributing to the spatial and temporal patterns of dengue occurrence in São Paulo, the largest municipality of Brazil. The temporal assessment of dengue occurrence covered the 2011-2016 time period and was based on climatological data, such as the El Niño indices and time series statistical tools such as the continuous wavelet transformation. The spatial assessment used Landsat 8 data for years 2014-2016 to estimate land surface temperature and normalized indices for vegetation, urban areas, and leaf water. Results from a cross correlation for the temporal analysis found a relationship between the sea surface temperature anomalies index and the number of reported dengue cases in São Paulo (r = 0.5) with a lag of +29 (weeks) between the climatic event and the response on the dengue incidence. This relationship, initially nonlinear, became linear after correcting for the lag period. For the spatial assessment, the linear stepwise regression model detected a low relationship between dengue incidence and minimum surface temperature (r = 0.357) and no relationship with other environmental parameters. The poor relationship might be due to confounding effects of socioeconomic factors as these seem to influence the spatial dynamics of dengue incidence. More testing is needed to validate these methods in other locations. Nevertheless, we presented possible tools to be used for the improvement of dengue control programs.
Keywords: El Niño; Landsat 8; continuous wavelet transformation; dengue; land surface temperature; remote sensing indices.
©2019. The Authors.
Conflict of interest statement
The authors declare no actual or perceived conflicts of interest.
Figures


References
-
- Aceituno, P. (1988). On the functioning of the Southern Oscillation in the South American sector. Part I: Surface climate. Monthly Weather Review, 116, 505–524.
-
- Alvares, C. A. , Stape, J. L. , Sentelhas, P. C. , de Moraes‐Gonçalves, J. L. , & Sparovek, G. (2014). Köppen's climate classification map for Brazil. Meteorologische Zeitschrift, 22(6), 711–728. 10.1127/0941-2948/2013/0507 - DOI
-
- Ashby, J. , Moreno‐Madriñán, M. J. , Yiannoutsos, C. T. , & Stanforth, A. (2017). Niche modeling of dengue fever using remotely sensed environmental factors and boosted regression trees. Remote Sensing, 9, 328 10.3390/rs9040328 - DOI
LinkOut - more resources
Full Text Sources