

Native LESA TWIMS-MSI: Spatial, Conformational, and Mass Analysis of Proteins and Protein Complexes
- PMID: 32159346
- PMCID: PMC7147347
- DOI: 10.1021/jasms.9b00122
Native LESA TWIMS-MSI: Spatial, Conformational, and Mass Analysis of Proteins and Protein Complexes
Abstract
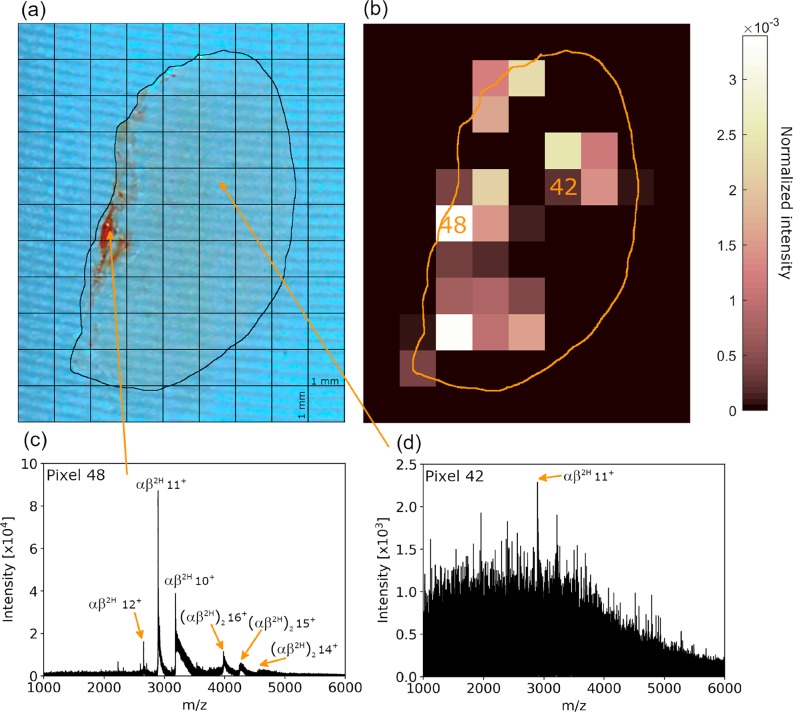
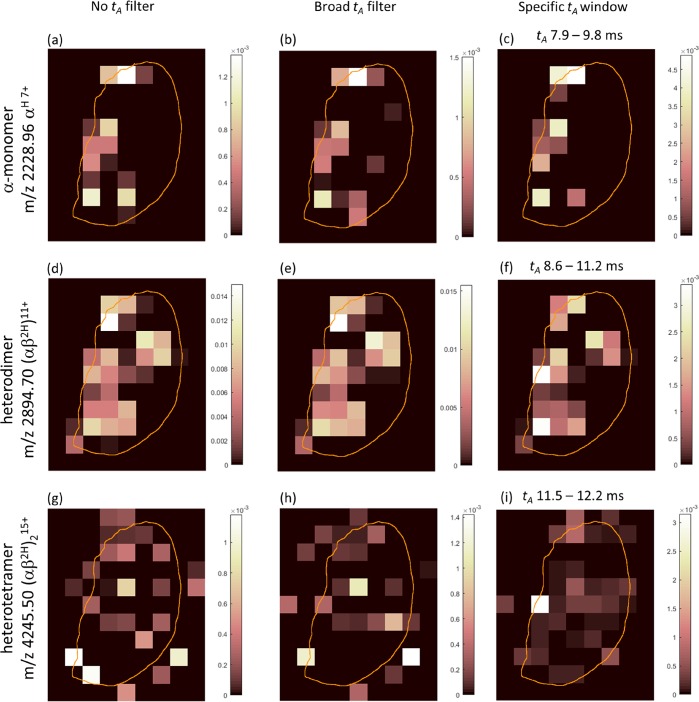
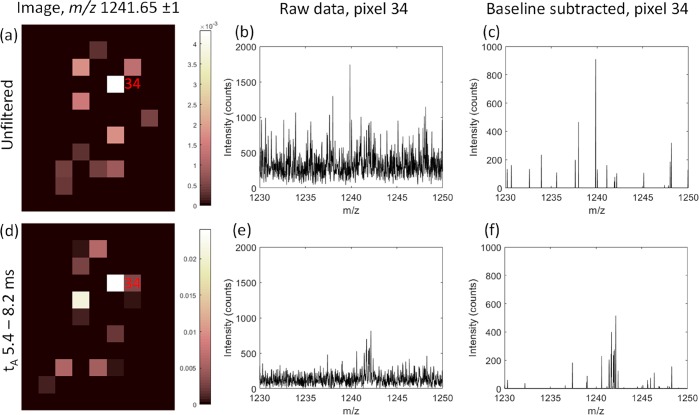
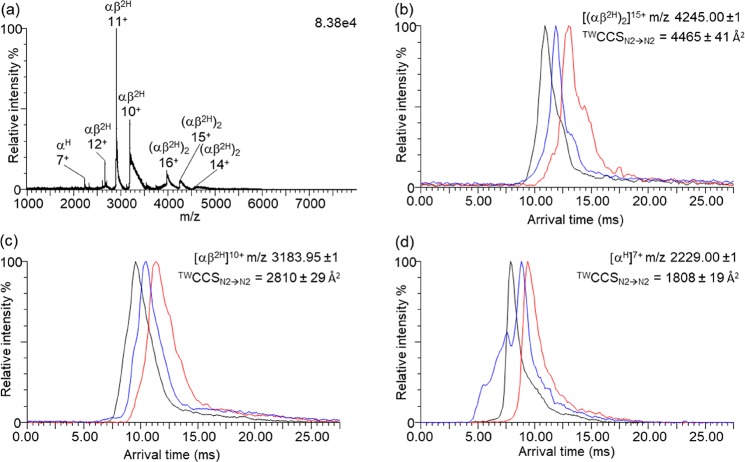
We have previously demonstrated native liquid extraction surface analysis (LESA) mass spectrometry imaging of small intact proteins in thin tissue sections. We also showed calculation of collision cross sections for specific proteins extracted from discrete locations in tissue by LESA traveling wave ion mobility spectrometry (TWIMS). Here, we demonstrate an integrated native LESA TWIMS mass spectrometry imaging (MSI) workflow, in which ion mobility separation is central to the imaging experiment and which provides spatial, conformational, and mass information on endogenous proteins in a single experiment. The approach was applied to MSI of a thin tissue section of mouse kidney. The results show that the benefits of integration of TWIMS include improved specificity of the ion images and the capacity to calculate collision cross sections for any protein or protein complex detected in any pixel (without a priori knowledge of the presence of the protein).
Conflict of interest statement
The authors declare no competing financial interest.
Figures
Similar articles
-
LESA Cyclic Ion Mobility Mass Spectrometry of Intact Proteins from Thin Tissue Sections.Anal Chem. 2020 May 5;92(9):6321-6326. doi: 10.1021/acs.analchem.9b05169. Epub 2020 Apr 27. Anal Chem. 2020. PMID: 32271006 Free PMC article.
-
Probing the Fundamentals of Native Liquid Extraction Surface Analysis Mass Spectrometry of Proteins: Can Proteins Refold during Extraction?Anal Chem. 2019 Oct 1;91(19):12246-12254. doi: 10.1021/acs.analchem.9b02075. Epub 2019 Sep 19. Anal Chem. 2019. PMID: 31490666 Free PMC article.
-
LESA MS Imaging of Heat-Preserved and Frozen Tissue: Benefits of Multistep Static FAIMS.Anal Chem. 2018 Nov 20;90(22):13306-13314. doi: 10.1021/acs.analchem.8b02739. Epub 2018 Oct 29. Anal Chem. 2018. PMID: 30350618
-
Ambient surface mass spectrometry-ion mobility spectrometry of intact proteins.Curr Opin Chem Biol. 2018 Feb;42:67-75. doi: 10.1016/j.cbpa.2017.11.002. Epub 2018 Jan 16. Curr Opin Chem Biol. 2018. PMID: 29166625 Review.
-
Ion mobility-mass spectrometry as a tool to investigate protein-ligand interactions.Anal Bioanal Chem. 2017 Jul;409(18):4305-4310. doi: 10.1007/s00216-017-0384-9. Epub 2017 May 13. Anal Bioanal Chem. 2017. PMID: 28500372 Review.
Cited by
-
Spatial top-down proteomics for the functional characterization of human kidney.Clin Proteomics. 2025 Mar 5;22(1):9. doi: 10.1186/s12014-025-09531-x. Clin Proteomics. 2025. PMID: 40045235 Free PMC article.
-
Biological mass spectrometry enables spatiotemporal 'omics: From tissues to cells to organelles.Mass Spectrom Rev. 2024 Jan-Feb;43(1):106-138. doi: 10.1002/mas.21824. Epub 2023 Jan 16. Mass Spectrom Rev. 2024. PMID: 36647247 Free PMC article. Review.
-
Nano-DESI Mass Spectrometry Imaging of Proteoforms in Biological Tissues with High Spatial Resolution.Anal Chem. 2023 Mar 28;95(12):5214-5222. doi: 10.1021/acs.analchem.2c04795. Epub 2023 Mar 14. Anal Chem. 2023. PMID: 36917636 Free PMC article.
-
Native Ambient Mass Spectrometry Enables Analysis of Intact Endogenous Protein Assemblies up to 145 kDa Directly from Tissue.Anal Chem. 2022 Apr 12;94(14):5608-5614. doi: 10.1021/acs.analchem.1c05353. Epub 2022 Mar 31. Anal Chem. 2022. PMID: 35358391 Free PMC article.
-
Spatial top-down proteomics for the functional characterization of human kidney.bioRxiv [Preprint]. 2024 Jul 5:2024.02.13.580062. doi: 10.1101/2024.02.13.580062. bioRxiv. 2024. Update in: Clin Proteomics. 2025 Mar 5;22(1):9. doi: 10.1186/s12014-025-09531-x. PMID: 38405958 Free PMC article. Updated. Preprint.
References
-
- Fernandez de la Mora J. Electrospray ionization of large multiply charged species proceeds via Dole’s charged residue mechanism. Anal. Chim. Acta 2000, 406, 93–104. 10.1016/S0003-2670(99)00601-7. - DOI
MeSH terms
Substances
LinkOut - more resources
Full Text Sources
