. 2020 Mar 11:9:e50240.
doi: 10.7554/eLife.50240.

Adjusting for age improves identification of gut microbiome alterations in multiple diseases

Affiliations

Adjusting for age improves identification of gut microbiome alterations in multiple diseases

Tarini S Ghosh et al. Elife. .

Abstract

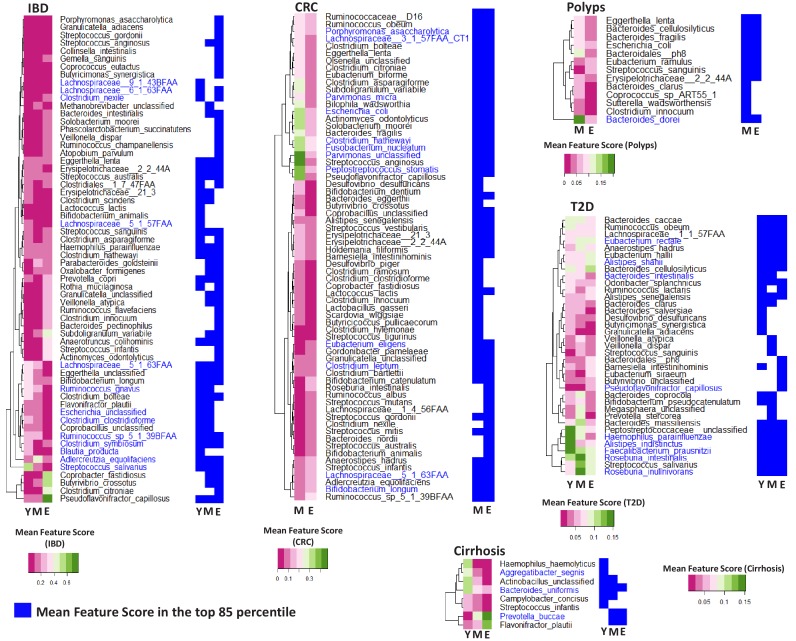
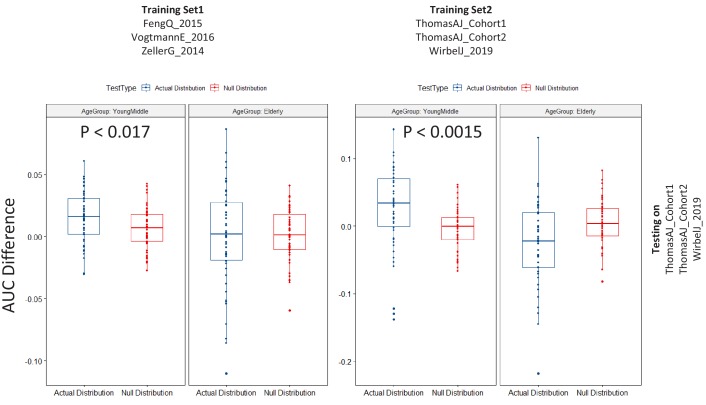
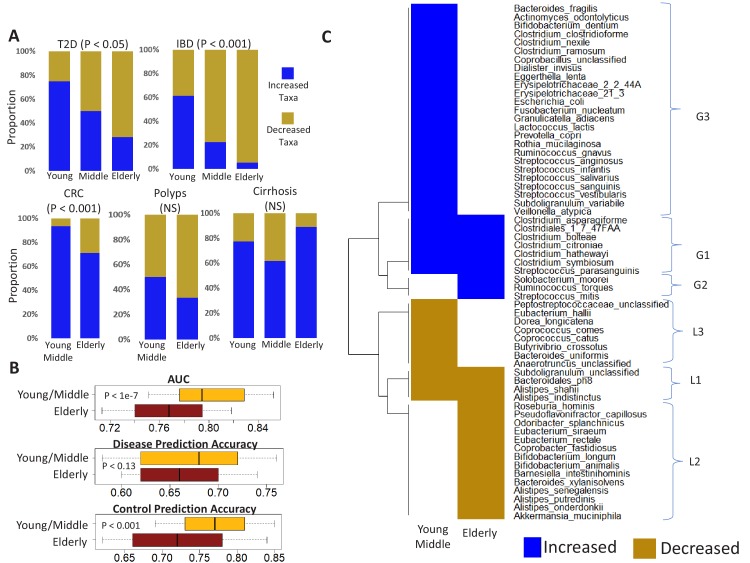
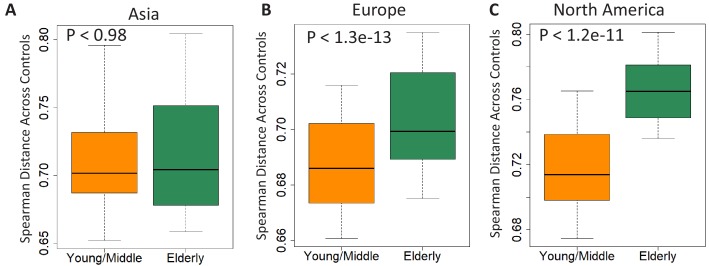
Interaction between disease-microbiome associations and ageing has not been explored in detail. Here, using age/region-matched sub-sets, we analysed the gut microbiome differences across five major diseases in a multi-cohort dataset constituting more than 2500 individuals from 20 to 89 years old. We show that disease-microbiome associations display specific age-centric trends. Ageing-associated microbiome alterations towards a disease-like configuration occur in colorectal cancer patients, thereby masking disease signatures. We identified a microbiome disease response shared across multiple diseases in elderly subjects that is distinct from that in young/middle-aged individuals, but also a novel set of taxa consistently gained in disease across all age groups. A subset of these taxa was associated with increased frailty in subjects from the ELDERMET cohort. The relevant taxa differentially encode specific functions that are known to have disease associations.

Keywords: ageing; computational biology; disease-microbiome; host-microbiome; infectious disease; microbiology; systems biology.

Plain language summary

The human body is an ecosystem made up of both human cells and trillions of microbes, and the largest microbial community is in the gut. This community of gut microbes helps harvest nutrients from our food, modulates our immune system, and even affects our mood. Infectious and chronic diseases appear to cause changes in the make-up of the gut microbiome, while microbiome changes may increase the risk of some non-infectious diseases. Learning more about these disease-linked changes in the gut microbiome may therefore help scientists to develop new tests and treatments. To do this, scientists need to understand which microbes play a role in individual diseases, if risk-related microbes are gained or helpful microbes lost in patients with particular diseases, and if certain changes in gut microbes occur across many diseases. Ageing also changes the gut microbes. This may happen because older individuals eat a less complex diet and are likely to take many medications that may alter the microbes in their gut. Because of this, age may affect changes in gut microbes associated with diseases. This highlights the need for studies that tease apart the importance of ageing-related and disease-related changes in the gut microbiome. Now, Ghosh et al. show that gut microbe changes linked to diseases may vary with a person’s age. The analysis compared the gut microbiomes of more than 2,500 individuals aged 20 to 89. This included individuals with inflammatory bowel disease, colorectal cancer, type 2 diabetes, intestinal polyps and liver cirrhosis. The study revealed that younger people gradually gain disease-associated gut microbes, while older people tend to lose the gut microbes usually found in a healthy gut. Ghosh et al. also identified a set of gut microbes that were gained in many diseases and across age-groups. This set of microbes was also associated with frailty in elderly people. The characteristics of the microbes in this set are all known to have detrimental effects on human health. This analysis shows how important it is to control for age and other factors that may skew the results of microbiome projects. Future studies are needed to understand why these gut microbe changes occur and what the consequences of these changes are for a person’s health and the course of their disease. This may lead to the development of treatment strategies that help promote a healthy gut microbiome and fight disease throughout life.


Conflict of interest statement

TG, MD, IJ, PO No competing interests declared

Figures

Figure 1.
Figure 1.. Age influences microbiome composition as well as microbiome-disease signatures.
(A) Bar plots showing the effect (denoted by R2 values computed using PERMANOVA after adjusting for the DNA extraction technique as the confounder) of host factors with microbiome composition in the ExperimentHub repository. Only metadata available for at least 30% of the samples are shown. The p-values for the significance of association are also indicated as ****: p<0.0001; ***: p<0.001, **: p<0.01, *: p<0.05. (B) Principal Co-ordinate Analysis (PCoA) plots of the species profiles of the ‘control’ samples grouped into three age ranges, Young (20–39 years), Middle (40–59 years) and Elderly (60 years and above). The significance (p-value) of the differences between the three groups, computed using PERMANOVA (adonis) after considering the country-specific differences and the DNA extraction technique, is also indicated. The boxplots on the top show the variation of the top three PCoA coordinates for the samples belonging to the three age-groups. The elderly harboured a significantly different microbiome compared to the young/middle-aged. (C) Barplots of PERMANOVA R2 values showing the variation of microbiome with disease (adjusting for age-group) and age-group (adjusting for disease status) in the five disease cohorts. The Cohort-specific analyses ensured that the variations observed were not due to country-specific regional differences in microbiome composition. However, within each cohort, there were skews in the representation of diseased and control samples from different age-groups (as seen in Table 1). Furthermore, in four out of the eight cohorts, there were significant differences in the age variation of control and diseased individuals, as shown by the beanplots in D.
Figure 1—figure supplement 1.
Figure 1—figure supplement 1.. Effect of median read length and DNA extraction techniques on the microbiome variation.
(A) PCoA Plot showing the relatedness of the microbiome profiles of the ExperimentHub datasets of different median read length ranges. The different read length categories (into which the datasets were grouped) were’ 30 to 90’ (base pairs) and ‘Greater than 90’ (base pairs). The R-squared value and P-value of the association obtained using bootstrapped envfit iterations (sub-sample size = 200 and number of iterations: 25) are indicated. (B) PCoA analysis of the effects of the DNA extraction methods on the microbiome profiles, indicating that the samples extracted using the method tagged as ‘Illuminakit’ (shown in Green) (used by SchirmerC_201635), had a profile significantly different from those used by other methods (‘Gnome’, ‘Mobio’ and ‘Qiagen’) (bootstrapped envfit median R-squared: 0.13 and median p-value<0.001). Removing these samples in (C) indicated that the rest of the samples had only a marginal effect on the profiles (p<0.08; R-squared = 0.019).
Figure 1—figure supplement 2.
Figure 1—figure supplement 2.. Pictorial summary describing the workflow used for preparing a core set of around 2564 gut metagenomic datasets derived from the publicly available datasets (curatedMetagenomicData9 and Franzosa et al 20188) and the ELDERMET repository.
While the datasets used in the core-analysis are highlighted in blue, the validation cohorts including the ELDERMET are highlighted in brown.
Figure 1—figure supplement 3.
Figure 1—figure supplement 3.. Number of control and diseased individuals belonging to the different age-groups present in (A) country-specific and (B) continent-specific groups pertaining to each disease.
Age-groups where the number of control/diseased samples are less than 15 are highlighted in red. The shortened notations for the different country used are ESP: Spain; USA: United States, CHN: China, SWE: Sweden, AUT: Austria, FRA: France (C) Boxplots comparing the PERMANOVA -log P-values obtained for the effects of the geographical factors, country and continent, by taking repeated subsets of control samples (n = 25, subset size = 20%). The overall R2 value obtained for the PERMANOVA is also indicated. While R2 was higher for country, the p-values obtained for continent was significantly lower as compared to country, indicating that the effect of continent is much more significant than the country. The results indicated that country and continent had similar effects on the microbiome. (D) The country and continent specific cohorts within which the analyses were restricted for each disease, to take into account the regional variations.
Figure 2.
Figure 2.. Microbiome-disease signatures display specific age group centric trends.
Boxplots showing the variation of disease-classification area under the curve (AUCs) when classifiers trained on one age-group were tested on either the same (denoted as SameAge or Same Age-group classification) or different age-groups (denoted as DiffAge or Different Age-group classification) for (A) IBD (B) T2D (C) CRC (D) Polyps and (E) Cirrhosis. Each point denotes the median AUC (of 20 iterations) obtained using each of the 100 sub-sample based Random Forest classifier models when tested on samples from the Same Age-group (in blue) or Different Age-groups (in red). Median AUC values obtained for the same classifier for Same Age-group and Different Age-group classification are joined by grey lines. Scenarios where in the Same Age-group classification had a significant increase of classification AUC as compared to the Different Age-group are indicated (using the P-values of significance). The Wilcoxon signed rank test p-values of significance, after correction using Holm method, are indicated as ***: p<0.001, **: p<0.01, *: p<0.05.
Figure 2—figure supplement 1.
Figure 2—figure supplement 1.. Schematic workflow of the methodology adopted for comparing the performance of disease-specific random forest classifiers trained on one age-group when applied to test samples from the same (Same Age-group classification) or different age-groups (Different Age-group classification) using Wilcoxon Signed Rank tests.
Workflow also describes the permutation test based strategy adopted to investigate whether the observed differences in classification AUCs (Same Age-group classification – Different Age-group classification) are significantly high than would be expected at random (Null distribution). The training set and test set sub-sample sizes are X and Y, respectively (refer to Figure 2—source data 1). A similar strategy was adopted for all the three age-groups and all the five diseases (refer to the Materials and methods for the detailed description).
Figure 2—figure supplement 2.
Figure 2—figure supplement 2.. Boxplots comparing the actual AUC differences (that is, median AUC for same age-group classification – median AUC for the different age-group classification) obtained for classifiers (in each disease-age-group scenario) with the null distribution of AUC differences obtained between two permuted sets (as obtained in the Permutation tests).
While the blue points denote the actual increase of the median AUCs obtained for the Same Age-group classification with respect to that obtained for the different age-group classification, the red points denote the differences of the AUCs observed between the permuted test sets. Scenarios where in the actual difference of AUC are significantly higher than would be expected by random (in the null distributions) are indicated (using the P-values of significance). The Wilcoxon signed rank test p-values of significance, after correction using Holm method, are indicated as ***: p<0.001, **: p<0.01, *: p<0.05.
Figure 3.
Figure 3.. Specific taxa show age-group linked trends of disease association.
Heatmaps showing the marker scores for the list of taxa that are differentially associated with the indicated disease across the age-groups (Y: Young; M: Middle-aged and E: Elderly). For each disease, this list of species was selected as those which were among the top 85 percentile features in at least one age-group and which displayed significant variation in their feature importance scores across at least two age-groups. These taxa were further validated using a linear regression approach to ensure that their age-group specific association with disease was significant even after accounting for the independent changes associated with ageing. The font colors of the species indicate whether the species were reported in the original studies as being associated with the given disease (Dark blue: Associated Previously; Black: Not Associated). For each disease, heatplots (adjoining on the right side of the corresponding heatmap) shows the different taxa were identified within the top 85 percentile markers for each age-group (in blue color).
Figure 3—figure supplement 1.
Figure 3—figure supplement 1.. Variation of feature importance scores of the taxa across the iterative Random Forest models.
(A) Frequency at which taxa with feature importance scores in different percentile were identified as markers (Mean Decrease of GINI > 0) in the iterative RF models for each of the 13 disease – age-group scenario. For all the 13 disease-age-group scenario, taxa features with scores above 85 percentile were identified as markers in at least 95% of the iterations. (B) Variation of the mean feature importance scores of taxa in various percentiles. For most of the 13 scenarios, the mean feature importance scores remain stable and low till the 80% mark and start increasing only after that. Given these two observations, the percentile threshold of 85 was identified to filter the top disease associated features.
Figure 3—figure supplement 2.
Figure 3—figure supplement 2.. The percentage of 85 percentile taxa that were detected as common or specific to certain age-groups for the five different diseases.
Figure 3—figure supplement 3.
Figure 3—figure supplement 3.. Schematic workflow describing the linear regression-based strategy to deconvolute the effect of ageing from age-specific disease association.
The objective was to identify a core subset of differentially associated taxa whose age-group specific association was not a simple consequence of its abundance changing with ageing.
Figure 3—figure supplement 4.
Figure 3—figure supplement 4.. Validation of age-specific trends using Linear Regression approach and the effect of these trends on the known markers for the various diseases.
(A) Percentage of taxa showing significant differences in their feature importance scores that are also validated in the Linear regression-based approach. (B) Percentage of known markers (that is those reported in previous studies) that were also identified in the list of taxa showing significant differences in their feature importance scores (C) Percentage of known markers that were also validated in the Linear regression approach. (D) Heatplots showing the age-group-specific variability in the association patterns of the known markers for CRC and T2D (that also showed differential associations with disease across age-groups). For each disease-age-group scenario, the value for a marker indicates the number of times (out of the 100 iterations) it was identified with feature rank score of greater than 85 percentile. Y: Young, M: Middle, E: Elderly.
Figure 4.
Figure 4.. Age-dependent CRC-specific markers are reproducible across multiple cohorts and ageing-associated changes make the elderly gut microbiome disease-like.
(A) The boxplot on the top panel shows the distribution of AUC values obtained when classifiers trained on different age-groups (YM: Young/Middle-aged; E: Elderly) in three cohorts of the curatedMetagenomicData (Training_Set1: ZellerG_2014, FengQ_2015 and VogtmannE_2016) are tested on the three datasets of the validation cohort (ThomasAJ_Cohort1, ThomasAJ_Cohort2 and WirbelJ_2019). The lower panel shows the same, but with age-group specific classifiers trained from within the validation cohort (Training_Set2). Both the classification models generated the same trends of classification, indicating age-group specific reproducibility of the disease signatures. The description of the point colors is the same as for Figure 2. (B) Age-group dependent associations of the known CRC markers in the two independent cohorts, namely Training_Set1 (curatedMetagenomicData) and Training_Set2 (Validation Cohort). Shades of blue indicate higher feature importance scores in the young/middle-aged and red indicates higher feature importance scores in the elderly. FDR p<0.15 indicates features identified as being high either in elderly of young/middle with Benjamini-Hochberg corrected Mann-Whitney test p-value<0.15. FDR p<0.25 indicates features identified as being high either in elderly of young/middle with Mann-Whitney test p-value<0.25. Out of the 19 known and validated CRC-markers (obtained from Thomas et al., 2019), 13 showed significant differences in their feature importance scores across the two age-groups (in the curatedMetagenomicData cohorts). For nine of these 13 markers, the pattern of associations could be reproduced in the Validation cohort, further indicating the replicability of the obtained results. The feature ranks of the top 10 markers obtained in Thomas et al. (2019) are also shown. Six of the top 10 markers show increased association, but only within the young/middle-aged. Only one of the markers associated with the elderly. This indicates a loss of disease-signature in the elderly. (C) Across cohort Spearman distances of feature rank profiles obtained for the disease classifiers trained on the different age-groups (See Materials and methods). A stable disease signature would result in reproducible species rank profiles across cohort and consequently lower Spearman distances. While this is the case for young/middle-aged, the elderly signatures obtained for the different cohorts show significantly high Spearman distances (showing significant variations and lack of disease signature). (D) The log ratios of the prevalence rates of the top six CRC-associated markers in elderly controls with respect to the young/middle-aged controls (in both the curatedMetagenomicData and CRC-specific cohorts). A positive value indicates higher prevalence rates in elderly controls. The significance of the increase is also indicated (p-values of fishers’ exact test combined using Fisher method) as ***: p<0.001, **: p<0.01, *: p<0.05. The increase in the elderly is characterized by a significant decrease in the effect-size differences between the controls and diseased in elderly, leading to masked signatures.
Figure 4—figure supplement 1.
Figure 4—figure supplement 1.. Results of the permutation test (as described in Figure 2—figure supplement 1) applied for the testing of the CRC Validation datasets using the different training cohorts as indicated in the Figure.
The color of the points are as indicated previously (Figure 2—figure supplement 2). Scenarios where in the actual difference of AUC are significantly higher than would be expected by random (in the null distributions) are indicated (using the P-values of significance).
Figure 5.
Figure 5.. Age-related microbiome changes affect taxon abundance alterations for specific diseases, as well as the microbiome response shared by multiple diseases.
(A) Comparison of the relative proportions of more abundant and less abundant disease-specific marker taxa across the young, middle-aged and elderly age-groups for the five diseases. For each disease-age-group scenario, we checked for the directionality (increased abundance in disease v/s decreased in disease) of association of the corresponding top disease-predictors by comparing their abundance trends in the control and diseased samples belonging to the specific age-groups (See Materials and methods). To ensure that the results thus obtained were not affected by regional variations in microbiome composition, we again restricted these comparisons to the disease-specific continent cohorts. (B) Comparison of the disease prediction AUCs, the disease classification sensitivity and control classification specificity of generic disease prediction models obtained for the elderly and young/middle-aged groups. Overall, the generic disease classifiers had a significant decrease in performance in the elderly age groups, indicating that shared microbiome response may be reduced in the elderly. Moreover, the loss of performance was especially significant with respect to the discrimination of control samples from disease (C) Heatmap of marker species showing consistent trends of either increase or decrease in at least two diseases in the elderly and young/middle-aged groups. Blue indicates consistent increase in two or more diseases, red indicates decrease in two or more diseases. Based on their patterns of increase or decrease across the two age-groups, the taxa could be classified into six groups, namely G1-G3 and L1-L3.
Figure 5—figure supplement 1.
Figure 5—figure supplement 1.. Comparison of the relative proportions of taxa increased and decreased in disease across the young, middle-aged and elderly age-groups for the five diseases.
For each disease-age-group scenario, we checked for the directionality (increased abundance in disease v/s decreased in disease) of association of the corresponding top disease-predictors by comparing their abundance trends in the control and diseased samples belonging to the specific age-groups (Mann-Whitney Tests p<0.05; See Materials and methods). To ensure that the results thus obtained were not affected by regional variations in microbiome composition, we again restricted these comparisons to the study matched controls and diseased samples.
Figure 5—figure supplement 2.
Figure 5—figure supplement 2.. Comparison of beta diversity (measured as spearman distances) within the gut microbiome of controls from the young/middle and elderly age-groups from (A) Asia (B) Europe and (C) North America.
Figure 6.
Figure 6.. Frailty-associated markers have shared positive associations across multiple diseases in both age groups and have a specific metabolic signature.
(A) Actual FIM values versus FIMs predicted by Random forest of microbiome features of the elderly individuals of the ELDERMET cohort living in Community or Residential care (Longstay). (B) Mean ranks of the various taxonomic groups (identified in Figure 3) for the prediction of FIM (an inverse measure of frailty) in the ELDERMET cohort. (C) Variable Importance Scores of the eight markers with the highest predictive power in the Random Forest models for prediction of FIM. A comparison of the abundance of markers between HighFIM and LowFIM individuals indicated that all of these markers were associated with frailty state. (D) The network in the central panel indicates the 13 metabolite profiles significantly associated with the top markers. Taxon markers are indicated in the center. Consumption profiles are in the upper half (in pink octagons) and Production profiles are on the lower panel (in yellow octagons). Edges indicate presence. Second from the left in top panel are the correlations between predicted and actual FIM values obtained for iterative bootstrapped Random Forest models (training on 20% and testing on the rest 80%) using only the 13 metabolite profile markers of (D), all metabolite profiles and all metabolite profiles removing the 13 metabolite markers. Top and bottom panels show the validation (indicated by arrows) obtained for the predicted metabolite markers using either the measured metabolites, dietary consumption profiles, specific microbial pathway abundances as well as the CutC gene family abundances identified using humann2 (shown either as boxplot comparing the profiles between Frail and Non-Frail individuals or scatterplots showing correlations between the measured metabolite level and the FIM value of the individuals). A total of 11 of the 13 metabolites could be validated using either of these strategies.
Figure 6—figure supplement 1.
Figure 6—figure supplement 1.. Frailty-prediction using Random Forest models and the identification of the topfrailty-predictive taxonomic features.
(A) Log Root Mean Squared Error of Random Forest prediction of Barthel Score (with five-fold cross validation) from microbiome species profile (obtained with different number of species arranged in decreasing order of their variable importance scores) (B) Scatterplot showing correlation between the Random Forest predicted Barthel and actual Barthel for Community + Longstay (C). Log Root Mean Squared Error of Random Forest prediction of FIM (with five-fold cross validation) from microbiome species profile (obtained with different number of species arranged in decreasing order of their variable importance scores). (D) Correlation values between Barthel Score and FIM and different number of top features.
Figure 6—figure supplement 2.
Figure 6—figure supplement 2.. Violin plots showing the Metabolite consumption and production profiles that were significantly associated with FIM scores (with Spearman Rho FDR < 0.25).
The X axis shows the Spearman rhos and the Y-axis shows the -Log of FDR (with base 10).
Figure 6—figure supplement 3.
Figure 6—figure supplement 3.. Heatmap based representation of the metabolic signatures associated with taxa gain/loss groups defined in main text Figure 4C: (A) G1-G3 (B) L1-L3.

References

    1. Armour CR, Nayfach S, Pollard KS, Sharpton TJ. A metagenomic Meta-analysis reveals functional signatures of health and disease in the human gut microbiome. mSystems. 2019;4:18. doi: 10.1128/mSystems.00332-18. - DOI - PMC - PubMed
    1. Baskaran S, Rajan DP, Balasubramanian KA. Formation of methylglyoxal by Bacteria isolated from human faeces. Journal of Medical Microbiology. 1989;28:211–215. doi: 10.1099/00222615-28-3-211. - DOI - PubMed
    1. Buffie CG, Bucci V, Stein RR, McKenney PT, Ling L, Gobourne A, No D, Liu H, Kinnebrew M, Viale A, Littmann E, van den Brink MR, Jenq RR, Taur Y, Sander C, Cross JR, Toussaint NC, Xavier JB, Pamer EG. Precision microbiome reconstitution restores bile acid mediated resistance to Clostridium difficile. Nature. 2015;517:205–208. doi: 10.1038/nature13828. - DOI - PMC - PubMed
    1. Claesson MJ, Jeffery IB, Conde S, Power SE, O'Connor EM, Cusack S, Harris HM, Coakley M, Lakshminarayanan B, O'Sullivan O, Fitzgerald GF, Deane J, O'Connor M, Harnedy N, O'Connor K, O'Mahony D, van Sinderen D, Wallace M, Brennan L, Stanton C, Marchesi JR, Fitzgerald AP, Shanahan F, Hill C, Ross RP, O'Toole PW. Gut Microbiota composition correlates with diet and health in the elderly. Nature. 2012;488:178–184. doi: 10.1038/nature11319. - DOI - PubMed
    1. Deschasaux M, Bouter KE, Prodan A, Levin E, Groen AK, Herrema H, Tremaroli V, Bakker GJ, Attaye I, Pinto-Sietsma SJ, van Raalte DH, Snijder MB, Nicolaou M, Peters R, Zwinderman AH, Bäckhed F, Nieuwdorp M. Depicting the composition of gut Microbiota in a population with varied ethnic origins but shared geography. Nature Medicine. 2018;24:1526–1531. doi: 10.1038/s41591-018-0160-1. - DOI - PubMed

Publication types