. 2020 Mar 11:9:e53275.
doi: 10.7554/eLife.53275.

A synthetic dataset primer for the biobehavioural sciences to promote reproducibility and hypothesis generation

Affiliations

A synthetic dataset primer for the biobehavioural sciences to promote reproducibility and hypothesis generation

Daniel S Quintana. Elife. .

Abstract

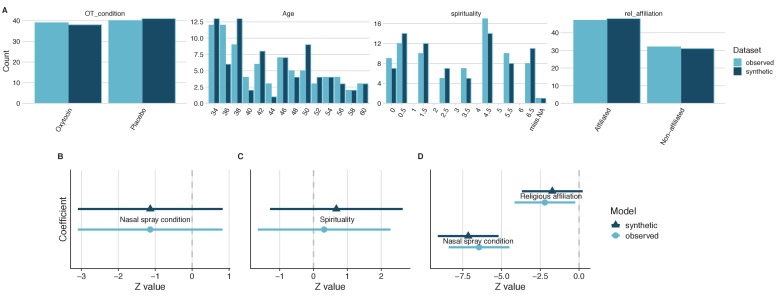
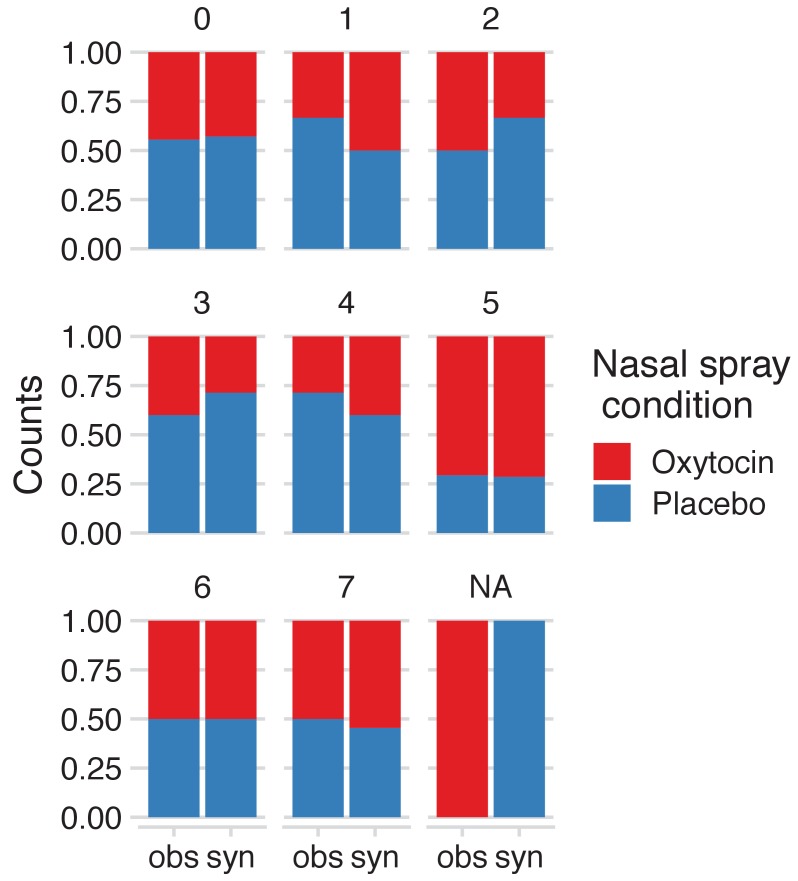
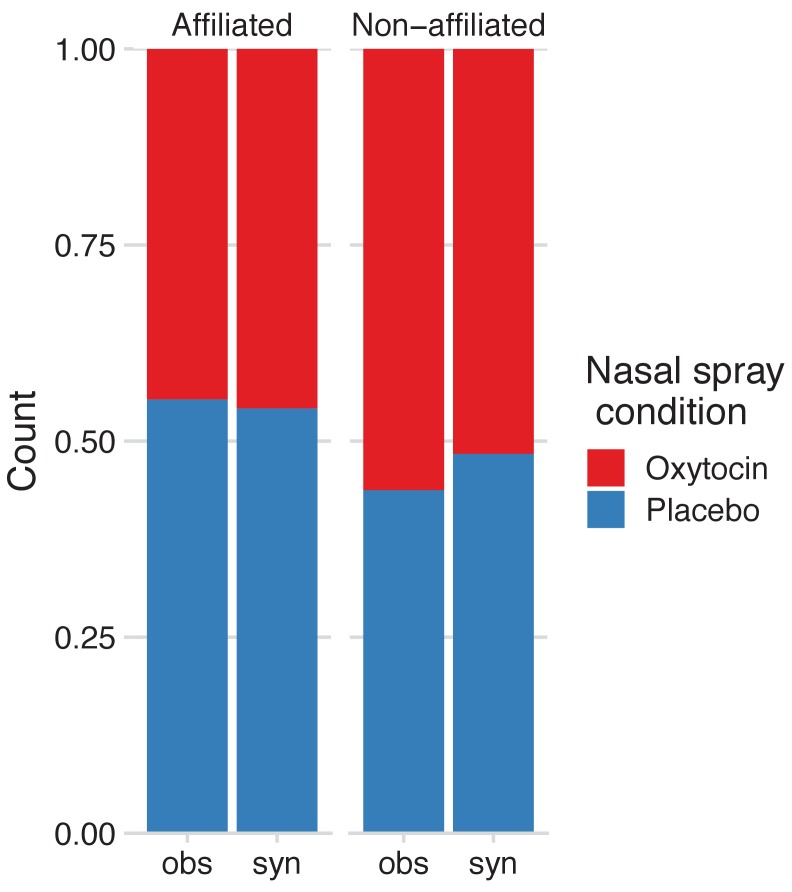
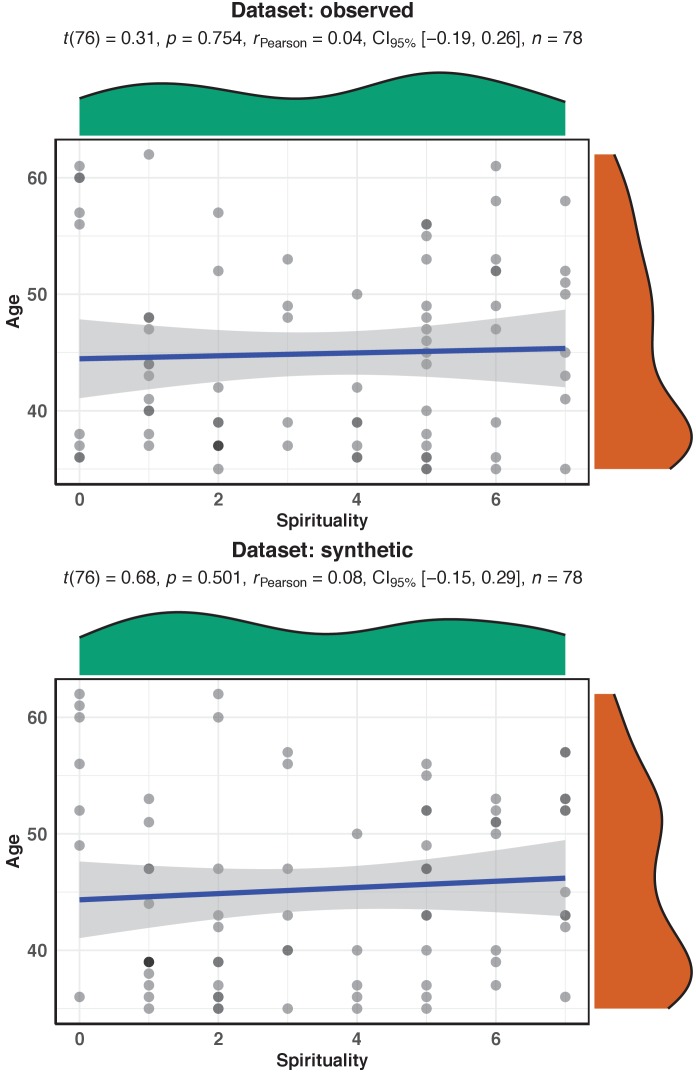
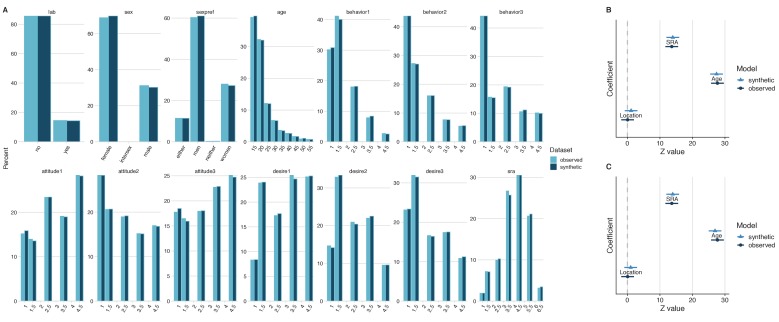
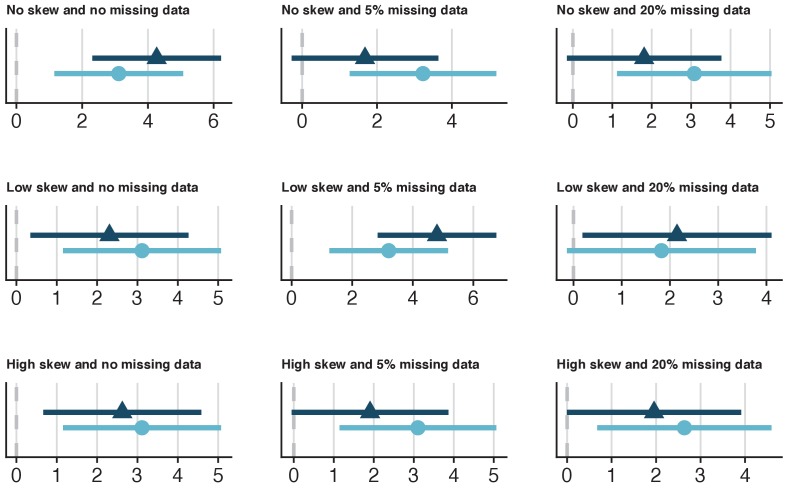
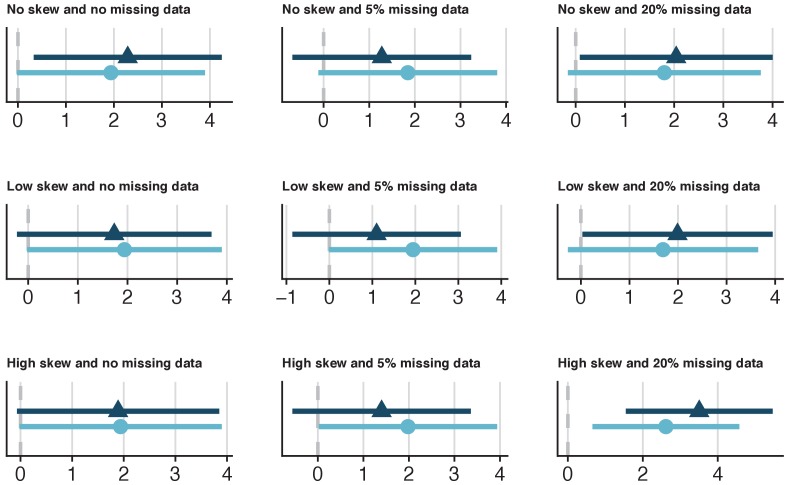
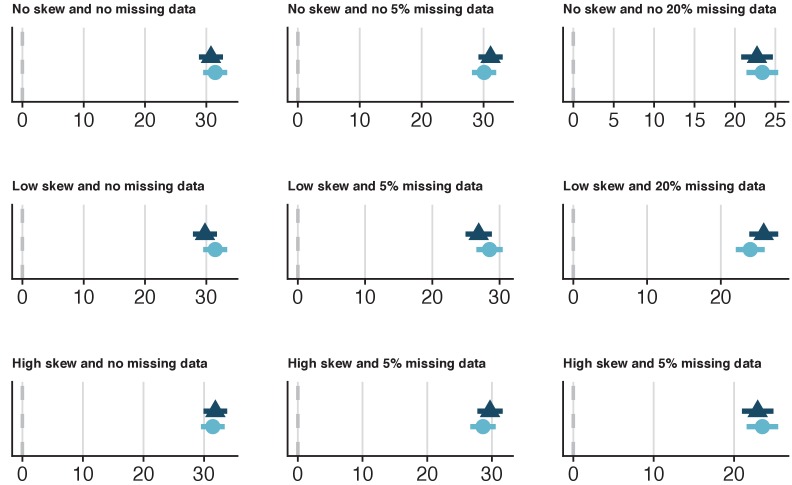
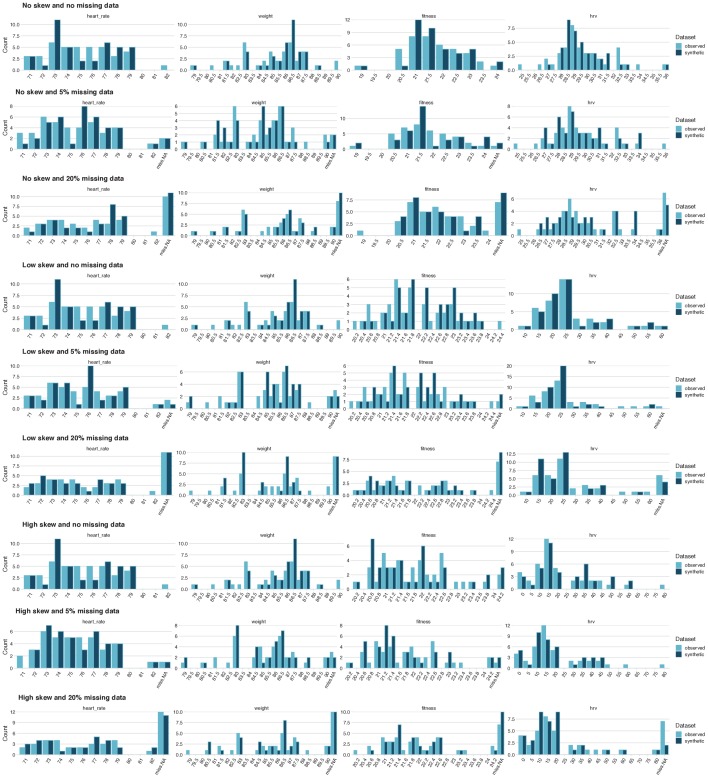
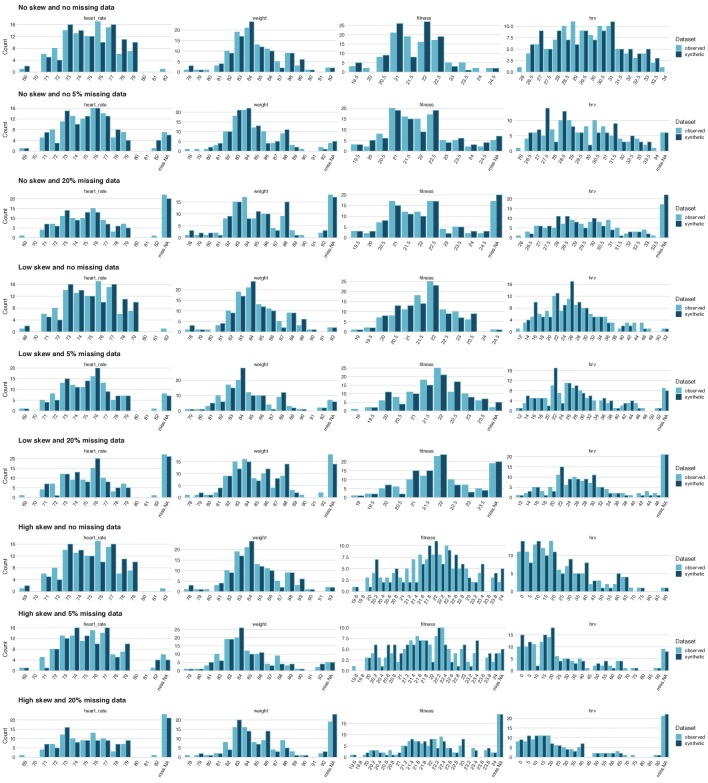
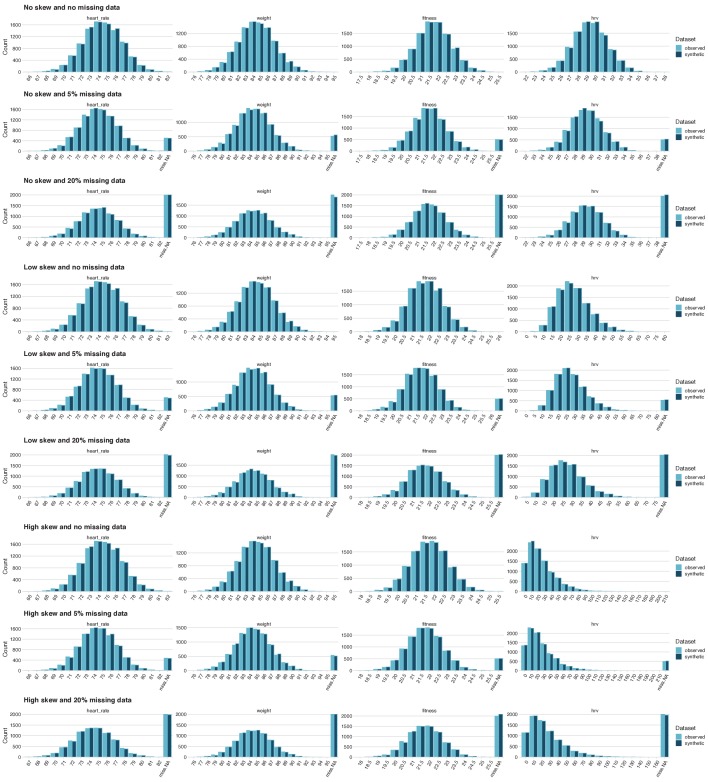
Open research data provide considerable scientific, societal, and economic benefits. However, disclosure risks can sometimes limit the sharing of open data, especially in datasets that include sensitive details or information from individuals with rare disorders. This article introduces the concept of synthetic datasets, which is an emerging method originally developed to permit the sharing of confidential census data. Synthetic datasets mimic real datasets by preserving their statistical properties and the relationships between variables. Importantly, this method also reduces disclosure risk to essentially nil as no record in the synthetic dataset represents a real individual. This practical guide with accompanying R script enables biobehavioural researchers to create synthetic datasets and assess their utility via the synthpop R package. By sharing synthetic datasets that mimic original datasets that could not otherwise be made open, researchers can ensure the reproducibility of their results and facilitate data exploration while maintaining participant privacy.

Keywords: data; human biology; medicine; meta-research; none; statistics.

Plain language summary

It is becoming increasingly common for scientists to share their data with other researchers. This makes it possible to independently verify reported results, which increases trust in research. Sometimes it is not possible to share certain datasets because they include sensitive information about individuals. In psychology and medicine, scientists have tried to remove identifying information from datasets before sharing them by, for example, adding minor artificial errors. But, even when researchers take these steps, it may still be possible to identify individuals, and the introduction of artificial errors can make it harder to verify the original results. One potential alternative to sharing sensitive data is to create ‘synthetic datasets’. Synthetic datasets mimic original datasets by maintaining the statistical properties of the data but without matching the original recorded values. Synthetic datasets are already being used, for example, to share confidential census data. However, this approach is rarely used in other areas of research. Now, Daniel S. Quintana demonstrates how synthetic datasets can be used in psychology and medicine. Three different datasets were studied to ensure that synthetic datasets performed well regardless of the type or size of the data. Quintana evaluated freely available software that could generate synthetic versions of these different datasets, which essentially removed any identifying information. The results obtained by analysing the synthetic datasets closely mimicked the original results. These tools could allow researchers to verify each other’s results more easily without jeopardizing the privacy of participants. This could encourage more collaboration, stimulate ideas for future research, and increase data sharing between research groups.


Conflict of interest statement

DQ No competing interests declared

Figures

Figure 1.
Figure 1.. General and specific utility of synthetic data from a study on the impact of intranasal oxytocin on self-reported spirituality.
A comparison of the four variables of interest revealed similar distributions in both the observed and the synthetic datasets, which is indicative of good general utility (A). Direct comparisons of coefficient estimates and 95% confidence intervals from linear models calculated from synthetic and observed datasets revealed no significant differences and high confidence interval overlap (B–D), which is indicative of good specific utility.
Figure 1—figure supplement 1.
Figure 1—figure supplement 1.. Differences in self-reported spirituality, stratified by nasal spray condition and dataset.
After receiving either the oxytocin or placebo nasal spray (depending on randomization), participants were asked on a scale from 0 (Not at all) to 7 (Completely), “Right now, would you say that spirituality is important for you?”. The difference in counts between the observed dataset (obs) and the synthetic dataset (syn) are shown for each possible response on the scale (0–7). As the counts were similar between datasets for each possible response, this suggests that the synthetic dataset has good utility. There were no missing datapoints (NA).
Figure 1—figure supplement 2.
Figure 1—figure supplement 2.. Differences in religious affiliation, stratified by nasal spray condition and dataset.
The difference in counts between the observed dataset (obs) and the synthetic dataset (syn) are shown for two religious affiliation categories: affiliated with a religion and non-affiliated with any religion. As the counts were similar between datasets for both categories, this suggests that the synthetic dataset has good utility.
Figure 1—figure supplement 3.
Figure 1—figure supplement 3.. The relationship between age and self-reported spirituality in the observed and synthetic datasets.
As the scatterplot and density plots appear similar between the observed and synthetic datasets, this suggests that the synthetic dataset has good utility.
Figure 2.
Figure 2.. General and specific utility of synthetic data from an investigation on sociosexual orientation.
A comparison of the fourteen variables of interest revealed similar distributions in both the observed and the synthetic datasets, which is indicative of good general utility (A). Direct comparisons of coefficient estimates and 95% confidence intervals from a linear model calculated from synthetic and observed datasets revealed no significant differences and high confidence interval overlap (B), which is indicative of good specific utility. The coefficient estimates and 95% confidence intervals of the same model derived from the synthetic dataset with 213 replicated individuals removed also demonstrated high confidence interval overlap (C). This demonstrates that reducing disclosure risk has little effect on specific utility.
Figure 3.
Figure 3.. Specific utility of synthetic data from a range of simulated datasets with 100 cases that model the relationship between Heart Rate Variability (HRV) and fitness.
Nine datasets with 100 cases were simulated, which varied on skewness for the HRV variable (none, low, high) and missingness for all variables (0%, 5%, 20%). The x-axes values represent Z-values for the HRV coefficient. The dark-blue triangles and confidence intervals represent the HRV estimates for the synthetic data and the light-blue circles and confidence intervals represent the HRV estimates for the observed data. In general, there was a high overlap between the synthetic and original estimates (Supplementary file 1). The confidence interval range overlap between the synthetic and observed estimates from the dataset with normally distributed HRV and 5% missing data were 60.5%. While the standardized difference was not statistically significant (p=0.12), caution would be warranted in terms of specific utility in this case, given the relatively low confidence interval range overlap.
Figure 3—figure supplement 1.
Figure 3—figure supplement 1.. Specific utility of synthetic data from a range of simulated datasets with 40 cases that model the relationship between Heart Rate Variability (HRV) and fitness.
Nine datasets with 40 cases were simulated, which varied on skewness for the HRV variable (none, low, high) and missingness for all variables (0%, 5%, 20%). The x-axes represent Z-values for the HRV coefficient. The dark-blue triangles and confidence intervals represent the HRV estimates for the synthetic data and the light-blue circles and confidence intervals represent the HRV estimates for the observed data. There was high overlap between the synthetic and original estimates for the samples and the standardized differences between models derived from the synthetic and observed datasets were not statistically significant (Supplementary file 1). Thus, these synthetic datasets demonstrate good specific utility.
Figure 3—figure supplement 2.
Figure 3—figure supplement 2.. Specific utility of synthetic data from a range of simulated datasets with 10,000 cases that model the relationship between Heart Rate Variability (HRV) and fitness.
Nine datasets with 10,000 cases were simulated, which varied on skewness for the HRV variable (none, low, high) and missingness for all variables (0%, 5%, 20%). The x-axes represent Z-values for the HRV coefficient. The dark-blue triangles and confidence intervals represent the HRV estimates for the synthetic data and the light-blue circles and confidence intervals represent the HRV estimates for the observed data. There was high overlap between the synthetic and original estimates for the samples in which HRV was normally distributed (top row) and highly skewed (bottom row). For the datasets in which HRV had a low skew, the standardized differences between models derived from the synthetic and observed datasets were associated with p-values that can be considered on the border of statistical significance (Supplementary file 1) and the confidence interval range overlap ranged from 53.5% to 28.9% (Supplementary file 1). Altogether, evidence for specific utility in these samples in which HRV had a low skew would not be considered to be strong.
Figure 3—figure supplement 3.
Figure 3—figure supplement 3.. General utility of nine simulated datasets with 40 cases.
Datasets varied on the shape of the distribution of heart rate variability (HRV) and the percentage of missing data.
Figure 3—figure supplement 4.
Figure 3—figure supplement 4.. General utility of nine simulated datasets with 100 cases.
Datasets varied on the shape of the distribution of heart rate variability (HRV) and the percentage of missing data.
Figure 3—figure supplement 5.
Figure 3—figure supplement 5.. General utility of nine simulated datasets with 10,000 cases.
Datasets varied on the shape of the distribution of heart rate variability (HRV) and the percentage of missing data.

References

    1. Akselrod S, Gordon D, Ubel FA, Shannon DC, Berger AC, Cohen RJ. Power spectrum analysis of heart rate fluctuation: a quantitative probe of beat-to-beat cardiovascular control. Science. 1981;213:220–222. doi: 10.1126/science.6166045. - DOI - PubMed
    1. Anscombe FJ. Graphs in statistical analysis. The American Statistician. 1973;27:17–21. doi: 10.1080/00031305.1973.10478966. - DOI
    1. Arslan RC, Schilling KM, Gerlach TM, Penke L. Using 26,000 diary entries to show ovulatory changes in sexual desire and behavior. Journal of Personality and Social Psychology. 2018;26:208. doi: 10.1037/pspp0000208. - DOI - PubMed
    1. Arzberger P, Schroeder P, Beaulieu A, Bowker G, Casey K, Laaksonen L, Moorman D, Uhlir P, Wouters P. Promoting access to public research data for scientific, economic, and social development. Data Science Journal. 2004;3:135–152. doi: 10.2481/dsj.3.135. - DOI
    1. Asendorpf JB, Conner M, De Fruyt F, De Houwer J, Denissen JJA, Fiedler K, Fiedler S, Funder DC, Kliegl R, Nosek BA, Perugini M, Roberts BW, Schmitt M, van Aken MAG, Weber H, Wicherts JM. Recommendations for increasing replicability in psychology. European Journal of Personality. 2013;27:108–119. doi: 10.1002/per.1919. - DOI