. 2021 May;17(5):1096-1111.
doi: 10.1080/15548627.2020.1741332. Epub 2020 Mar 19.

PI3KC3 complex subunit NRBF2 is required for apoptotic cell clearance to restrict intestinal inflammation

Affiliations

PI3KC3 complex subunit NRBF2 is required for apoptotic cell clearance to restrict intestinal inflammation

Ming-Yue Wu et al. Autophagy. 2021 May.

Abstract

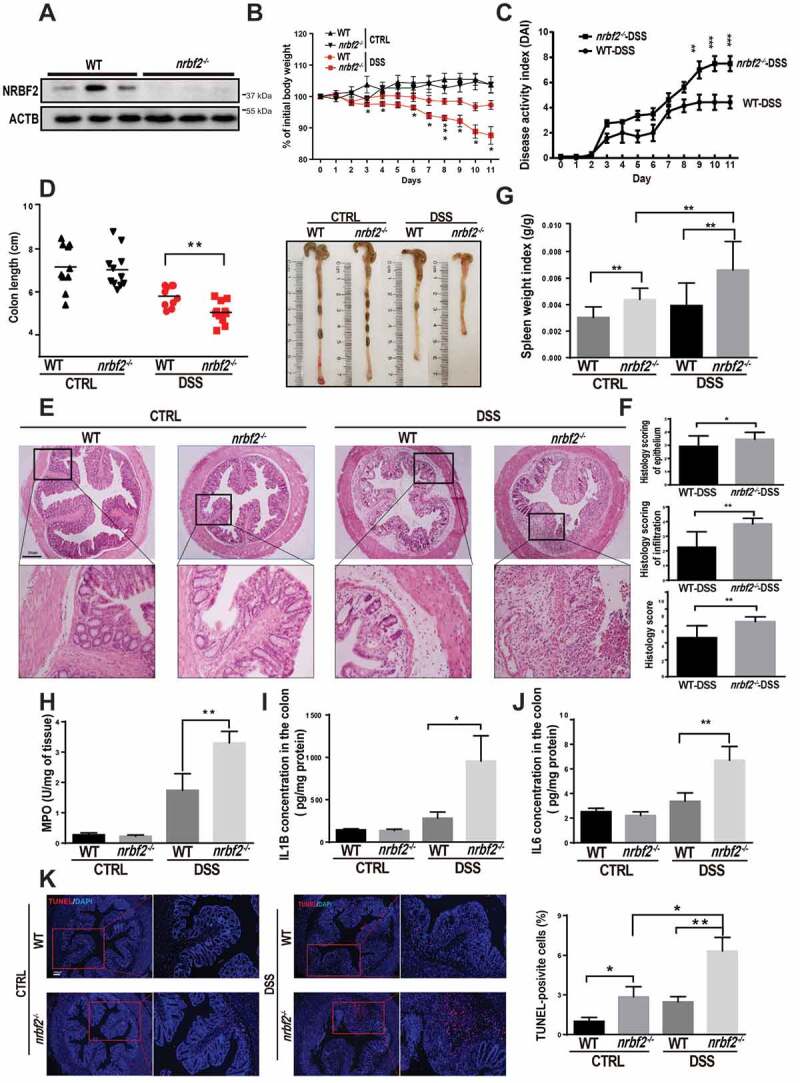
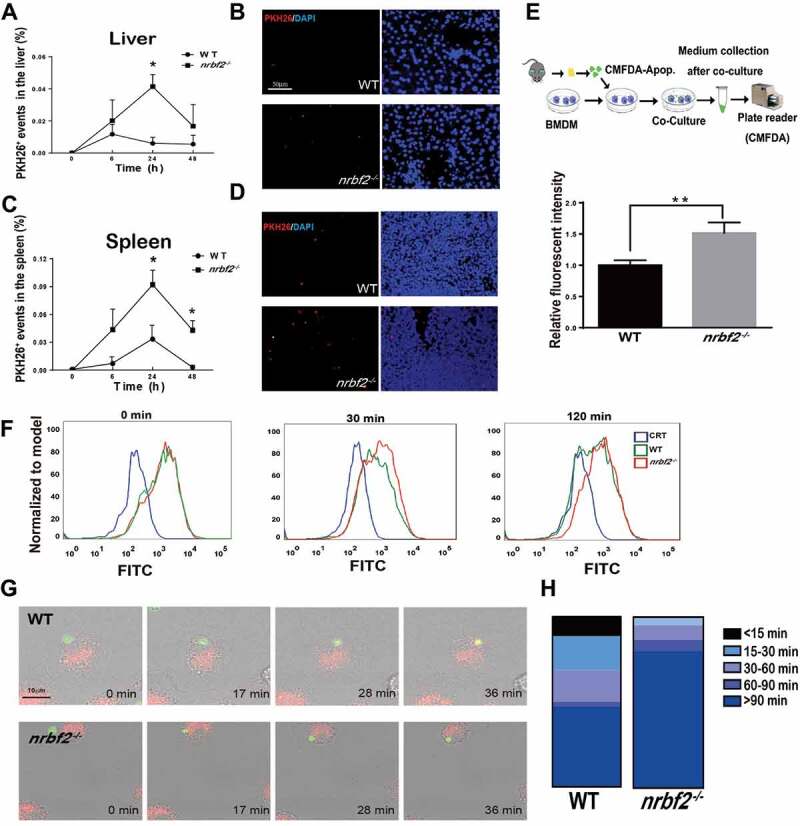
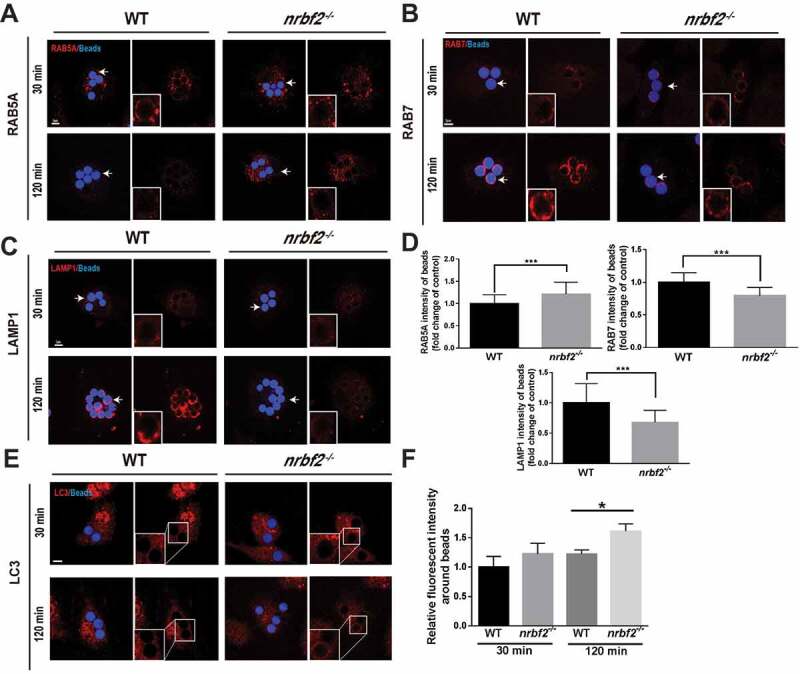
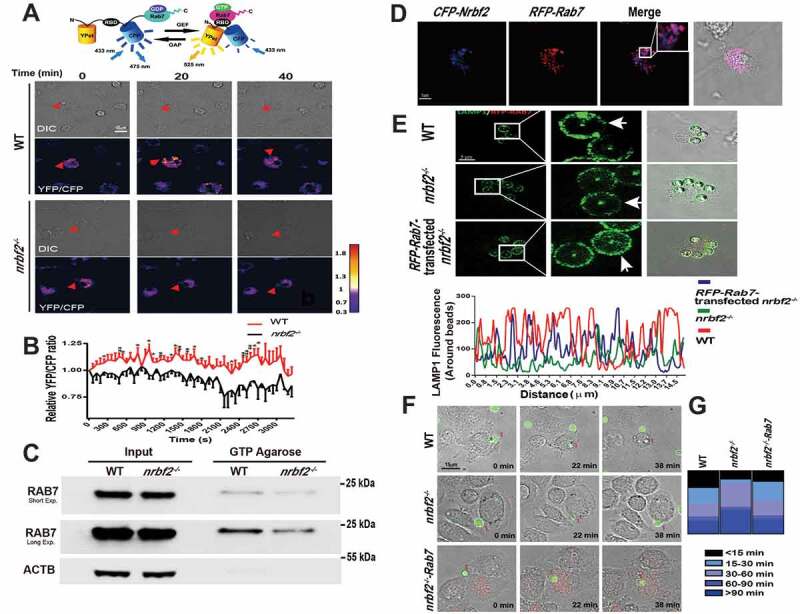
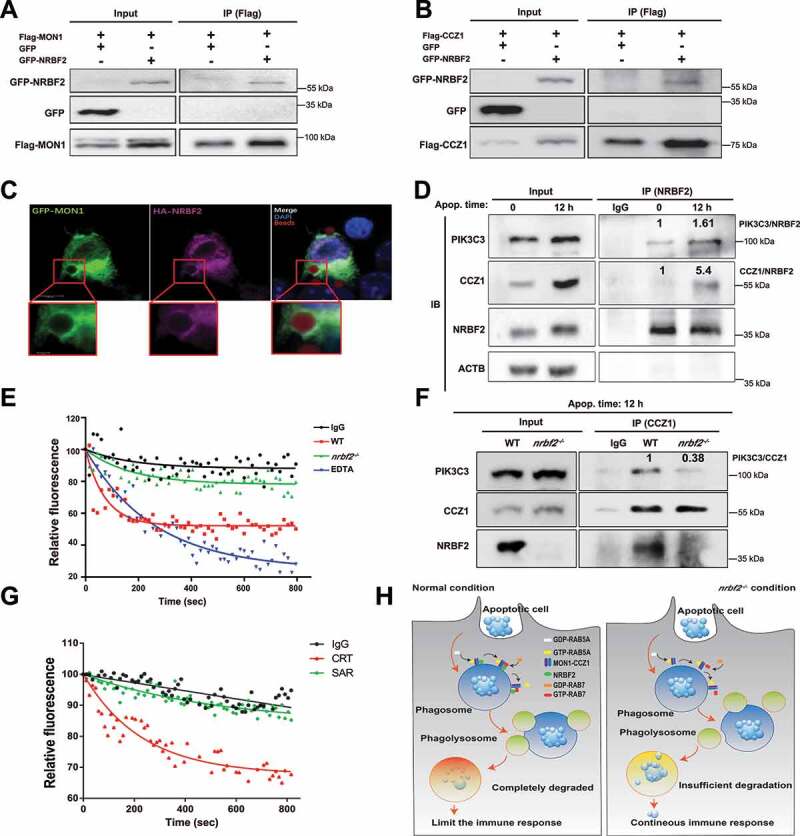
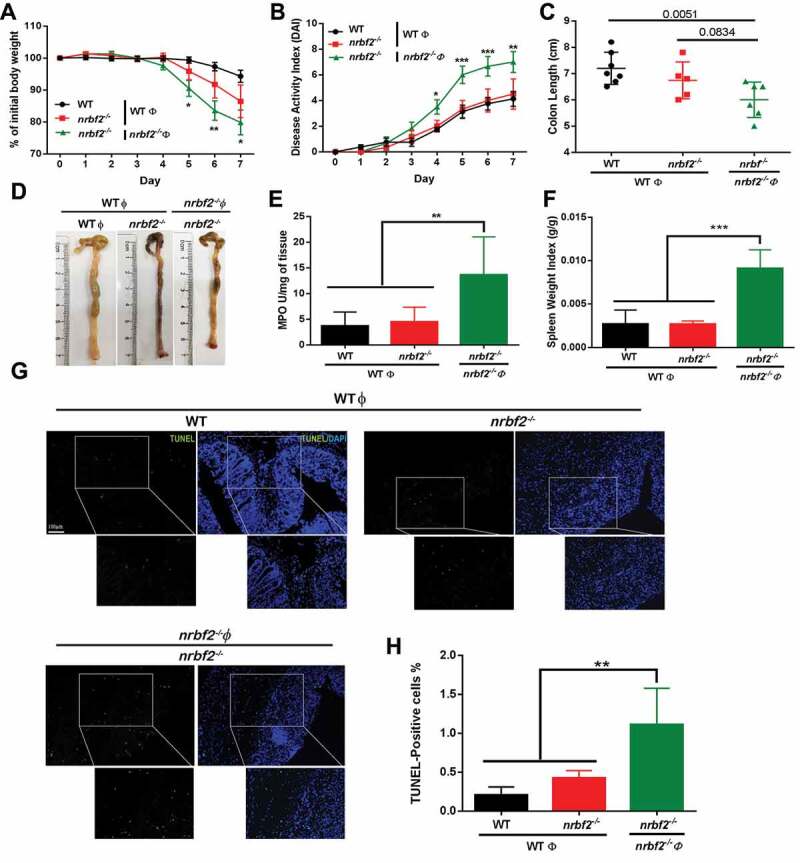
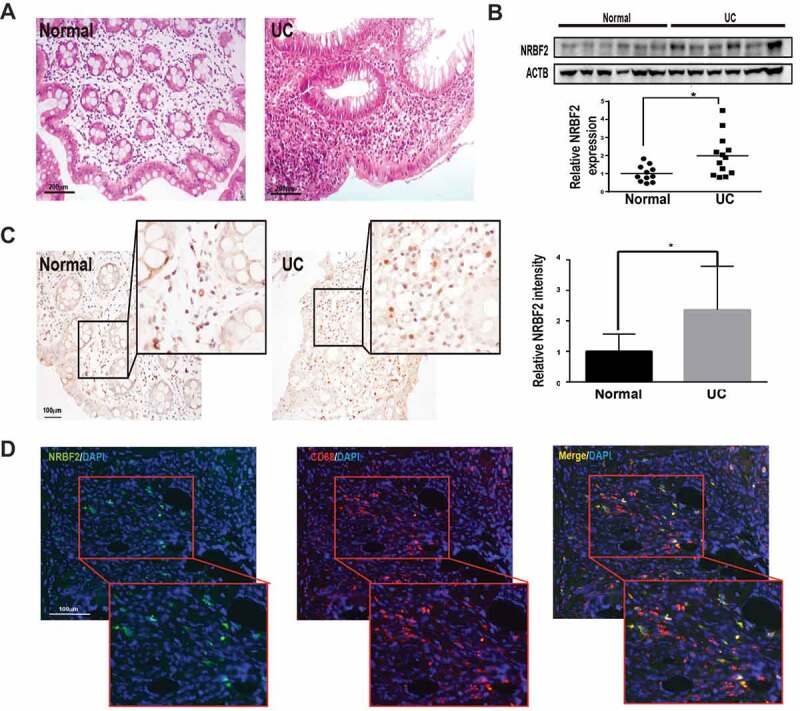
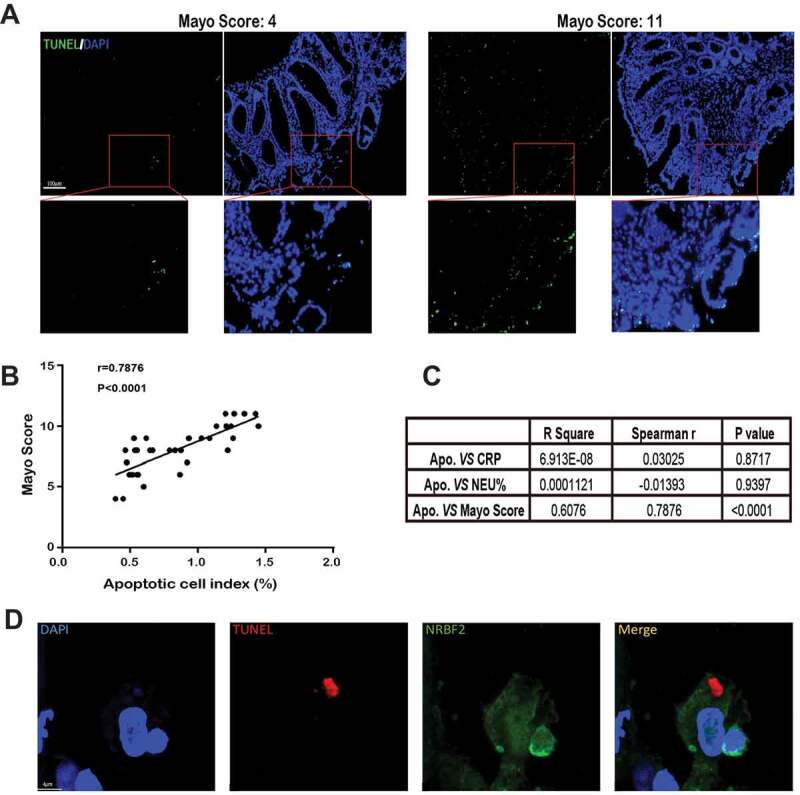
NRBF2, a regulatory subunit of the ATG14-BECN1/Beclin 1-PIK3C3/VPS34 complex, positively regulates macroautophagy/autophagy. In this study, we report that NRBF2 is required for the clearance of apoptotic cells and alleviation of inflammation during colitis in mice. NRBF2-deficient mice displayed much more severe colitis symptoms after the administration of ulcerative colitis inducer, dextran sulfate sodium salt (DSS), accompanied by prominent intestinal inflammation and apoptotic cell accumulation. Interestingly, we found that nrbf2-/- mice and macrophages displayed impaired apoptotic cell clearance capability, while adoptive transfer of nrbf2+/+ macrophages to nrbf2-/- mice alleviated DSS-induced colitis lesions. Mechanistically, NRBF2 is required for the generation of the active form of RAB7 to promote the fusion between phagosomes containing engulfed apoptotic cells and lysosomes via interacting with the MON1-CCZ1 complex and regulating the guanine nucleotide exchange factor (GEF) activity of the complex. Evidence from clinical samples further reveals the physiological role of NRBF2 in maintaining intestinal homeostasis. In biopsies of UC patient colon, we observed upregulated NRBF2 in the colon macrophages and the engulfment of apoptotic cells by NRBF2-positive cells, suggesting a potential protective role for NRBF2 in UC. To confirm the relationship between apoptotic cell clearance and IBD development, we compared TUNEL-stained cell counts in the UC with UC severity (Mayo Score) and observed a strong correlation between the two indexes, indicating that apoptotic cell population in colon tissue correlates with UC severity. The findings of our study reveal a novel role for NRBF2 in regulating apoptotic cell clearance to restrict intestinal inflammation.Abbreviation: ANOVA: analysis of variance; ATG14: autophagy related 14; ATG16L1: autophagy related 16-like 1 (S. cerevisiae); BMDM: bone marrow-derived macrophage; BSA: bovine serum albumin; CD: Crohn disease; CD68: CD68 molecule; CFP: cyan fluorescent protein; CMFDA: 5-chloromethylfluorescein diacetate; Co-IP, co-immunoprecipitation; CPR: C-reactive protein; Cy7: cyanine 7 maleimide; DAB: diaminobezidine 3; DAI: disease activity indexes; DAPI: 4'6-diamidino-2-phenylindole; DMEM: dulbecco's modified eagle's medium; DMSO: dimethyl sulfoxide; DOC: sodium deoxycholate; DSS: dextran sulfate sodium; EDTA: ethylenediaminetetraacetic acid; EGTA: ethylenebis (oxyethylenenitrilo) tetraacetic acid; FBS: fetal bovine serum; FITC: fluorescein isothiocyanate; FRET: Förster resonance energy transfer; GDP: guanine dinucleotide phosphate; GEF: guanine nucleotide exchange factor; GFP: green fluorescent protein; GTP: guanine trinucleotide phosphate; GWAS: genome-wide association studies; HEK293: human embryonic kidney 293 cells; HRP: horseradish peroxidase; IBD: inflammatory bowel disease; IgG: immunoglobin G; IL1B/IL-1β: interleukin 1 beta; IL6: interleukin 6; IRGM: immunity related GTPase M; ITGAM/CD11b: integrin subunit alpha M; KO: knockout; LRRK2: leucine rich repeat kinase 2; MAP1LC3/LC3: microtubule associated protein 1 light chain 3; MOI: multiplicity of infection; MPO: myeloperoxidase; NaCl: sodium chloride; NEU: neutrophil; NOD2: nucleotide binding oligomerization domain containing 2; NP40: nonidet-P40; NRBF2: nuclear receptor binding factor 2; PBS: phosphate buffer saline; PCR: polymerase chain reaction; PE: P-phycoerythrin; PIK3C3/VPS34: phosphatidylinositol 3-kinase catalytic subunit type 3; PtdIns3P: phosphatidylinositol-3-phosphate; PTPRC/CD45: protein tyrosine phosphatase receptor type C; SDS-PAGE: sodium dodecylsulphate-polyacrylamide gel electrophoresis; TBST: tris-buffered saline Tween-20; Tris-HCl: trihydroxymethyl aminomethane hydrochloride; TUNEL: TdT-mediated dUTP nick-end labeling; UC: ulcerative colitis; ULK1: unc-51 like autophagy activating kinase 1; WB: western blotting; WT: wild type; YFP: yellow fluorescent protein.

Keywords: Apoptotic cell clearance; MON1-CCZ1; NRBF2; RAB7; inflammatory bowel disease; macrophage.


Conflict of interest statement

The authors declare that no conflict of interest exists.

Figures

Figure 1.
Figure 1.
Nrbf2 knockout mice are susceptible to dextran sulfate sodium (DSS)-induced ulcerative colitis. (A) Western blotting of NRBF2 expression in the colon tissue from wild-type (WT) and nrbf2 knockout (KO) mice. (B) Body weights recorded daily in different groups (n = 9–11). 2% DSS in drinking water was administrated to DSS treatment groups in the first 9 d, following 2 d of normal drinking water. (C) Daily disease activity indexes (DAIs) of WT and nrbf2−/- mice after DSS treatment (n = 9–11). Mean ± S.E.M. (D) Length of colons from the different groups (left), and the representative images (right) (n = 9–11). (E) Representative HE staining images of the colon in each group. Scale bar: 200 µm. (F) Histological scoring according to the HE staining result (epithelium scoring, infiltration scoring, and total scoring) (n = 6–7). (G) Spleen weight indexes of the different groups (spleen weight/body weight [n = 9–11]). Mean ± S.D. (H) Determination of MPO (myeloperoxidase) activity in the colon lysates from the different groups (n = 7–8). Mean ±S.E.M. (I and J) Determination of IL6 and IL1B concentrations in colon lysates (n = 7–8). Mean ± S.E.M. (K) Representative images of TUNEL staining in the colon of mice from different groups. (red: TUNEL-positive, blue: DAPI). Scale bar: 100 µm. Right: Quantification of the TUNEL-positive cells in the colon tissue samples from the different groups (n = 8–11 samples). Mean ± S.E.M. In B and C, data were analyzed via two-way ANOVA. In D, E and H-K, data were analyzed via one-way ANOVA with the Tukey test. In G, data were analyzed via an unpaired Student’s t-test. *P < 0.05, **P < 0.01, ***P < 0.001
Figure 2.
Figure 2.
Nrbf2 knockout inhibits apoptotic cell clearance via impairing the phagocytic maturation. (A) and (C) PKH26-labeled events in isolated hepatocytes and splenocytes from WT and nrbf2−/- mice at the indicated times after the I. V. injection of PKH26-labeled apoptotic thymocytes (n = 3–5). Mean ± S.E.M. (B) and (D) Representative immunofluorescence images of frozen sections from WT and nrbf2−/- mouse liver and spleen at 24 h after the I. V. injection of apoptotic cells. Scale bar: 50 μm. (Red, PKH26-positive events; Blue, DAPI). (E) Residual fluorescence value after co-culturing BMDMs from WT and nrbf2−/- with CMFDA-stained apoptotic thymocytes for 48 h (n = 3). Mean ± S.D. (F) Flow cytometry analysis of WT and nrbf2−/- BMDMs at different times after co-culturing with CMFDA-labeled apoptotic cells for 30 min. (G) Representative time-lapse images after adding CMFDA-labeled apoptotic thymocytes to WT and nrbf2−/- BMDMs. (red: LysoTracker; green: CMFDA-stained apoptotic thymocytes). (H) The distribution analysis of engulfed-apoptotic thymocytes by recording the time required for lysosome-phagosome fusion in WT and nrbf2−/- BMDMs (Start point, green-colored apoptotic thymocytes being engulfed by BMDM; End point, green apoptotic thymocytes become yellow)
Figure 3.
Figure 3.
NRBF2 deficiency inhibits phagocytic maturation by prohibiting RAB7 recruitment. (A–C) Representative immunofluorescence images of RAB5A, RAB7, and LAMP1 expression around beads in WT and nrbf2−/- BMDMs after treatment with the latex beads for the indicated times. Scale bar: 5 μm. (D) Mean fluorescence density of RAB5A, RAB7, and LAMP1 around beads after treating BMDMs with the latex beads for 2 h (n = 40–45). Mean ± S.D. (E) Representative immunofluorescence images of LC3 expression around beads in WT and nrbf2−/- BMDMs after treatment with the latex beads for the indicated times. Scale bar: 5 μm. (F) Mean fluorescence density of LC3 around beads after treating BMDMs with the latex beads for the indicated times. In D and F data were analyzed via an unpaired Student’s t-test. *P < 0.05, **P < 0.01, ***P < 0.001
Figure 4.
Figure 4.
NRBF2 facilitates phagocytic maturation by enhancing RAB7 activity. (A) Representative time-lapse images of pRaichu-Rab7-transfected WT and nrbf2−/- BMDMs after adding apoptotic thymocytes. The cells are shown as color-coded FRET ratio (YFP/CFP) distributions (see color bar on the right). Scale bar: 10 μm. (B) Quantitative analysis of the relative FRET signal around the apoptotic cells at the indicated times (n = 5–9). Mean ± S.E.M. (C) The GTP-bound RAB7 protein levels in WT and nrbf2−/- BMDMs. Incubate GTP-agarose beads with protein lysates from WT, and nrbf2−/- BMDMs and GTP-bound RAB7 were detected by western blot (RAB7 antibody). (D) Confocal images of BMDM after transfection with CFP-Nrbf2 and RFP-Rab7. Scale bar: 5 μm. (E) Immunofluorescent staining images of LAMP1 after bead treatment for 2 h in WT, nrbf2−/-, and RFP-Rab7-transfected nrbf2−/- BMDMs. Scale bar: 5 μm. Right: Fluorescence intensity of LAMP1 around the phagosome (indicated by arrow). (F) Representative time-lapse images of CMFDA-stained apoptotic cells in WT, nrbf2−/-, and RFP-Rab7-transfected nrbf2−/- BMDMs after they were treated with the CMFDA-stained apoptotic cells. (G) Classification of apoptotic cells according to the time required for phagosomes moving into the swelling cell body. In B, data were analyzed via an unpaired Student’s t-test. *P < 0.05, **P < 0.01, ***P < 0.001
Figure 5.
Figure 5.
NRBF2 is involved in the GEF function regulation via binding to the MON1-CCZ1 complex. (A) Co-immunoprecipitation of GFP or GFP-NRBF2 with Flag-MON1 after co-transfection into HEK293 cells. Cells were co-transfected with Flag-Mon1 and GFP or Flag-Mon1 and GFP-Nrbf2. Using the GFP antibody to detect the GFP-NRBF2 expression in Flag-MON1 enriched-proteins. (B) Co-immunoprecipitation of GFP or GFP-NRBF2 with Flag-CCZ1 after co-transfection into HEK293 cells. Cells were co-transfected with Flag-Ccz1 and GFP or Flag-Ccz1 and GFP-Nrbf2. Using the GFP antibody to detect the GFP-NRBF2 expression in Flag-CCZ1 enriched-proteins. (C) Representative images after adding carboxylate-modified microspheres (2 μm) into Raw 264.7 cells that were transfected with GFP-Mon1 and HA-Nrbf2 for 2 h. Scale bar: 5 μm or 1 μm. (D) Co-immunoprecipitation of PIK3C3 or CCZ1 with NRBF2 endogenously after treating BMDMs with apoptotic cells at different time points. (E) In vitro measurement of the CCZ1 antibody-immunoprecipitated GEF activity in WT and nrbf2−/- BMDMs. Using the CCZ1 antibody to pull down proteins in WT and nrbf2−/- BMDMs. Then detect the GEF activity of these proteins. (F) Co-immunoprecipitation of PIK3C3 or NRBF2 with CCZ1 endogenously after treating WT or nrbf2−/- BMDMs with apoptotic cells after 12 h. (G) In vitro measurement of CCZ1 antibody IPed GEF activity in the presence or absence of SAR405 (PIK3C3 inhibitor) for 12 h. Treat BMDMs with DMSO or 1 μm SAR405 for 12 h, then use CCZ1 to pull down proteins for GEF activity determination. (H) A summary diagram shows the role of NRBF2 in regulating RAB7 GEF activity and apoptotic cell clearance during colitis pathogenesis
Figure 6.
Figure 6.
Adoptive transfer of macrophage from WT mice ameliorates DSS-induced-colitis in nrbf2−/- mice compared to the transfer of nrbf2−/- macrophage. WT or nrbf2−/- mice were injected WT or nrbf2−/- macrophages (1 x 10⁶ cells) via I. V. injection before the 1st day for DSS treatment. (A) Body weights recorded daily in different groups (n = 6–8). 2% DSS in drinking water was administrated to DSS treatment groups in the first 5 d, following 2 d of normal drinking water. Mean ± S.E.M. (B) Daily disease activity indexes (DAIs) of WT and nrbf2−/- mice after DSS treatment (n = 6–8). (C and D) Length of colons from the different groups (left), and the representative images in D (n = 6–8). (E) Determination of MPO (myeloperoxidase) activity in the colon lysates from the different groups (n = 6–8). Mean ±S.E.M. (F) Spleen weight indexes of the different groups (spleen weight/body weight [n = 6–8]. Mean ± S.D. (G) Representative images of TUNEL staining in the colon of mice from different groups. (green, TUNEL positive, blue, DAPI). Scale bar: 100 μm. (H) Quantification of the TUNEL-positive cells in the colon tissue samples from the different groups (n = 6–8 samples). Mean ± S.E.M. In A-C, E, F, and H, data were analyzed via one-way ANOVA with the Tukey test
Figure 7.
Figure 7.
NRBF2 expression is upregulated in the colon of UC patients. (A) Representative images of the HE staining of clinically normal and active UC human colon biopsies (n = 3). Scale bar: 200 μm. (B) Western blotting results in the NRBF2 expression in normal and active human UC human colon tissue. Below, Quantification of the western blotting results for relative NRBF2 expression that normalized with ACTB in normal and active UC human colon tissue (n = 11–13). Mean ± S.D. (C) Immunohistochemistry images of the NRBF2 staining of normal and active UC human colon samples (violets, nuclei; brown, NRBF2; n = 3 samples). Right, Quantification of IHC staining results of NRBF2 in normal and active UC human colon. Scale bar: 100 μm. (D) Colocalization of NRBF2 and CD68 in active human UC colon samples (n = 3 samples; red, CD68; green, NRBF2). Scale bar: 100 μm. Mean ± S.D. Data in B and C. were analyzed via an unpaired Student’s t-test. *P < 0.05
Figure 8.
Figure 8.
Apoptotic cell accumulation correlates with the Mayo score of ulcerative colitis (UC). (A) Representative images of TUNEL staining of UC patients’ colon biopsies in low and high Mayo Score. (Green: TUNEL staining, blue: DAPI). Scale bar: 100 μm. (B) A scatterplot with a regression line, illustrating the correlation between the apoptotic cell index of the colon and the relevant Mayo Score (33 patients). r, Spearman rank correlation coefficients. (C) Analyzing correlation indexes between apoptotic cell index and inflammatory markers in the peripheric blood system (CPR, C-reactive protein, NEU%, neutrophil %). (D) Representative images of TUNEL-positive debris in NRBF2-positive cells on human UC colon tissue (n = 2 samples). Scale bar: 4 μm. (green, NRBF2, red, TUNEL-positive nuclei)

References

    1. Baumgart DC, Sandborn WJ.. Crohn’s disease. Lancet. 2012;380:1590–1605. - PubMed
    1. Hampe J, Franke A, Rosenstiel P, et al. A genome-wide association scan of nonsynonymous SNPs identifies a susceptibility variant for Crohn disease in ATG16L1. Nat Genet. 2007;39:207. - PubMed
    1. Hugot J-P, Chamaillard M, Zouali H, et al. Association of NOD2 leucine-rich repeat variants with susceptibility to Crohn’s disease. Nature. 2001;411:599. - PubMed
    1. Barrett JC, Hansoul S, Nicolae DL, et al. Genome-wide association defines more than 30 distinct susceptibility loci for Crohn’s disease. Nat Genet. 2008;40:955. - PMC - PubMed
    1. Parkes M, Barrett JC, Prescott NJ, et al. Sequence variants in the autophagy gene IRGM and multiple other replicating loci contribute to Crohn’s disease susceptibility. Nat Genet. 2007;39:830. - PMC - PubMed

Publication types

MeSH terms

Substances

LinkOut - more resources