. 2020 Mar 11;16(3):e1008270.
doi: 10.1371/journal.pgen.1008270. eCollection 2020 Mar.

Drosophila insulin-like peptide 2 mediates dietary regulation of sleep intensity

Affiliations

Drosophila insulin-like peptide 2 mediates dietary regulation of sleep intensity

Elizabeth B Brown et al. PLoS Genet. .

Abstract

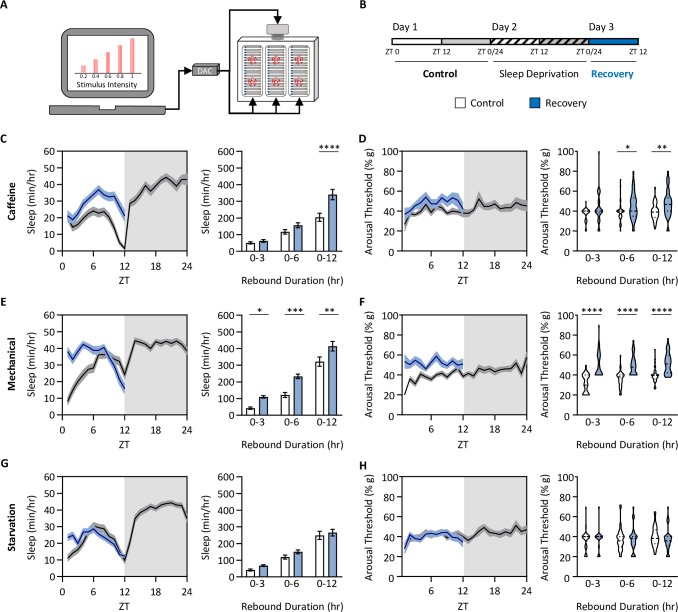
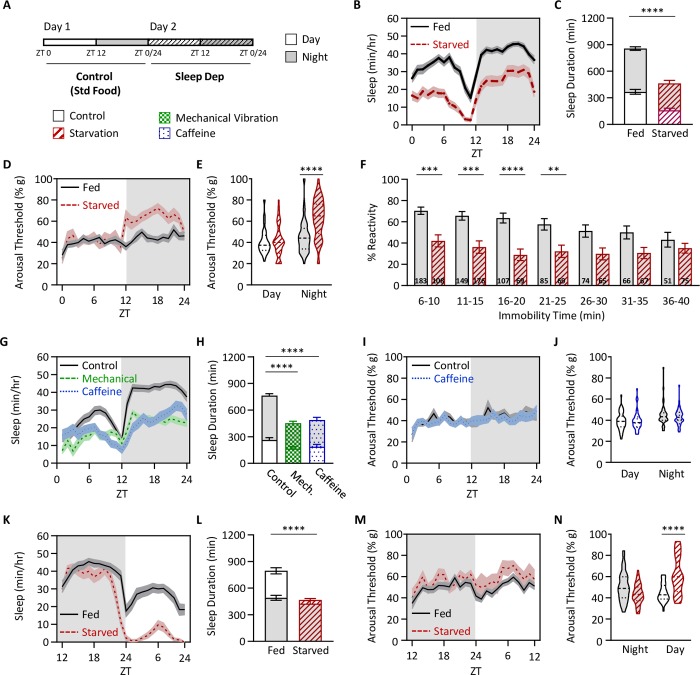
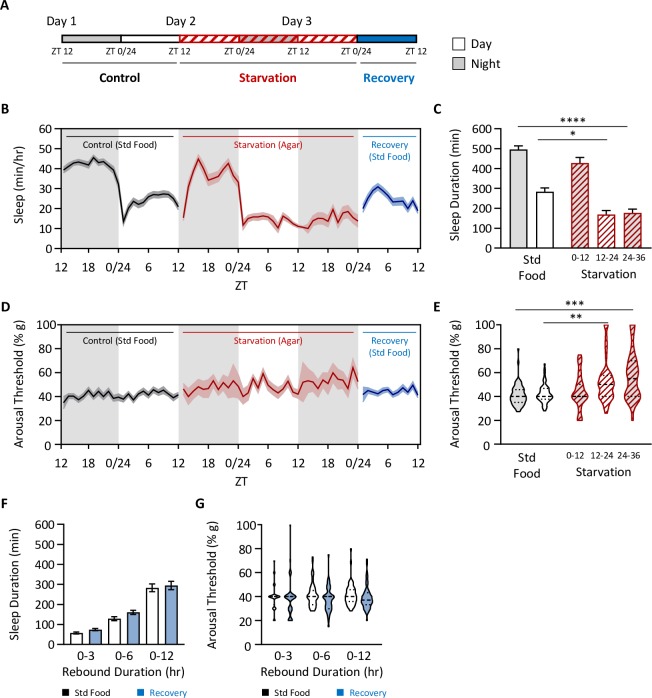
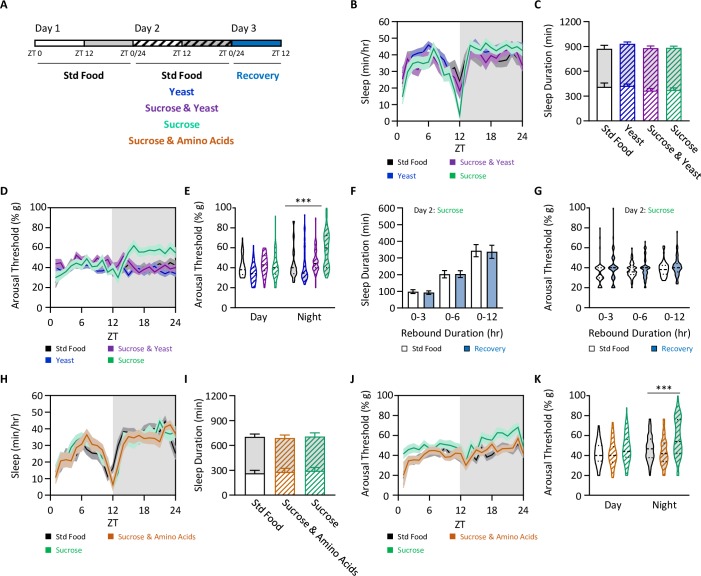
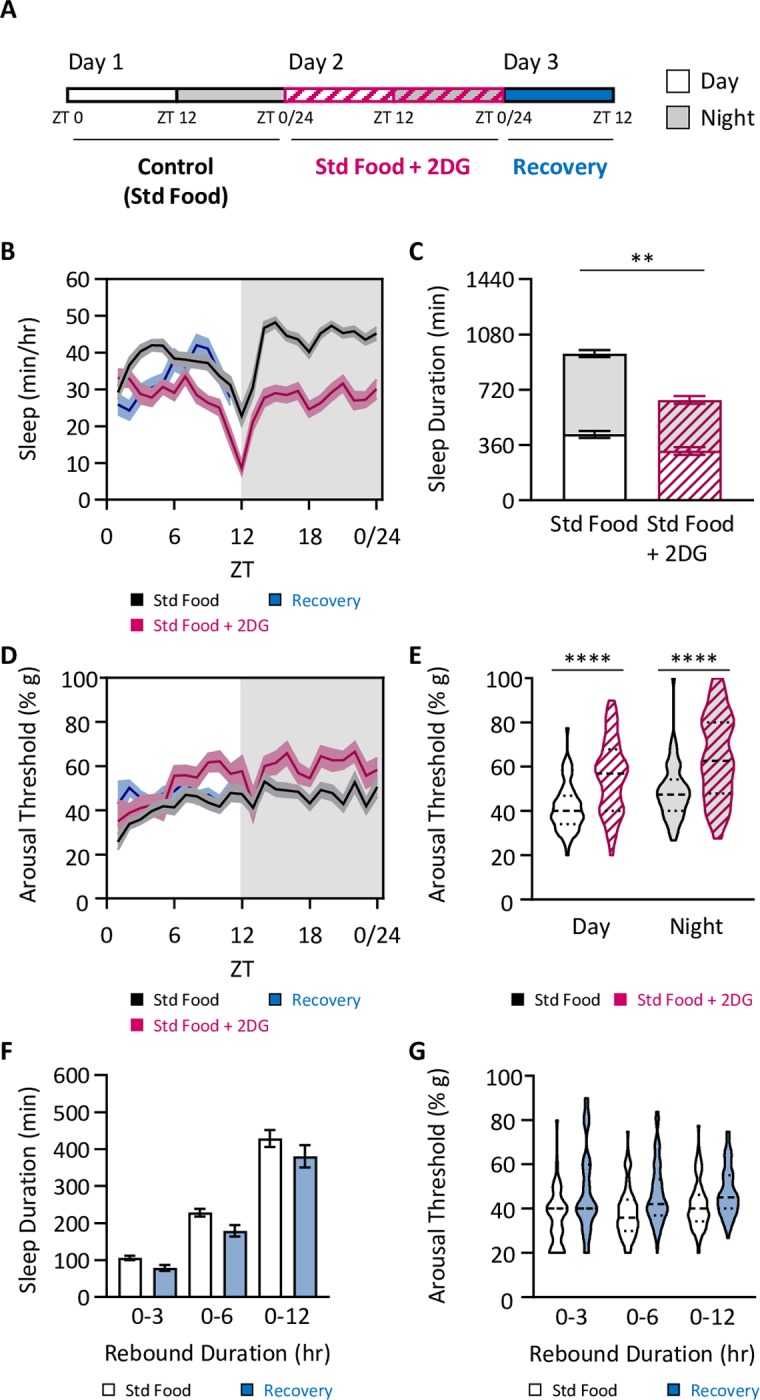
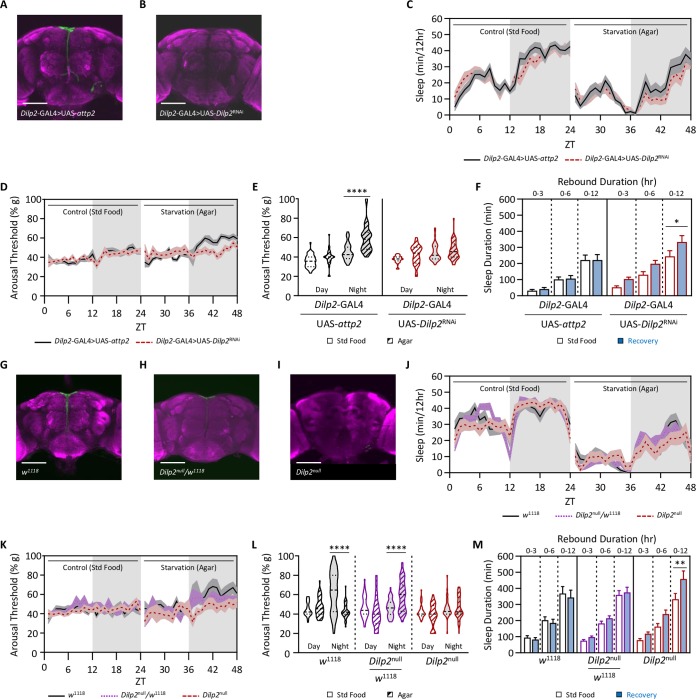
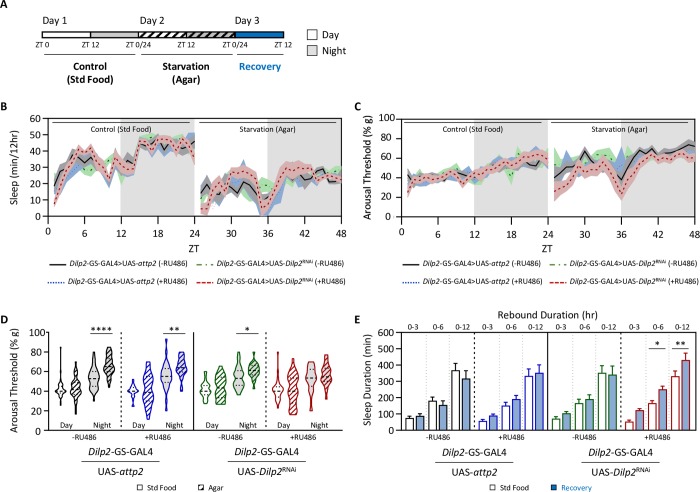
Sleep is a nearly universal behavior that is regulated by diverse environmental stimuli and physiological states. A defining feature of sleep is a homeostatic rebound following deprivation, where animals compensate for lost sleep by increasing sleep duration and/or sleep depth. The fruit fly, Drosophila melanogaster, exhibits robust recovery sleep following deprivation and represents a powerful model to study neural circuits regulating sleep homeostasis. Numerous neuronal populations have been identified in modulating sleep homeostasis as well as depth, raising the possibility that the duration and quality of recovery sleep is dependent on the environmental or physiological processes that induce sleep deprivation. Here, we find that unlike most pharmacological and environmental manipulations commonly used to restrict sleep, starvation potently induces sleep loss without a subsequent rebound in sleep duration or depth. Both starvation and a sucrose-only diet result in increased sleep depth, suggesting that dietary protein is essential for normal sleep depth and homeostasis. Finally, we find that Drosophila insulin like peptide 2 (Dilp2) is acutely required for starvation-induced changes in sleep depth without regulating the duration of sleep. Flies lacking Dilp2 exhibit a compensatory sleep rebound following starvation-induced sleep deprivation, suggesting Dilp2 promotes resiliency to sleep loss. Together, these findings reveal innate resilience to starvation-induced sleep loss and identify distinct mechanisms that underlie starvation-induced changes in sleep duration and depth.


Conflict of interest statement

I have read the journal's policy and the authors of this manuscript have the following competing interests: RF and BK are owners of BFK Labs that design and sell the Arousal Systems used in this paper. Both are also academic scientists and the analysis here required custom programming and analysis. Therefore, we feel that they meet the requirements outlined in the journal for authorship.

Figures

Fig 1
Fig 1. Homeostatic rebound following sleep deprivation is treatment dependent.
(A) The Drosophila Arousal Tracking (DART) system records fly movement while simultaneously controlling mechanical stimuli via a digital analog converter (DAC). Here, mechanical stimuli are delivered to three platforms, each housing twenty flies. Mechanical stimuli of increasing strength were used to assess arousal threshold (shown on the computer screen). Arousal thresholds were determined hourly, starting at ZT0 [25]. (B) Total sleep and arousal threshold were assessed for 24 hrs on standard food (Control). Flies were then sleep deprived (Sleep Dep) for 24hrs using one of three treatments: 0.5mg/mL caffeine, mechanical vibration, or starvation, after which homeostatic rebound (Recovery) was assessed in the subsequent 12 hrs. Comparisons were made between the first 12 hrs of the control day (white box) and the homeostatic rebound (blue box). (C-H) Daytime sleep and arousal thresholds prior to and after 24 hrs of sleep deprivation. Profiles of sleep and arousal threshold are shown prior to the quantification of each trait. Measurements of homeostatic rebound were assessed in 3-, 6-, and 12-hr increments. (C,D) Sleep (C) and arousal threshold (D) significantly increases after 24hrs on standard food media containing 0.5mg/mL caffeine (Sleep: two-way ANOVA: F1,228 = 16.76, P<0.0001; Arousal threshold: REML: F1,76 = 5.691, P = 0.0205; N = 38–40). (E,F) Sleep (E) and arousal threshold (F) significantly increases after 24hrs of randomized mechanical vibration (Sleep: two-way ANOVA: F1,234 = 35.11, P<0.0001; Arousal threshold: REML: F1,78 = 63.07, P<0.0001; N = 40). (G,H) There is no difference in sleep (G) or arousal threshold (H) after 24hrs of starvation (Sleep: two-way ANOVA: F1,210 = 3.272, P = 0.0800; Arousal threshold: REML: F1,70 = 0.0251, P = 0.8746; N = 36). For profiles, shaded regions indicate +/- standard error from the mean. White background indicates daytime, while gray background indicates nighttime. For sleep measurements, error bars represent +/- standard error from the mean. For arousal threshold measurements, the median (dashed line) as well as 25th and 75th percentiles (dotted lines) are shown. * = P<0.05; ** = P<0.01; *** = P<0.001; **** = P<0.0001.
Fig 2
Fig 2. Starvation increases arousal threshold.
(A) Total sleep and arousal threshold were assessed for 24 hrs on standard food (Control) and then starved for 24 hrs on agar (Sleep Dep). Flies were flipped to agar at ZT0. (B) Sleep profiles of fed and starved flies. (C) Sleep duration decreases in the starved state (two-way ANOVA: F1,220 = 54.63, P<0.0001), and occurs in both the day (P<0.0001) and night (P<0.0001). (D) Profile of arousal threshold of fed and starved flies. (E) Arousal threshold significantly increases in the starved state (REML: F1,110 = 34.68, P<0.0001), and occurs only at night (day: P = 0.2210; night: P<0.0001). (F) Sleep depth is not correlated with sleep duration in starved flies. The proportion of flies that reacted to a mechanical stimulus for each bin of immobility was assessed. Starved flies are significantly less likely to respond to a mechanical stimulus during sleep (ANOVA: F1,1230 = 68.47, P<0.0001), specifically when flies have been sleeping for less than 30 min (6–10 min: P<0.0001; 11–15 min: P = 0.0002; 16–20 min: P<0.0001; 21–25 min: P = 0.0094; 26–30 min: P = 0.0538). Numbers within each bar represent the frequency of individuals for each bin of immobility. All measurements were taken at night. (G-J) Sleep and arousal threshold measurements were taken over a 24 hr period from flies on standard food media or 1% agar. Flies were flipped to agar at ZT12. (G) Sleep profiles of fed and starved flies. (H) Sleep duration decreases in the starved state (two-way ANOVA: F1,172 = 32.22, P<0.0001), but occurs only during the day (day: P<0.0001; night: P = 0.2036). (I) Profile of arousal threshold of fed and starved flies. (J) Arousal threshold significantly increases in the starved state (REML: F1,74 = 9.248, P<0.0027) and occurs only during the day (day: P<0.0001; night: P = 0.0960). (K-N) Unlike starvation, other methods of sleep deprivation do not increase nighttime arousal threshold. Flies were sleep deprived for 24 hrs using either mechanical vibration or 0.5mg/mL caffeine. (K) Sleep profile. (L) Relative to control, sleep duration significantly decreases for each method of sleep deprivation (two-way ANOVA: F1,234 = 21.58, P<0.0001), and occurs only at night (P<0.0001). (M) Profile of arousal threshold. (N) Arousal threshold remains unchanged when using each of the described methods of sleep deprivation (REML: F1,72 = 0.2563, P = 0.6142, N = 38). Arousal threshold via mechanical vibration was unable to be calculated since the mechanical vibration used to assess arousal threshold was being used to implement sleep deprivation. For profiles, shaded regions indicate +/- standard error from the mean. White background indicates daytime, while gray background indicates nighttime. For sleep measurements, error bars represent +/- standard error from the mean. For arousal threshold measurements, the median (dashed line) as well as 25th and 75th percentiles (dotted lines) are shown. ** = P<0.01; *** = P<0.001; **** = P<0.0001.
Fig 3
Fig 3. The absence of a homeostatic rebound following starvation is independent of starvation duration.
(A) Total sleep and arousal threshold were assessed for 24 hrs on standard food (Control), for a subsequent 36 hrs on agar (Starvation), and then when transferred back to standard food to assess homeostatic rebound (Recovery). Flies were flipped to agar at ZT12. (B) Sleep profile. (C) Sleep duration decreases in the starved state (two-way ANOVA: F4,284 = 20.44, P<0.0001). Post hoc analyses revealed that this occurs after 12hr of starvation and is maintained over time (0–12: P = 0.5706; 12–24: P = 0.0499; 24–36: P<0.0001). (D) Profile of arousal threshold. (E) Arousal threshold significantly increases in the starved state (Kruskal-Wallis test: H = 29.72, P<0.0001; N = 57–59). Post hoc analyses revealed that this occurs after 12hr of starvation and is maintained over time (0–12: P>0.9999; 12–24: P = 0.0006; 24–36: P = 0.0003). (F-G) There is no homeostatic rebound following 36 hrs of starvation. Homeostatic rebound was measured as described in Fig 1B and was assessed in 3-, 6-, and 12-hr increments. (F) There is no difference in sleep duration (two-way ANOVA: F1,336 = 3.451, P = 0.0641). (G) There is no difference in arousal threshold (REML: F1,108 = 3.276, P = 0.0731, N = 55–59). For profiles, shaded regions indicate +/- standard error from the mean. White background indicates daytime, while gray background indicates nighttime. Error bars represent +/- standard error from the mean. For arousal threshold measurements, the median (dashed line) as well as 25th and 75th percentiles (dotted lines) are shown. *** = P<0.001.
Fig 4
Fig 4. The absence of dietary protein increases sleep depth.
(A) Sleep and arousal threshold measurements were taken over a 24 hr period from flies fed standard food media, 2% yeast, 2% yeast and 5% sucrose, 5% sucrose, or 5% sucrose and 2.5x amino acids. Comparisons were then made between flies fed standard food media and each of the subsequent diets. (B) Sleep profile. (C) Diet does not affect sleep duration (two-way ANOVA: F1,396 = 0.3886, P = 0.7612). (D) Arousal threshold profile. (E) Diet does affect nighttime sleep depth (REML: F3,183 = 11.70, P<0.0001, N = 46–53). Post hoc analyses revealed a significant increase in nighttime arousal threshold when flies are fed 5% sucrose, compared to standard food (day: P>0.9999; night: P<0.0001). (F-G) There is no homeostatic rebound following 24 hrs of sucrose feeding. Homeostatic rebound was measured as described in Fig 1B and was assessed in 3-, 6-, and 12-hr increments. (F) There is no difference in sleep duration (two-way ANOVA: F1,312 = 0.0344, P = 0.8530). (G) There is no difference in arousal threshold (REML: F1,88 = 2.738, P = 0.1005, N = 46–53). (H-K) Adding amino acids to sucrose restores sleep depth. (H) Sleep profile. (I) Again, diet does not affect sleep duration (two-way ANOVA: F2,140 = 0.0193, P = 0.9808). (J) Arousal threshold profile. (K) Diet does affect arousal threshold (REML: F2,180 = 11.98, P<0.0001, N = 20–33). Post hoc analyses revealed a significant increase in nighttime arousal threshold when flies are fed 5% sucrose, compared to standard food (day: P = 0.1206; night: P<0.0001) and when sucrose is supplemented with amino acids (day: P = 0.1362; night: P<0.0001). For profiles, shaded regions indicate +/- standard error from the mean. White background indicates daytime, while gray background indicates nighttime. Error bars represent +/- standard error from the mean. For arousal threshold measurements, the median (dashed line) as well as 25th and 75th percentiles (dotted lines) are shown. *** = P<0.001.
Fig 5
Fig 5. Inhibition of glycolysis phenocopies the yeast-dependent modulation of arousal threshold.
(A) Total sleep and arousal threshold were assessed for 24 hrs on standard food (black outlined boxes), standard food + 2-deoxyglucose (2DG; pink outlined boxes with hatches), and then when transferred back to standard food. (B) Sleep profiles. (C) Sleep duration decreases when 2DG is included in the diet (two-way ANOVA: F1,190 = 38.77, P<0.0001), and occurs during both the day (P = 0.0040) and night (P<0.0001). (D) Profile of arousal threshold. (E) Arousal threshold significantly increases when 2-DG is included in the diet (REML: F1,111 = 71.07, P<0.0001, N = 46–51), and occurs during both the day (P<0.0001) and night (P<0.0001). (F-G) Measurements of homeostatic rebound following 24 hrs of 2DG feeding were assessed in 3-, 6-, and 12-hr increments. (F) Although there is a significant effect of treatment on sleep duration (two-way ANOVA: F1,285 = 7.943, P = 0.0052), post hoc analyses revealed no evidence of a homeostatic rebound for any timepoint measured (0–3 hrs: P = 0.6399; 0–6 hrs: P = 0.1582; 0–12 hrs: P = 0.1661). (G) Although there is a significant effect of treatment arousal threshold (REML: F1,121 = 5.426, P<0.0231, N = 46–51), post hoc analyses revealed no evidence of a homeostatic rebound for any timepoint measured (0–3 hrs: P = 0.3274; 0–6 hrs: P = 0.0822; 0–12 hrs: P = 0.4670). For profiles, shaded regions indicate +/- standard error from the mean. White background indicates daytime, while gray background indicates nighttime. For sleep measurements, error bars represent +/- standard error from mean. For arousal threshold measurements, the median (dashed line) as well as 25th and 75th percentiles (dotted lines) are shown. ** = P<0.01; **** = P<0.0001.
Fig 6
Fig 6. Dilp2 uniquely regulates arousal threshold during starvation.
Total sleep and arousal threshold were assessed for 24 hrs on standard food. Flies were then sleep deprived by starving them for the following 24hrs. Homeostatic rebound was then assessed during the subsequent 12 hrs. (A,B) Immunohistochemistry using Dilp2 antibody (green). For each image, the brain was counterstained with the neuropil marker nc82 (magenta). Scale bar = 100μm. In comparison with the Dilp2-GAL4>UAS-attp2 control (A), Dilp2 protein is reduced in Dilp2-GAL4>UAS-Dilp2RNAi (B). (C) Compared to the control (Dilp2-GAL4>UAS-attp2), knockdown of Dilp2 in Dilp2-expressing neurons (Dilp2-GAL4>UAS-Dilp2RNAi) has no effect on nighttime sleep duration (two-way ANOVA: F1,146 = 2.164, P = 0.1435), however there is a significant effect of starvation (two-way ANOVA: F1,146 = 26.78, P<0.0001). For each genotype, post hoc analyses revealed a significant decrease in nighttime sleep duration when starved (Dilp2-GAL4>UAS-attp2: P = 0.0008; Dilp2-GAL4>UAS-Dilp2RNAi: P = 0.0002), when compared to standard food. (D) There is a significant effect of genotype on nighttime arousal threshold (REML: F1,76 = 18.22, P<0.0001). Post hoc analyses revealed that while controls significantly increase nighttime arousal threshold during starvation (Dilp2-GAL4>UAS-attp2: P<0.0001), there is no effect of knockdown of Dilp2 in Dilp2-expressing neurons on arousal threshold (Dilp2-GAL4>UAS-Dilp2RNAi: P = 0.4053). (E-F) Measurements of homeostatic rebound following 24 hrs of starvation were assessed in 3-, 6-, and 12-hr increments. (E) There is a significant effect of genotype on sleep duration following 24 hrs of starvation (two-way ANOVA: F1,146 = 8.651, P = 0.0038). Post hoc analyses revealed that in control flies there was no change in sleep duration for any timepoint measured (Dilp2-GAL4>UAS-attp2: 0–3 hrs: P = 0.9849; 0–6 hrs: P = 0.9974; 0–12 hrs: P>0.9999). However, knockdown of Dilp2 in Dilp2-expressing neurons significantly increases rebound sleep between 6 and 12 hrs after rebound onset (Dilp2-GAL4>UAS-Dilp2RNAi: 0–3 hrs: P = 0.4030; 0–6 hrs: P = 0.1725; 0–12 hrs: P = 0.0450). (F) Compared to the control (Dilp2-GAL4>UAS-attp2), knockdown of Dilp2 in Dilp2-expressing neurons (Dilp2-GAL4>UAS-Dilp2RNAi) has no effect on arousal threshold following 24 hrs of starvation (REML: F1,76 = 0.4683, P = 0.4954). (G-I) Immunohistochemistry using DILP2 antibody (green). For each image, the brain was counterstained with the neuropil marker nc82 (magenta). Scale bar = 100μm. In comparison with the w1118 control (H), DILP2 protein is present in heterozygotes (I), while it is absent in Dilp2null mutants (J). (J) In comparison to the control (w1118), there is no effect on nighttime sleep duration in Dilp2null heterozygotes or Dilp2null mutants (two-way ANOVA: F1,231 = 0.1994, P = 0.8194), however there is a significant effect of starvation (two-way ANOVA: F1,231 = 59.11, P<0.0001). For all three genotypes, post hoc analyses revealed a significant decrease in nighttime sleep duration when starved (w1118: P = 0.0002; w1118>Dilp2null: P<0.0001; Dilp2null: P<0.0001). (K) There is a significant effect of genotype on nighttime arousal threshold (REML: F2,117 = 10.03, P<0.0001). Post hoc analyses revealed that while control flies (w1118) and Dilp2null heterozygotes significantly increase nighttime arousal threshold during starvation (w1118: P<0.0001; w1118>Dilp2null: P<0.0001), there is no effect on arousal threshold in Dilp2null mutants (P = 0.9973). (L-M) Measurements of homeostatic rebound following 24 hrs of starvation were assessed in 3-, 6-, and 12-hr increments. (L) There is a significant effect of genotype on sleep duration following 24 hrs of starvation (two-way ANOVA: F1,231 = 3.7810, P = 0.0531). Post hoc analyses revealed no change in sleep duration for any timepoint measured in control flies and Dilp2 heterozygotes (w1118: 0–3 hrs: P = 0.9876; 0–6 hrs: P = 0.9693; 0–12 hrs: P = 0.9108; w1118>Dilp2null: 0–3 hrs: P = 0.8178; 0–6 hrs: P = 0.5672; 0–12 hrs: P = 0.9193), however sleep duration does significantly increase in Dilp2null mutants (Dilp2null: 0–3 hrs: P = 0.7004; 0–6 hrs: P = 0.1719; 0–12 hrs: P = 0.0072). (M) In comparison to the control (w1118), there is no effect on arousal threshold following 24 hrs of starvation in Dilp2null heterozygotes or Dilp2null mutants (REML: F2,117 = 1.420, P = 0.2347). For sleep measurements, error bars represent +/- standard error from the mean. For arousal threshold measurements, the median (dashed line) as well as 25th and 75th percentiles (dotted lines) are shown. * = P<0.05; ** = P<0.01; *** = P<0.001; **** = P<0.0001.
Fig 7
Fig 7. Dilp2 acutely regulates arousal threshold during starvation in adults.
(A) Silencing of Dilp2 expression was temporally controlled using Dilp2-Geneswitch (GS). Flies were reared to adulthood and aged in the absence of RU486. Then, either solvent alone (-RU486) or RU486 (+RU486) was added to the diet 24 hrs prior to testing in the DART. (B) Total sleep and arousal threshold were assessed for 24 hrs on standard food (Day 1). Flies were then sleep deprived by starving them for the following 24hrs (Day 2). Homeostatic rebound was then assessed during the subsequent 12 hrs (Day 3). (C) There is no effect of genotype on nighttime sleep duration (two-way ANOVA: F3,67 = 0.1975, P = 0.8977), however there is a significant effect of starvation (two-way ANOVA: F1,67 = 74.34, P<0.0001). For each genotype, post hoc analyses revealed a significant decrease in nighttime sleep duration when starved (Dilp2-GS-GAL4>UAS-attp2/-RU486: P = 0.0002; Dilp2-GS-GAL4>UAS-attp2/+RU486: P = 0.0003; Dilp2-GS-GAL4>UAS-Dilp2RNAi/-RU486: P<0.0001; Dilp2-GS-GAL4>UAS-Dilp2RNAi/+RU486: P = 0.006), when compared to standard food. (D) There is a significant effect of genotype on nighttime arousal threshold (REML: F1,77 = 49.98, P<0.0001). Post hoc analyses revealed that while controls significantly increase nighttime arousal threshold during starvation (Dilp2-GS-GAL4>UAS-attp2/-RU486: P<0.0001; Dilp2-GS-GAL4>UAS-attp2/+RU486: P = 0.0025; Dilp2-GS-GAL4>UAS-Dilp2RNAi/-RU486: P = 0.0103), there is no effect of knockdown of Dilp2 in Dilp2-expressing neurons on arousal threshold (Dilp2-GS-GAL4>UAS-Dilp2RNAi/+RU486: P = 0.2989). (E-F) Measurements of homeostatic rebound following 24 hrs of starvation were assessed in 3-, 6-, and 12-hr increments. (E) There is a significant effect of genotype on sleep duration following 24 hrs of starvation (two-way ANOVA: F3,170 = 2.948, P = 0.0344). Post hoc analyses revealed that in the controls, there were no change in sleep duration for any timepoint measured (Dilp2-GS-GAL4>UAS-attp2/-RU486: 0–3 hrs: P = 0.9864; 0–6 hrs: P = 0.9022; 0–12 hrs: P = 0.5590; Dilp2-GS-GAL4>UAS-attp2/+RU486: 0–3 hrs: P = 0.9226; 0–6 hrs: P = 0.7724; 0–12 hrs: P = 0.9710; Dilp2-GS-GAL4>UAS-Dilp2RNAi/-RU486: 0–3 hrs: P = 0.8609; 0–6 hrs: P = 0.9627; 0–12 hrs: P = 0.9939). However, knockdown of Dilp2 in Dilp2-expressing neurons significantly increases rebound sleep between 3 and 12 hrs after rebound onset (Dilp2-GS-GAL4>UAS-Dilp2RNAi/+RU486: 0–3 hrs: P = 0.1174; 0–6 hrs: P = 0.0395; 0–12 hrs: P = 0.0113). (F) Compared to the controls, knockdown of Dilp2 in Dilp2-expressing neurons (Dilp2-GS-GAL4>UAS-Dilp2RNAi/+RU486) has no effect on arousal threshold following 24 hrs of starvation (REML: F3,134 = 1.489, P = 0.2203). For sleep measurements, error bars represent +/- standard error from the mean. For arousal threshold measurements, the median (dashed line) as well as 25th and 75th percentiles (dotted lines) are shown. * = P<0.05; ** = P<0.01; *** = P<0.001; **** = P<0.0001.

References

    1. Keene AC, Duboue ER. The origins and evolution of sleep. J Exp Biol. 2018;12: jeb159533. 10.1242/jeb.159533 - DOI - PMC - PubMed
    1. Joiner WJ. Unraveling the evolutionary determinants of sleep. Curr Biol. 2016;26: R1073–R1087. 10.1016/j.cub.2016.08.068 - DOI - PMC - PubMed
    1. Allada R, Siegel JM. Unearthing the phylogenetic roots of sleep. Curr Biol. 2008;18: R670–R679. 10.1016/j.cub.2008.06.033 - DOI - PMC - PubMed
    1. Donlea JM. Neuronal and molecular mechanisms of sleep homeostasis. Curr Opin Insect Sci. 2017;24: 51–57. 10.1016/j.cois.2017.09.008 - DOI - PubMed
    1. Tougeron K, Abram PK. An ecological perspective on sleep disruption. Am Nat. 2017;190: E55–E66. 10.1086/692604 - DOI - PubMed

Publication types

LinkOut - more resources