. 2020 Apr 16;78(2):275-288.e6.
doi: 10.1016/j.molcel.2020.02.017. Epub 2020 Mar 10.

Stepwise Promoter Melting by Bacterial RNA Polymerase

Affiliations

Stepwise Promoter Melting by Bacterial RNA Polymerase

James Chen et al. Mol Cell. .

Abstract

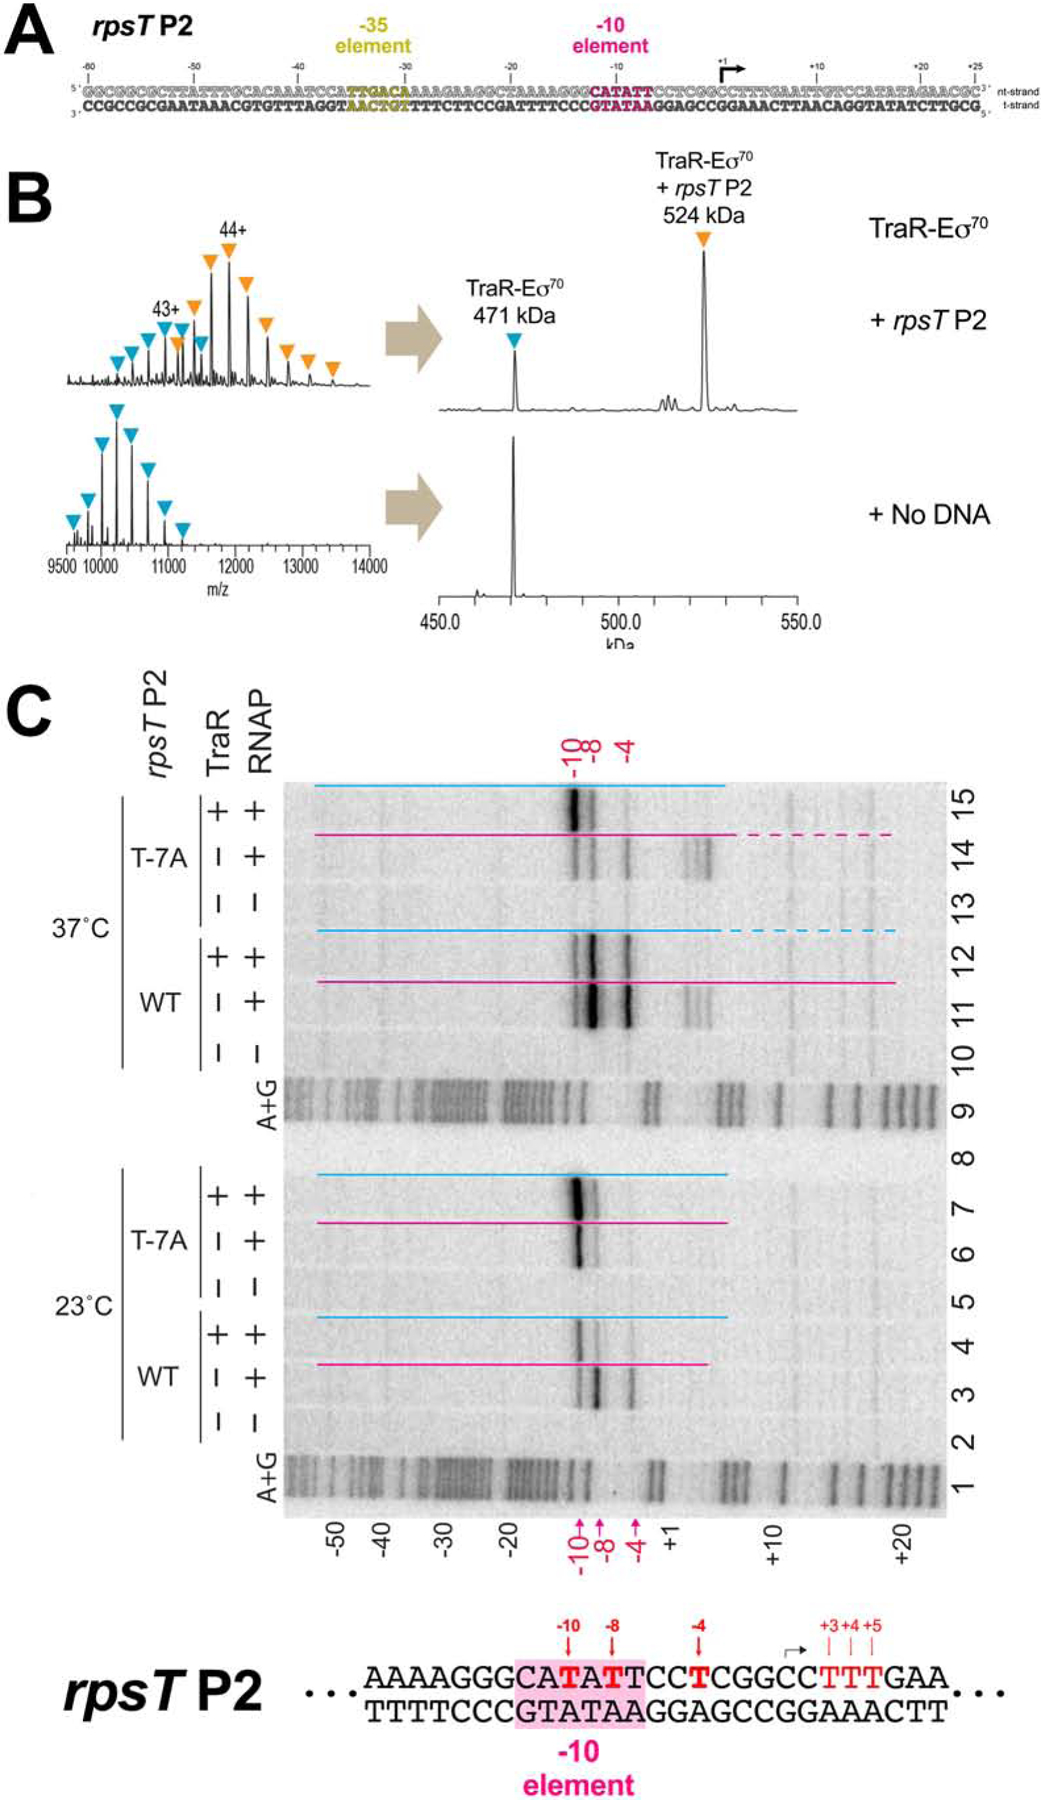
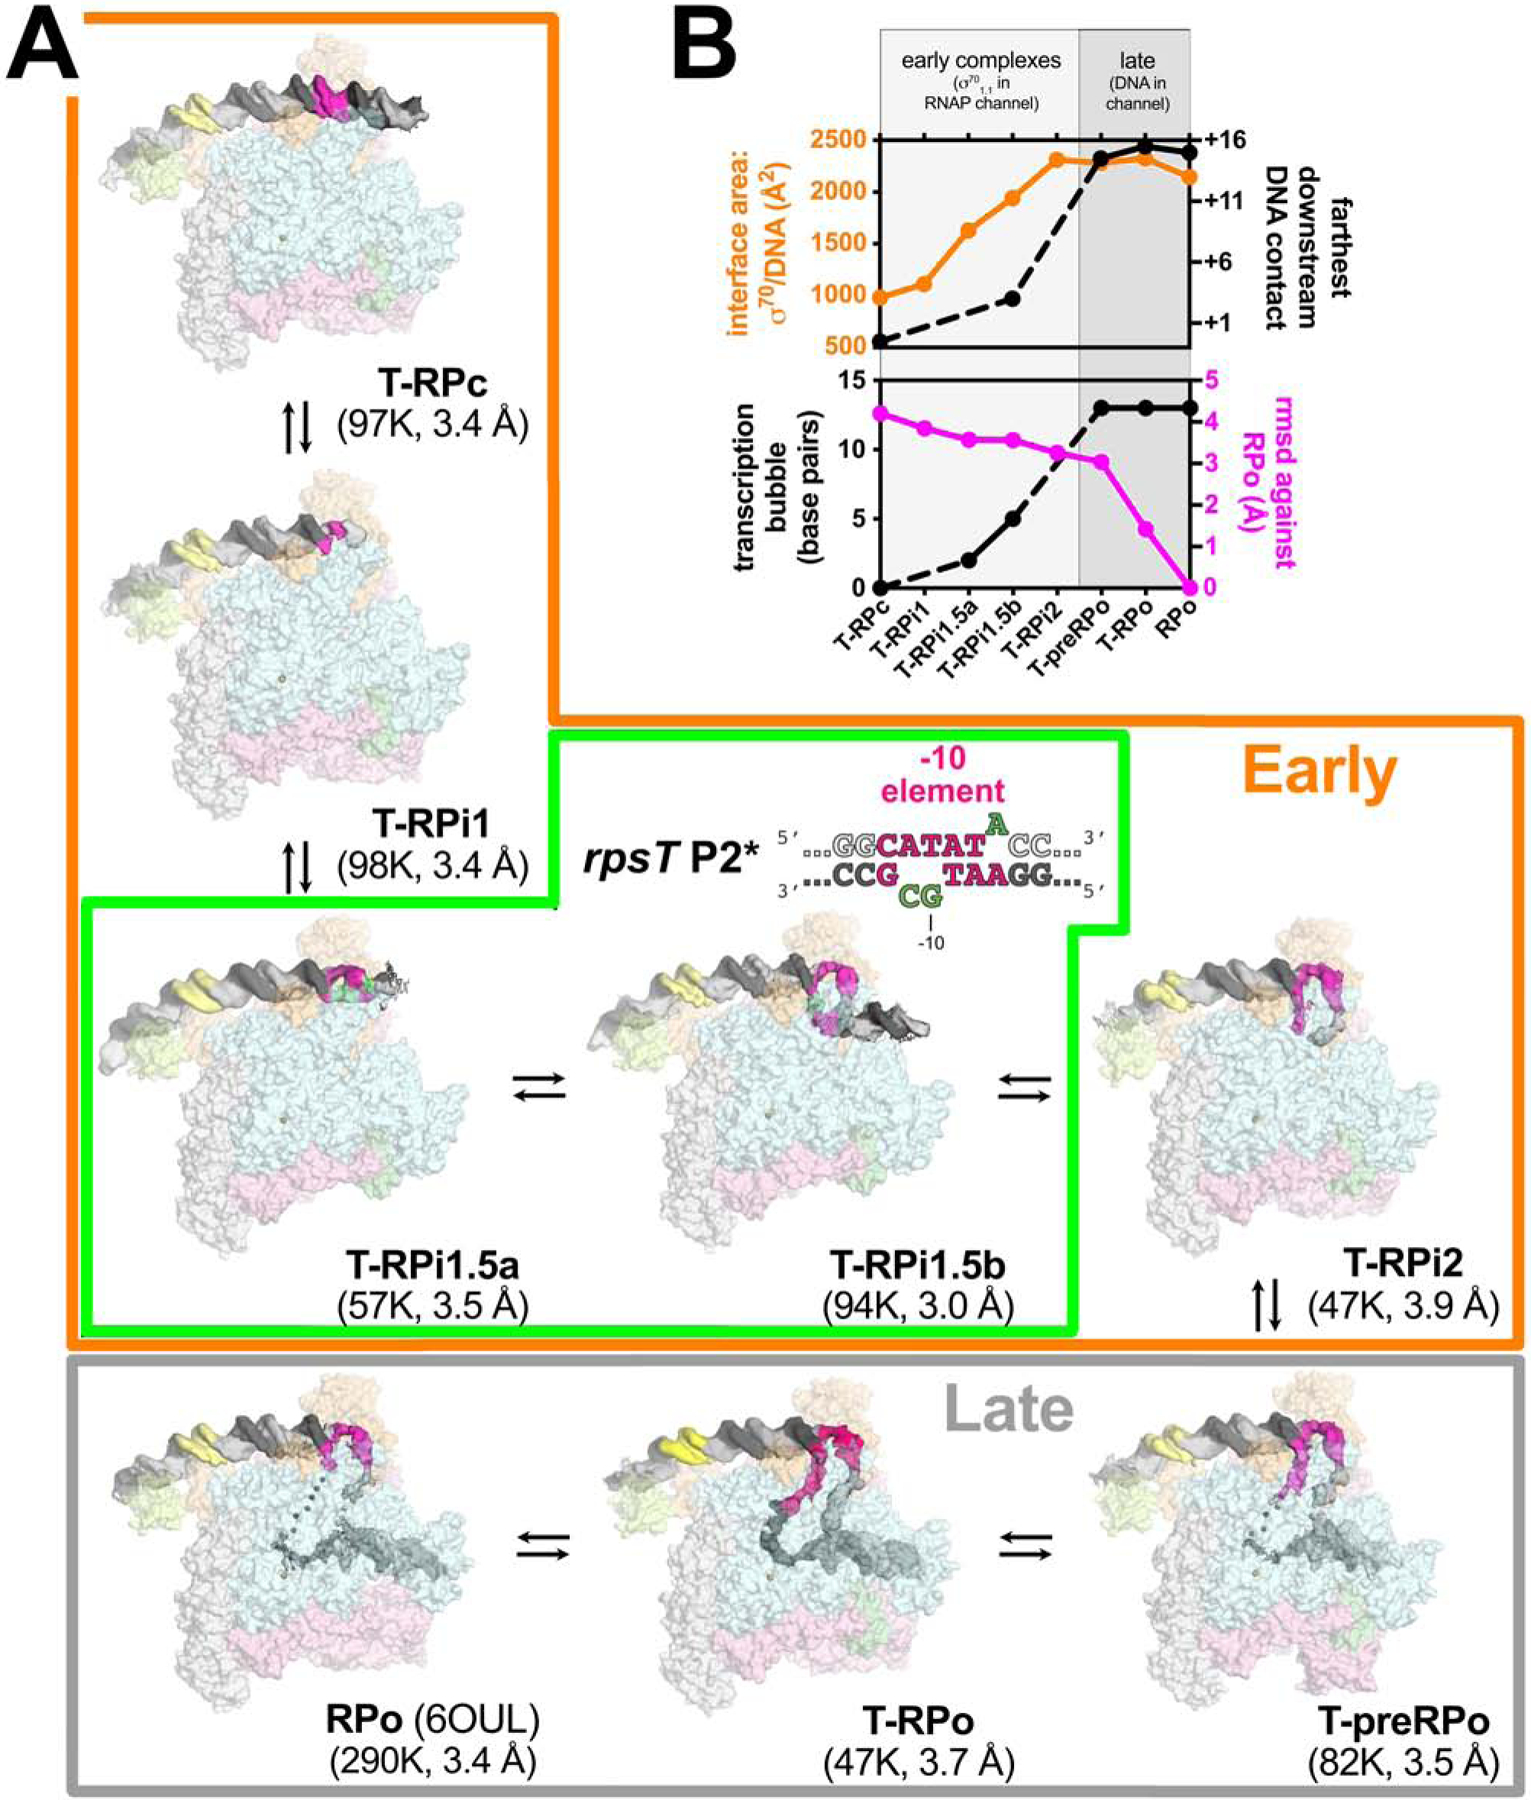
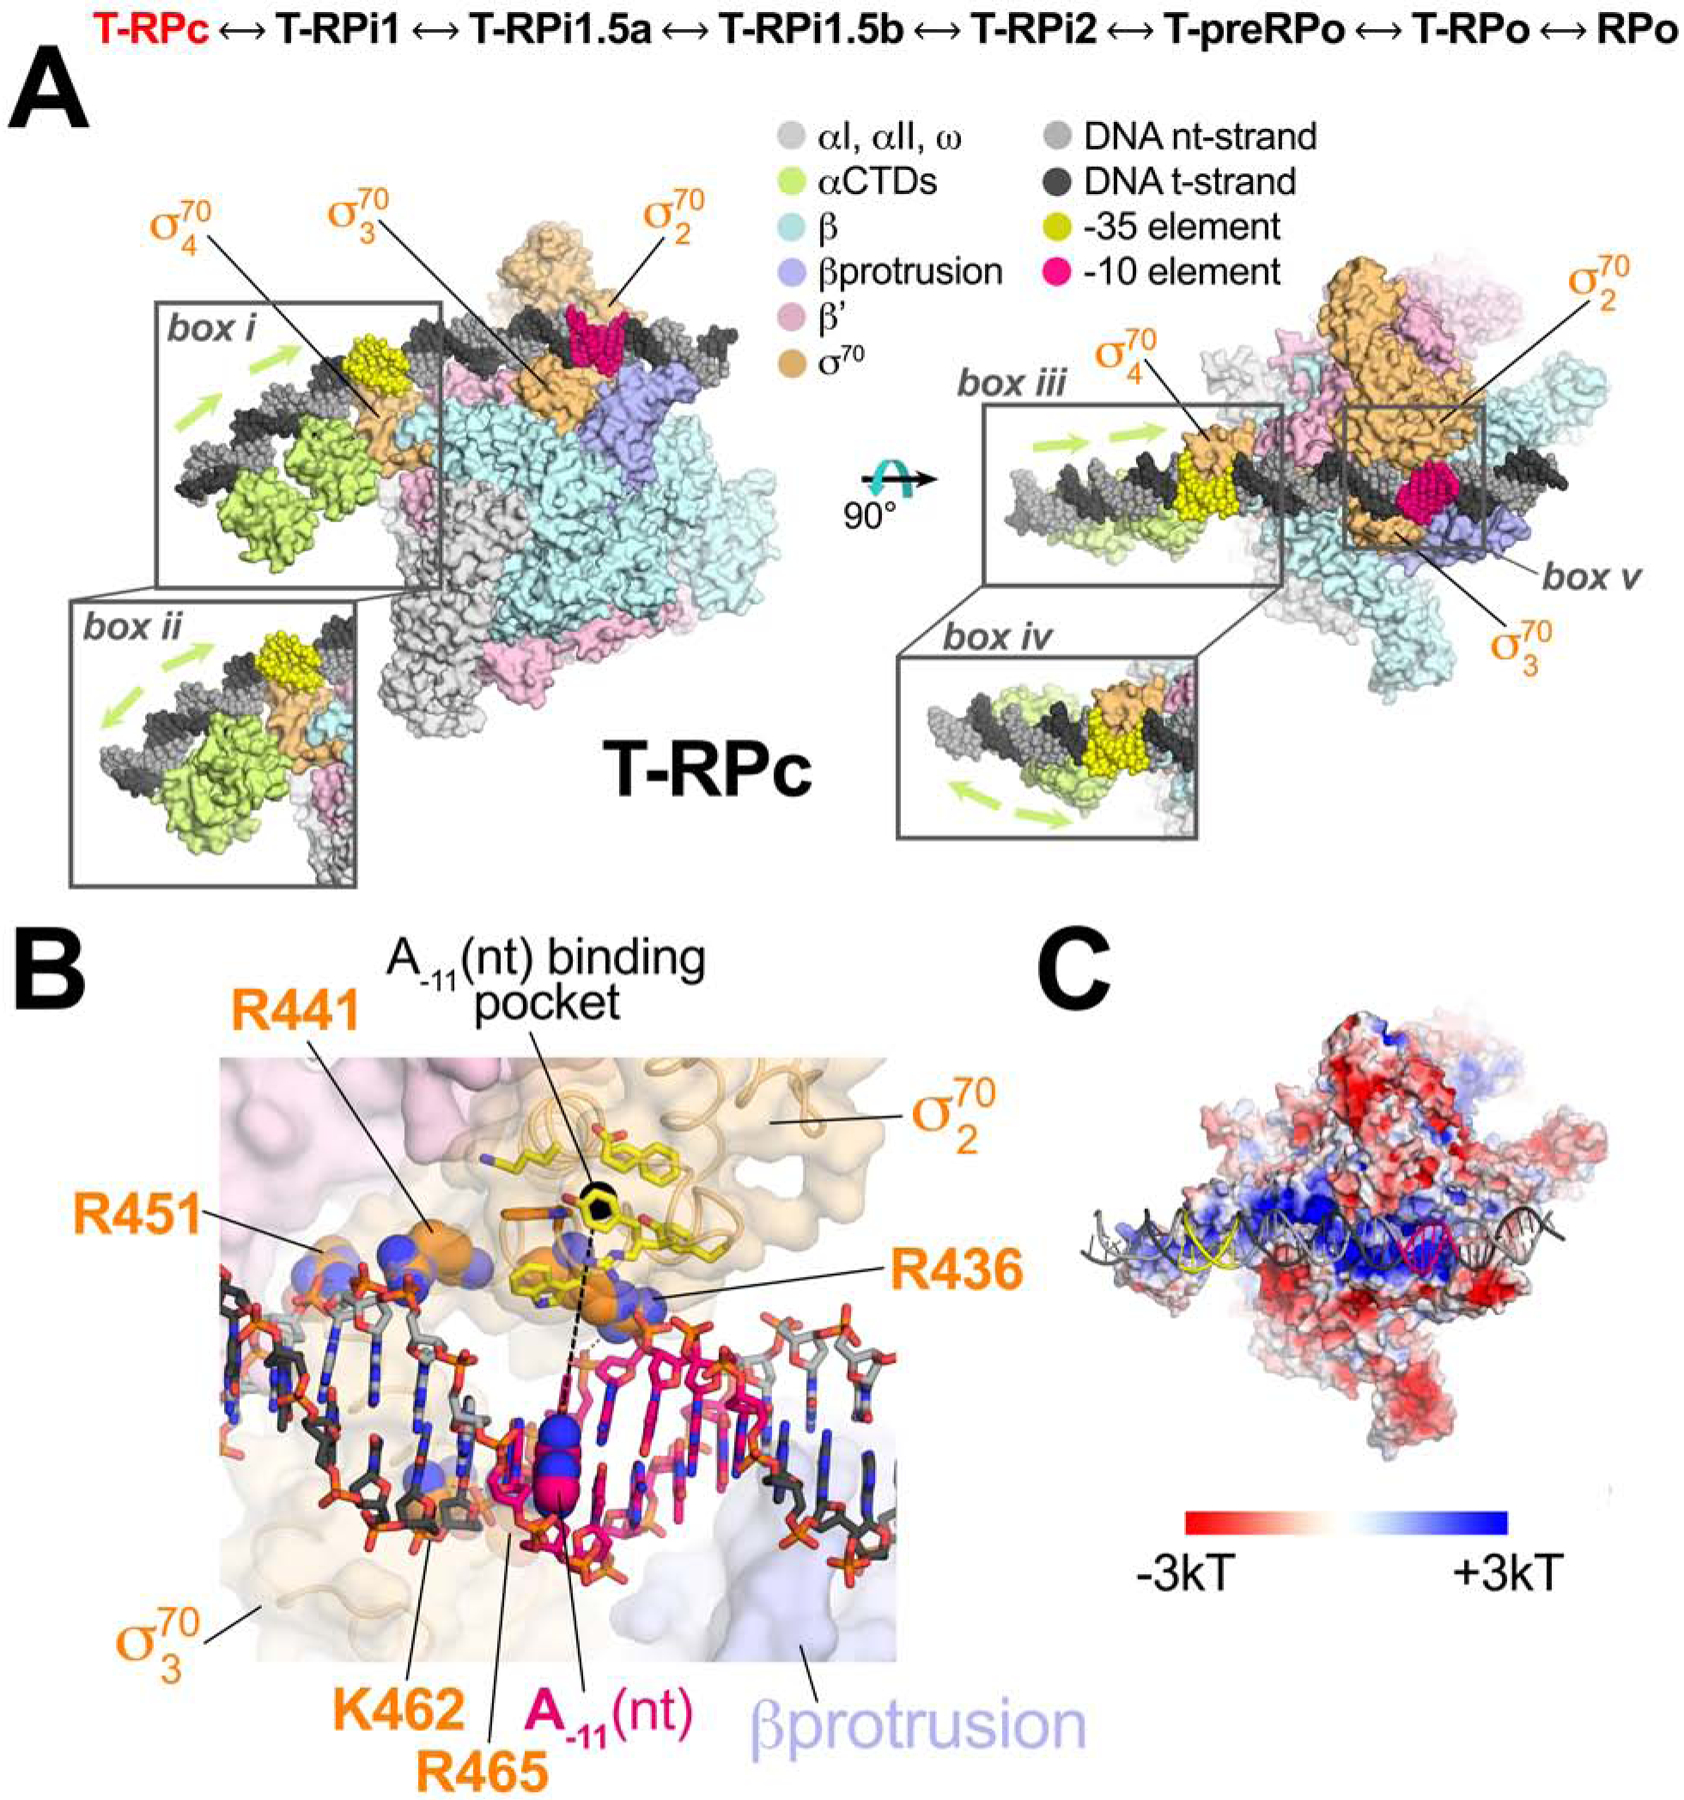
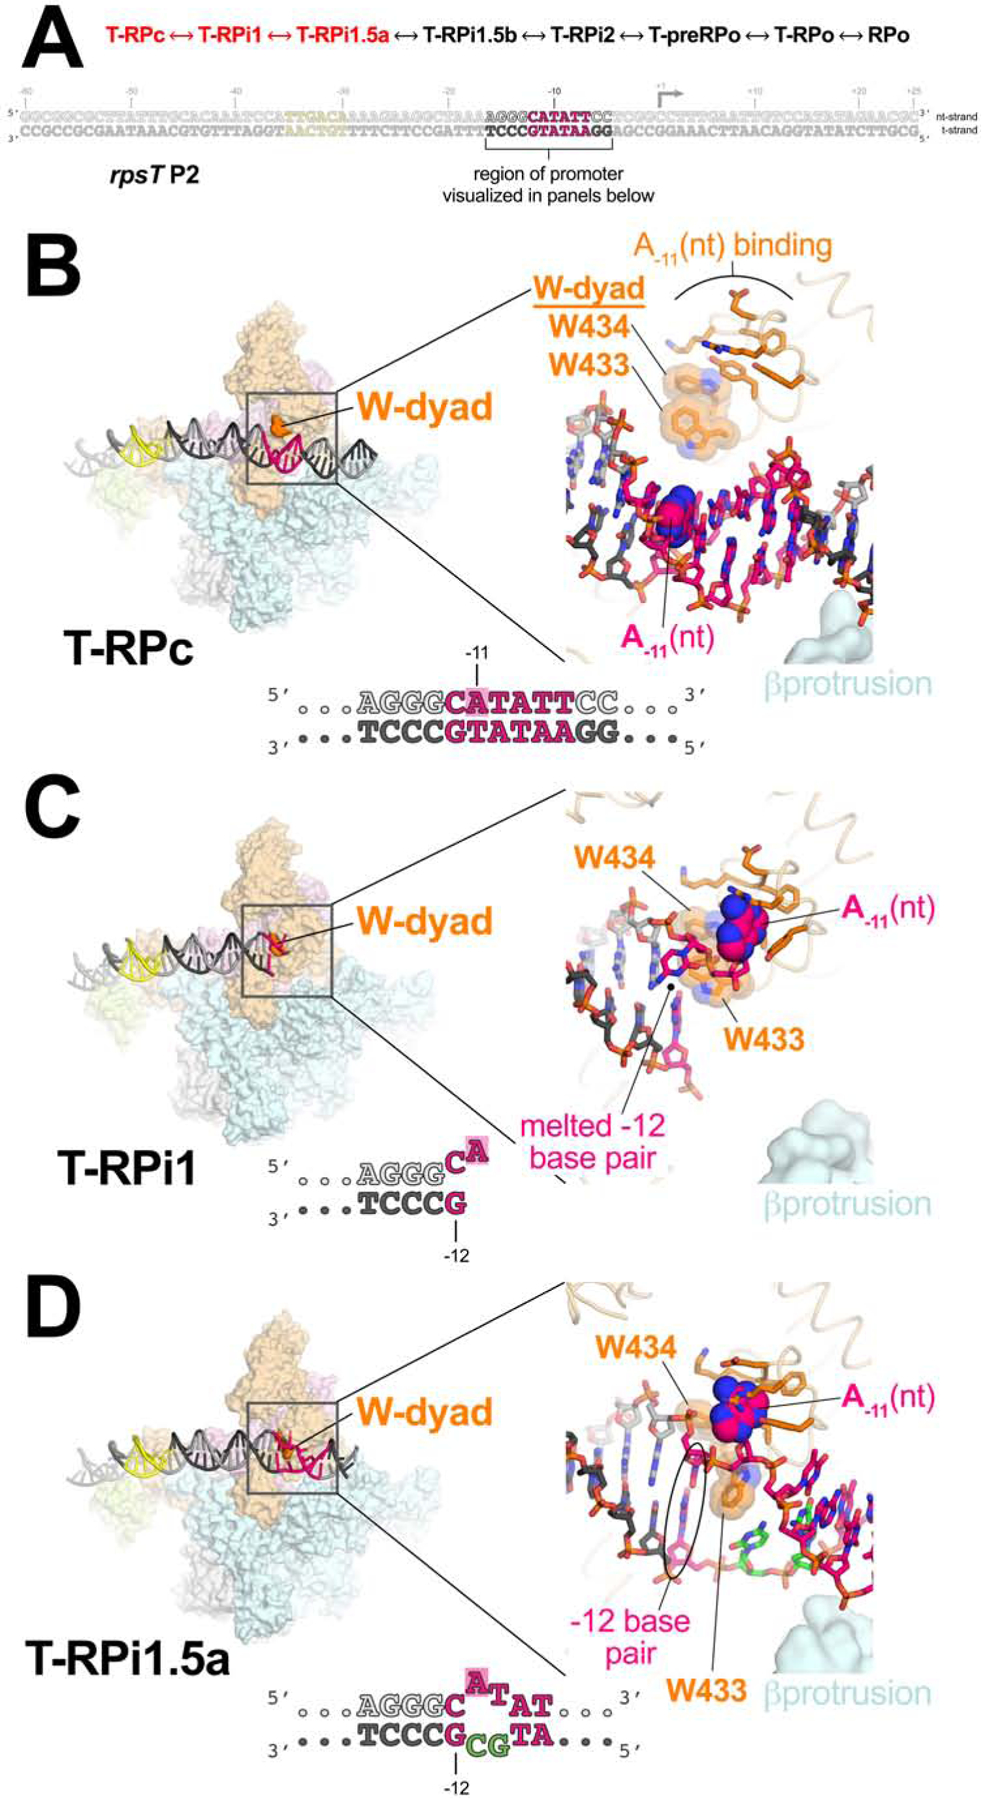
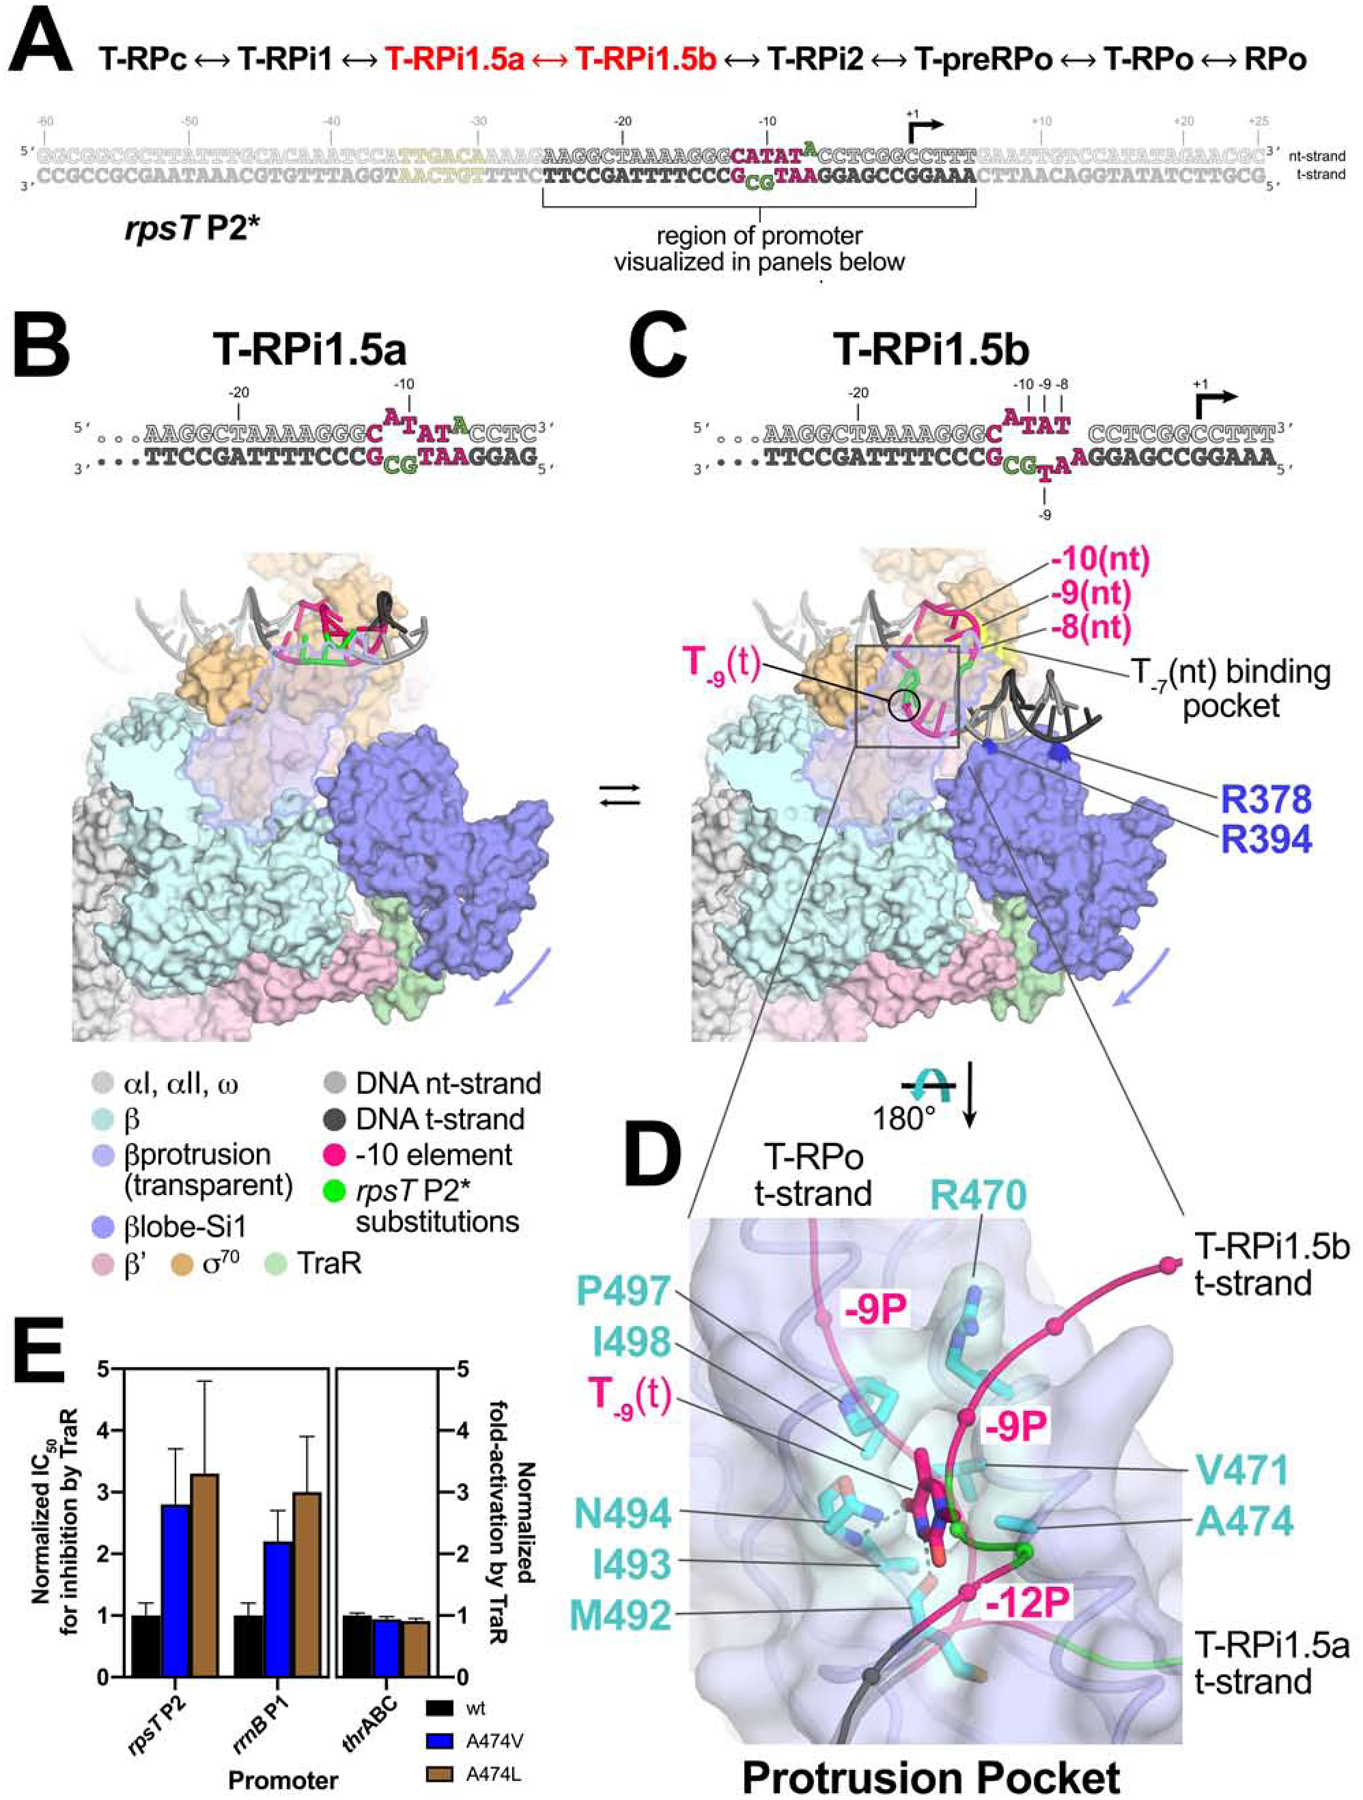
Transcription initiation requires formation of the open promoter complex (RPo). To generate RPo, RNA polymerase (RNAP) unwinds the DNA duplex to form the transcription bubble and loads the DNA into the RNAP active site. RPo formation is a multi-step process with transient intermediates of unknown structure. We use single-particle cryoelectron microscopy to visualize seven intermediates containing Escherichia coli RNAP with the transcription factor TraR en route to forming RPo. The structures span the RPo formation pathway from initial recognition of the duplex promoter in a closed complex to the final RPo. The structures and supporting biochemical data define RNAP and promoter DNA conformational changes that delineate steps on the pathway, including previously undetected transient promoter-RNAP interactions that contribute to populating the intermediates but do not occur in RPo. Our work provides a structural basis for understanding RPo formation and its regulation, a major checkpoint in gene expression throughout evolution.

Keywords: Conformational change; Cryoelectron microscopy; DNA; Open promoter complex formation; Promoter DNA; RNA polymerase; TraR; Transcription initiation.


Conflict of interest statement

Declaration of Interests The authors declare no competing interests.

Figures

Figure 1 |
Figure 1 |. Eco TraR-Eσ70 forms stable, partially melted complexes with an rpsT P2 promoter fragment.
A. The wt-rpsT P2 promoter fragment (−60 to +25) used for nMS and cryo-EM. B. nMS spectra and the corresponding deconvolved spectra for TraR-Eσ70 complexes with the rpsT P2 promoter fragment (A). TraR binds to Eσ70 in a 1:1 stoichiometry, forming a 471 kDa complex. Upon incubation of this complex with the promoter DNA (52 kDa), a predominant charge state series for the TraR-Eσ70-promoter assembly (524 kDa) was observed. C. Detection of unpaired thymines by KMnO4 footprinting of Eσ70 complexes formed with the wt-rpsT P2 or T−7A promoters ± TraR, and DNase I footprint protection ranges, shown by red or blue lines above each lane (dahsed lines: partial protection). Strand cleavage of modified thymines at 23°C (lanes 2–7) or 37° (lanes 10–15) was detected by gel electrophoresis of DNA fragments 32P end labeled in the nt-strand. Lanes 1, 9: A+G sequence ladder. Modified thymines at −10, −8 and −4 are indicated in red above and below gel, and on the section of the wt-rpsT P2 sequence shown below the gel (−10 element shaded in pink). Black arrow: transcription start site [see Figures S1A, B for DNase I footprints at 23°C; for 37°C footprints, se e (Gopalkrishnan et al., 2017)]. See also Figure S1.
Figure 2
Figure 2. Eco70 promoter melting intermediates on the rpsT P2 promoter.
A. Overall structures of promoter melting intermediates obtained by cryo-EM. Proteins are shown as transparent surfaces (αI, αII, ω, light gray; αCTD, pale limon; β, pale cyan; β’, light pink; σ70, light orange; TraR, pale green). The Eσ70 active site Mg2+ is shown as a sand-colored sphere. The promoter DNA is shown as cryo-EM difference density (nt-strand, gray; t-strand, dark gray; −35 element, yellow; −10 element, hot pink). The eight structures were derived from three samples: Sample 1) T-RPc, T-RPi1, T-RPi2, T-preRPo, and T-RPo structures were obtained with TraR and the wt-rpsT P2 fragment (Figure 1A); Sample 2) T-RPi1.5a and T-RPi1.5b were obtained with TraR and rpsT P2* (boxed in green; nucleotide substitutions in rpsT P2* are colored green); Sample 3) RPo was determined previously with wt-rpsT P2 without TraR (Chen et al., 2019b). In the Early complexes (boxed in orange), σ701.1 occupies the Eσ70 channel. In the Late complexes (boxed in gray), downstream duplex DNA occupies the channel. B. Structural properties used to order the complexes in the RPo formation pathway. (top panel) Plotted in orange (left scale) is the σ70/DNA interface area (Å2)(Krissinel and Henrick, 2007). Plotted in black (right scale) is the most downstream protein/duplex DNA contact. For T-RPi1, T-RPi1.5a, and T-RPi2, most or all of the downstream duplex DNA was disordered so no point is included. (bottom panel) Plotted in black (left scale) is the extent of the transcription bubble. For T-RPi1 and T-RPi2, the downstream fork of the transcription bubble was disordered so no point is included. Plotted in magenta (right scale) is the root-mean-square deviation of α-carbons (Å) for each complex superimposed with RPo. See also Figures S2 – S5 and Table S1.
Figure 3.
Figure 3.. Structure of the TraR-Eσ70 closed promoter complex (T-RPc).
(top) The structures determined here are ordered through the RPo formation pathway (see Figure 2). T-RPc, highlighted in red, is the focus of this figure. A., B. Color-coding is shown in the key. A. Orthogonal views of T-RPc. Proteins are shown as molecular surfaces, DNA is shown as Corey-Pauling-Koltun (CPK) spheres. The proximal (adjacent to σ704) and distal (further upstream) αCTDs were visualized in two co-existing dispositions on the DNA upstream of the −35 element, head-to-tail (box i and iii) and head-to-head (box iiand iv). The region around the duplex −10 element (box v) is magnified in (B). B. Magnified view of Eσ70 interactions with the duplex −10 element showing the absence of sequence-specific interactions (Feklistov and Darst, 2011). The DNA is shown as sticks with the A−11(nt) base highlighted in CPK spheres, and the location of the cognate binding pocket in σ702 (yellow side chains) occupied by A−11(nt) in subsequent intermediates indicated by a dashed black line connecting A−11(nt) to the pocket. RNAP is shown as a transparent molecular surface. The side chains shown as CPK spheres (σ702 R436, R441, R451; σ703 K462, R465), absolutely conserved among primary σ’s (Gruber and Bryant, 1997), interact with the duplex DNA phosphate backbone. C. The electrostatic charge distribution (Baker et al., 2001) is shown on the molecular surface of the T-RPc RNAP (same view as the right view of A). The DNA is shown in cartoon format. See also Figure S6.
Figure 4.
Figure 4.. T-RPc ↔ T-RPi1 ↔ T-RPi1.5a; transcription bubble nucleation.
A. (top) The order of structures through the RPo formation pathway (see Figure 2). The progression from T-RPc ↔ T-RPi1 ↔ T-RPi1.5a, highlighted in red, is the focus of this figure. (bottom) The sequence of the duplex rpsT P2 promoter fragment is shown, with the region of the promoter visualized in the panels below highlighted. B – D. (left) Overall view of T-RPc (B), T-RPi1 (C), and T-RPi1.5a (D). Eσ70 is shown as a molecular surface with promoter DNA in cartoon format (color-coded as in Figure 2A). The σ70 W-dyad is colored dark orange. The boxed region is magnified on the right. (right) Magnified view of promoter −10 element and W-dyad. Promoter DNA is shown in stick format with the A−11(nt) base highlighted with CPK spheres. Σ70 is shown as a backbone worm (pale orange) but with side chains of residues that interact with A−11(nt) in RPo shown (orange). The W-dyad is also shown, highlighted with transparent CPK spheres. B. T-RPc: The −10 element is completely duplex and the W-dyad is in the edge-on conformation. C. T-RPi1 and transcription bubble nucleation: A−11(nt) is flipped out of the duplex towards its cognate σ702 pocket, nucleating −10 element melting. Steric clash with the edge-on conformation of the W-dyad disrupts the −12 base pair. Downstream DNA lacks cryo-EM density and is presumed to be highly dynamic. D. T-RPi1.5a: The flipped out A−11(nt) more fully engages with its cognate σ702 pocket. We modeled the W-dyad in its ‘chair’ conformation (Bae et al., 2015), allowing the −12 bp to reform. The T-RPi1.5a structure was obtained with the mutant rpsT P2* promoter (base substitutions colored green). See also Figure S6 and Movie S1.
Figure 5.
Figure 5.. T-RPi1.5a ↔ T-RPi1.5b; transcription bubble propagation and the protrusion pocket.
A. (top) The order of structures through the RPo formation pathway (see Figure 2). The progression from T-RPi1.5a ↔ T-RPi1.5b, highlighted in red, is the focus of this figure. (bottom) The sequence of rpsT P2* is shown, with the region of the promoter visualized in the panels below highlighted. B., C. Overall view of T-RPi1.5a (B) and T-RPi1.5b (C). Eσ70 is shown as a molecular surface with promoter DNA in cartoon format (color-coded as in the key). The βprotrusion (light blue) is transparent with an outline. The rotation of the βlobe-Si1 domains (slate blue) induced by TraR is indicated by the slate blue arrow. B. T-RPi1.5a C. In T-RPi1.5b, DNA phosphate backbone contacts between nt-strand −10 to −8 and σ70 are established as in RPo. The −7(nt) base is positioned over its cognate pocket in σ70 (highlighted in yellow) but is not bound in the pocket due to the T−7A(nt) substitution of rpsT P2*. The T−9(t) base flips up and is bound in the protrusion-pocket on the underside of the βprotrusion. βlobe residues R378 and R394, two of many residues that interact with the DNA in T-RPi1.5b but not in RPo (Table S2), are highlighted (dark blue). D. The protrusion pocket, viewed from the underside of the βprotrusion. The βprotrusion is shown as a backbone worm with a transparent molecular surface. The T-RPi1.5b t-strand DNA is shown as a thin backbone worm with phosphate atom positions denoted by CPK spheres. The T−9(t) base, bound in the protrusion-pocket, is shown as sticks. The t-strand DNA backbone paths for T-RPi1.5a (precedes T-RPi1.5b in the RPo formation pathway) and T-RPo (follows T-RPi1.5b) are shown for comparison. Protrusion-pocket residues that interact with the T−9(t) base are shown as sticks and colored cyan. Thymine-specific hydrogen-bonds between RNAP and T−9(t) are denoted by dark gray dashed lines. E. Effect of βA474 substitutions on TraR-mediated inhibition of rpsT P2 and rrnB P1 promoters (left) or activation of thrABC (right). For rpsT P2 and rrnB P1, IC50 values for TraR inhibition of wt-RNAP (black bar), βA474V-RNAP (blue bar), and βA474L-RNAP (brown bar) are plotted relative to wt-RNAP (normalized to 1.0). For thrABC, fold-activation (relative to no TraR) at 500 nM TraR is plotted relative to wt-RNAP (normalized to 1.0). Averages with standard deviation from three independent experiments are shown. See also Figures S6, S7, Table S2 and Movie S2.
Figure 6.
Figure 6.. T-RPi1.5b ↔ T-RPi2 ↔ T-preRPo; transcription bubble completion and σ701.1 ejection.
(top) The order of structures through the RPo formation pathway (see Figure 2). The progression from T-RPi1.5b ↔ T-RPi2 ↔ T-preRPo, highlighted in red, is the focus of this figure. A. – C. Overall view of T-RPi1.5b (A), T-RPi2 (B), and T-preRPo (C). Eσ70 is shown as molecular surfaces, with core RNAP transparent, revealing the RNAP active site Mg2+ (sand colored sphere), TraR in the secondary channel, and either σ701.1 (T-RPi1.5b and T-RPi2) or downstream duplex DNA (T-preRPo) in the RNAP channel. The βprotrusion (light blue) and βlobe-Si1 (slate blue) are outlined. A. T-RPi1.5b: Downstream duplex DNA is accommodated in the gap between the βprotrusion and βlobe-Si1. The empty T−7(nt) pocket in σ702 is denoted. B. T-RPi2: The −10 element T−7(nt) is engaged in its cognate σ70 pocket, the transcription bubble advances in the downstream direction, and the single-stranded nt-strand downstream to −4 is positioned in the complex much like RPo. The downstream edge of the transcription bubble and downstream duplex DNA are disordered and σ701.1 occupies that RNAP channel. C. T-preRPo: The transcription bubble is fully formed (−11 to +2). The downstream duplex DNA is accommodated in the RNAP channel in place of the ejected σ701.1. See also Movies S3 and S4.

Similar articles

Cited by

References

    1. Abascal-Palacios G, Ramsay EP, Beuron F, Morris E, and Vannini A (2018). Structural basis of RNA polymerase III transcription initiation. Nature 553, 301–306. - PubMed
    1. Adams PD, Afonine PV, Bunkóczi G, Chen VB, Davis IW, Echols N, Headd JJ, Hung L-W, Kapral GJ, Grosse-Kunstleve RW, et al. (2010). PHENIX: a comprehensive Python-based system for macromolecular structure solution. Acta Crystallogr D Biol Crystallogr 66, 213–221. - PMC - PubMed
    1. Afonine PV, Klaholz BP, Moriarty NW, Poon BK, Sobolev OV, Terwilliger TC, Adams PD, and Urzhumtsev A (2018). New tools for the analysis and validation of cryo-EM maps and atomic models. Acta Crystallogr D Struct Biol 74, 814–840. - PMC - PubMed
    1. Bae B, Davis E, Brown D, Campbell EA, Wigneshweraraj SR, and Darst SA (2013). Phage T7 Gp2 inhibition of Escherichia coli RNA polymerase involves misappropriation of σ70 domain 1.1. Proc Natl Acad Sci USA 110, 19772–19777. - PMC - PubMed
    1. Bae B, Feklistov A, Lass-Napiorkowska A, Landick R, and Darst SA (2015). Structure of a bacterial RNA polymerase holoenzyme open promoter complex. Elife 4, e08504. - PMC - PubMed

Publication types

MeSH terms

Substances