. 2020 Mar 10;14(3):374-389.
doi: 10.1016/j.stemcr.2020.02.004.

MERTK-Dependent Ensheathment of Photoreceptor Outer Segments by Human Pluripotent Stem Cell-Derived Retinal Pigment Epithelium

Affiliations

MERTK-Dependent Ensheathment of Photoreceptor Outer Segments by Human Pluripotent Stem Cell-Derived Retinal Pigment Epithelium

Seba Almedawar et al. Stem Cell Reports. .

Abstract

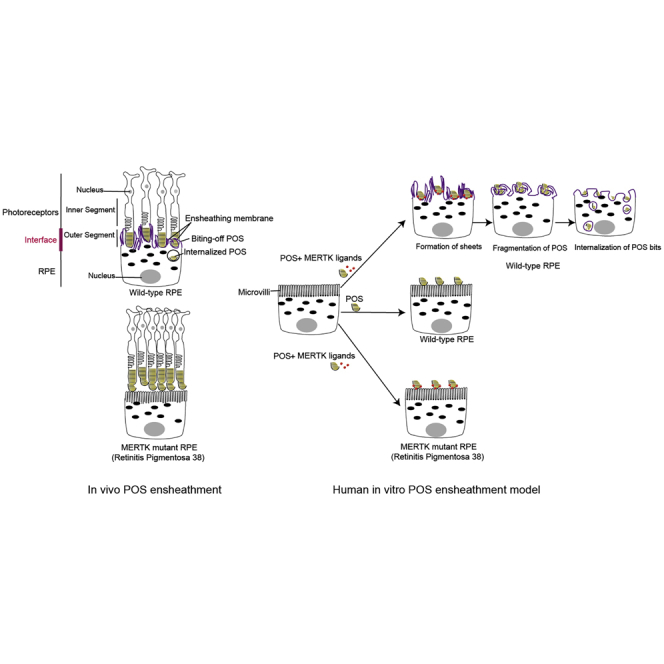
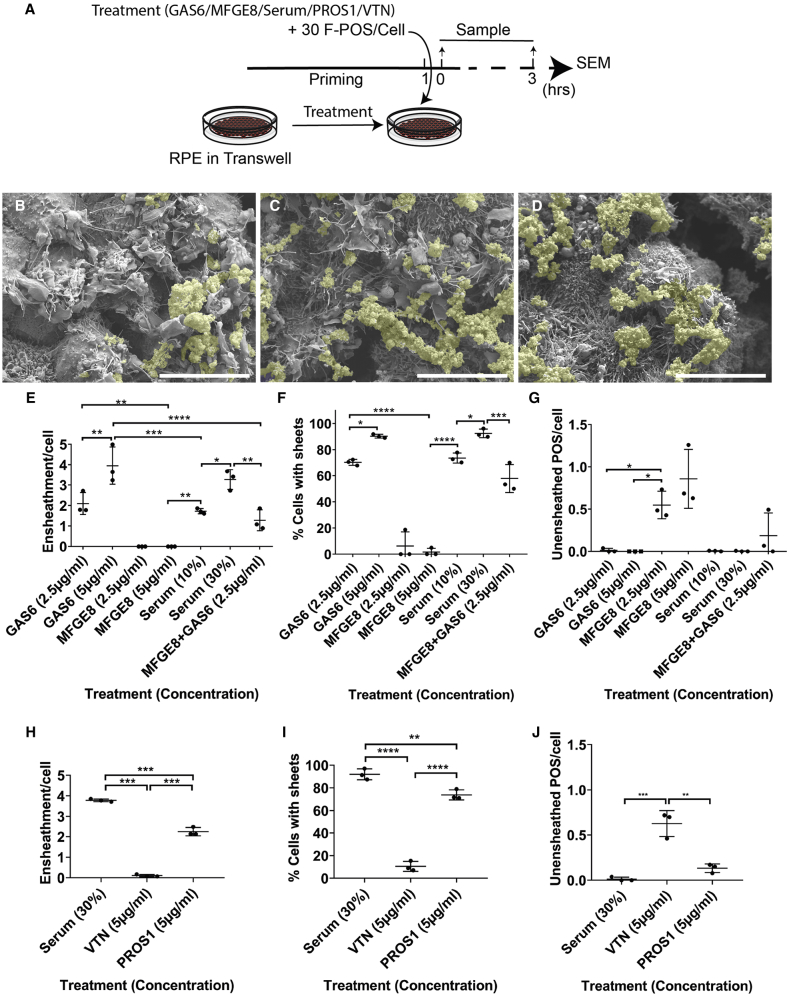
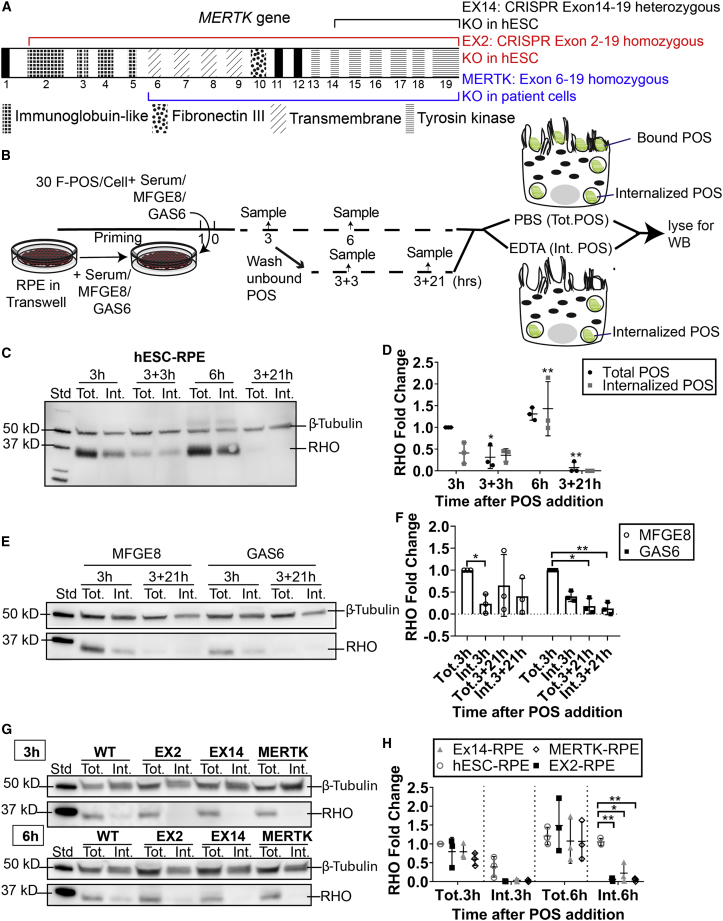
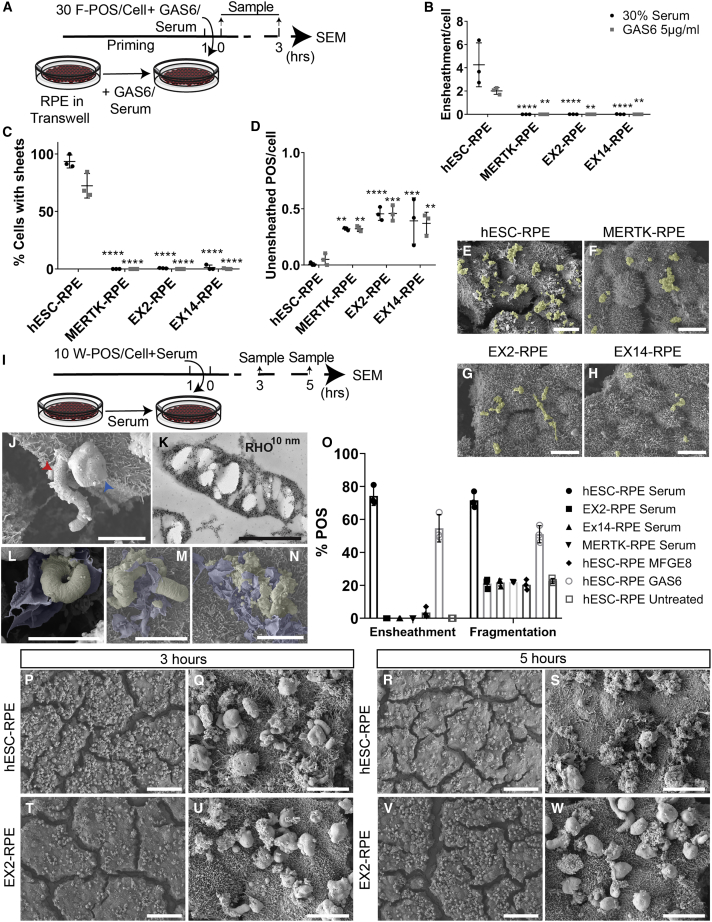
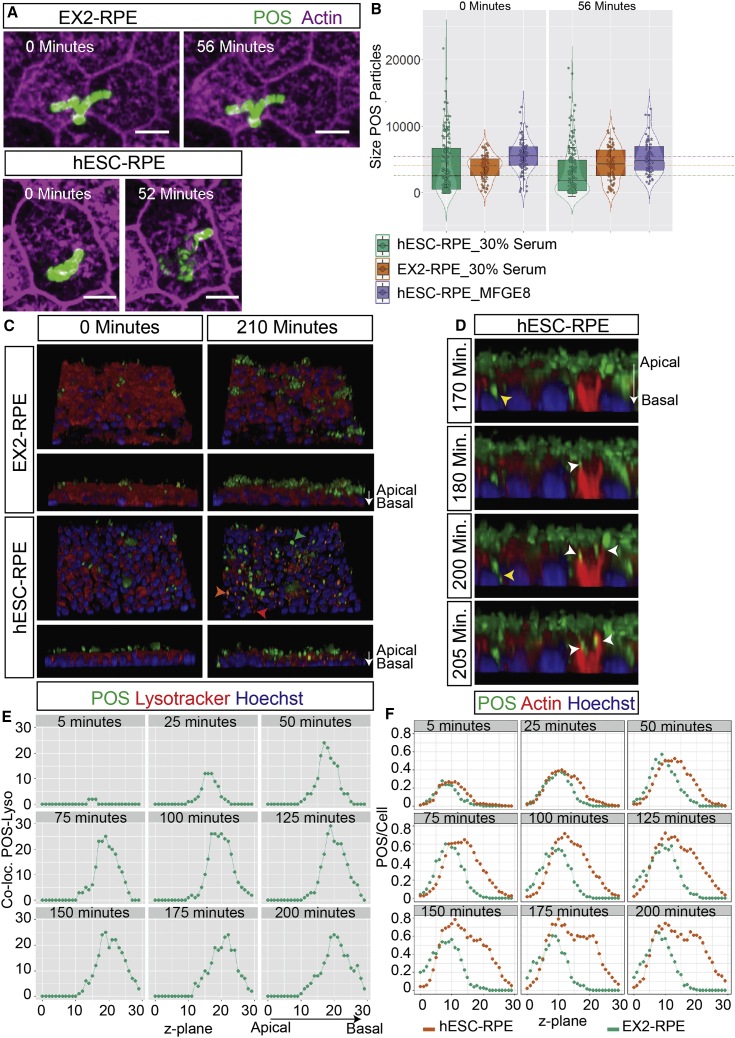
Maintenance of a healthy photoreceptor-retinal pigment epithelium (RPE) interface is essential for vision. At the center of this interface, apical membrane protrusions stemming from the RPE ensheath photoreceptor outer segments (POS), and are possibly involved in the recycling of POS through phagocytosis. The molecules that regulate POS ensheathment and its relationship to phagocytosis remain to be deciphered. By means of ultrastructural analysis, we revealed that Mer receptor tyrosine kinase (MERTK) ligands, GAS6 and PROS1, rather than αVβ5 integrin receptor ligands, triggered POS ensheathment by human embryonic stem cell (hESC)-derived RPE. Furthermore, we found that ensheathment is required for POS fragmentation before internalization. Consistently, POS ensheathment, fragmentation, and internalization were abolished in MERTK mutant RPE, and rescue of MERTK expression in retinitis pigmentosa (RP38) patient RPE counteracted these defects. Our results suggest that loss of ensheathment due to MERTK dysfunction might contribute to vision impairment in RP38 patients.

Keywords: GAS6; MERTK; MFGE8; PROS1; ensheathment; human embryonic stem cells; human pluripotent stem cells; phagocytosis; photoreceptor outer segments; retinal pigment epithelium.


Figures

None
Graphical abstract
Figure 1
Figure 1
RPE Derived from Pluripotent Stem Cell Lines Display Mature RPE Characteristics (A) RPE derived from wild-type and MERTK mutant hPSC grown in Transwells. (B) HPSC-derived RPE are pigmented and express mature RPE markers, including MITF, EZRIN, bestrophin 1 (BEST1), and ZO1. MERTK is expressed in hESC-RPE, but not in EX2 and MERTK-RPE. It is weakly expressed in EX14-RPE. Scale bar, 10 μm. (C) Cross-sections of immunofluorescence images of RPE markers in hESC-RPE and MERTK-RPE. Note the polarized expression of ZO1, EZRIN, and MERTK on the apical surface of the RPE. Scale bar, 10 μm. (D) Heatmap of the mean of log2 values of reads per kilobase of transcript per million mapped reads of selected pluripotency genes and mature RPE markers. N = 3 biological repeats. Presented data are derived from RNA-seq analysis performed on hESCs and hESC-RPE. Please refer to Excel Table S1 for raw data. The accession number for the RNAseq data reported here is GEO: GSE127352. (E) Immunoblot (western blot) analysis of MERTK using total protein extracts from wild-type and MERTK mutant RPE. (F) Analysis of three MERTK immunoblots using ImageJ showed a decrease in MERTK expression in EX14-RPE, and no MERTK expression in EX2-RPE and MERTK-RPE. Data are represented as means ± SD. N = 3 biological repeats.
Figure 2
Figure 2
HESC-Derived RPE Recapitulate Dynamic POS Ensheathment In Vitro (A–D) SEM of hESC-RPE without POS. Scale bars, 50 μm (A), 10 μm (B), 1 μm (C), and 10 μm (D). (E) A schematic of the experiment. HESC-RPE cells were primed with 30% serum for 1 h before addition of F-POS or left untreated. After seeding F-POS, cells were incubated for 1, 2, or 3 h. After 3 h unbound POS were washed off with medium containing serum and cells were fixed at 4, 5, or 6 h. Samples without serum were incubated for 3 and 24 h before they were fixed and processed for SEM. (F–H) SEM images of hESC-RPE with F-POS. F-POS are artificially colored yellow. Scale bar, 5 μm (F). Cells that were treated with POS and serum for 1 h show smaller and fewer sheets. Yellow arrow points to small sheets with POS. (G) Cells that were treated with POS and serum for 3 h show larger and numerous sheets. Red arrow points to the big sheets surrounding POS. See also Figures S1 and S2. (H) Cells that were treated with POS without serum for 3 h did not form sheets. (I–K) Ten images containing around ten cells from each condition were analyzed. (I) The presence of serum and POS increases the number of total sheets per cell, and the number of sheets associated with POS. In the absence of serum very few sheets are observed. The number of sheets/cell is highest at 3 h after POS addition (pulse) and significantly decreases 3 h after POS pulse. Significance was calculated using two-way ANOVA comparing all samples to 3 h. (J) The percentage of cells that extend sheets in response to POS and serum increases significantly at 3 h and decreases again after 6 h. In contrast, cells that received POS without serum do not show ensheathment either at 3 h or at 24 h. (K) In the absence of serum most of the bound POS are unensheathed. Statistical significance for (J and K) was calculated using one-way ANOVA comparing all samples to 3 h. Data are represented as means ± SD. N = 3 biological repeats. ns > 0.05, p < 0.05, ∗∗p < 0.01, ∗∗∗p < 0.001, ∗∗∗∗p < 0.0001. (L–N) Examples for quantifying F-POS, sheets, and cells within a field of view. (L) Manual segmentation of F-POS. Six POS fragments were counted. Scale bar, 5 μm. (M) Manual segmentation of sheets. Twelve sheets were counted. Scale bar, 5 μm. (N) Manual quantification of the cells. Fourteen cells were counted. Scale bar, 10 μm.
Figure 3
Figure 3
Ensheathment by Human RPE Is Specific for POS (A) A schematic of the experiment. HESC-RPE cells were primed with 30% serum for 1 h before addition of F-POS or latex beads. Control cells were either left untreated or treated with beads without serum. Cells were incubated for 3 h at 37°C. All samples were washed after 3 h. Some samples were fixed and others were kept for 3 h or more to allow internalization of beads. Samples were analyzed with SEM or TEM. (B) SEM image of RPE cells treated with beads (artificially colored yellow) for 3 h. Scale bar, 1 μm. (C) TEM image at 6 h. Beads (dashed purple line) were observed inside the cells and close to the nuclei. (D) TEM image at 3 h. Beads were observed either at the surface of the cell (dashed orange line), or getting internalized by the RPE (dashed purple line). In both SEM and TEM analyses, no sheets were observed around the beads.
Figure 4
Figure 4
MERTK Ligands Rather Than αVβ5 Integrin Ligands Stimulate POS Ensheathment by Human RPE (A) A schematic of the experiment. (B–D) SEM image of cells treated with F-POS and 30% serum (B), 5 μg/mL GAS6 (C), or 5 μg/mL MFGE8 (D). Scale bar, 1 μm. (E–J) Ten images containing around ten cells from each condition were analyzed. Data are represented as means ± SD. N = 3 biological repeats. (E–J) Quantification of the number of sheets associated with POS per cell, the percentage of cells presenting sheets, and the number of unensheathed POS per cell in the different conditions. Significance was calculated using one-way ANOVA test. ns > 0.05, p < 0.05, ∗∗ p< 0.01, ∗∗∗p < 0.001, ∗∗∗∗p < 0.0001. Data are represented as means ± SD. N = 3 biological repeats. Related to Figure S3.
Figure 5
Figure 5
Mutations in the MERTK Gene Lead to Defects in POS Phagocytosis (A) An illustration of the MERTK gene showing the different exons coding for the different protein domains of the receptor. Exons are labeled 1 to 19. The mutations in the three stem cell lines used in this study are also represented in the illustration: the iPSC cell line derived from an RP38 patient has a homozygous deletion spanning exon 6 to 19 (blue). CRISPR/Cas9-mediated partial deletion of exon 14 to 19 in hESCs is shown in black. CRISPR/Cas9-mediated deletion of exon 2 to 19 in hESCs is shown in red. See also Figures S4–S7 for MERTK mutations details, patient clinical observations, stem cell characterization, and rescue in isogenic iPSC-RPE control. (B) A schematic of the three experiments in (C–H). All samples were treated with either PBS or EDTA before lysis to detect total versus internalized F-POS, respectively. Blots were probed for β-tubulin as a loading control, and RHO to indicate total POS (Tot.) and internalized POS (Int.). RHO signal was normalized to tubulin and then to the total POS signal in control condition to monitor the fold change in RHO signal. Data are represented as means ± SD. N = 3 biological repeats. Significance was calculated using two-way ANOVA test. ns > 0.05, p < 0.05, ∗∗p < 0.01, ∗∗∗p < 0.001, ∗∗∗∗p < 0.0001. (C) HESC-RPE were primed for 1 h with 30% serum. Next, cells were challenged with F-POS and incubated for 3 or 6 h at 37°C. Samples were lysed 3 or 6 h after POS addition. Other samples were washed at 3 h and kept for 3 h (3 + 3 h) or 21 h (3 + 21 h) before lysis to monitor POS degradation. (D) Quantification of the immunoblot in (C). Total POS 3 h was used as control condition for normalization and statistical significance calculation. (E) HESC-RPE were primed for 1 h with either GAS6 or MFGE8. Next, cells were challenged with POS and incubated for 3 h and either lysed or washed and kept for a further 21 h (3 + 21 h) before lysis to monitor POS degradation. (F) Quantification of the immunoblot in (E). Total POS 3 h in each condition was used as control for normalization and statistical significance calculation. HESC-RPE bind, internalize, and degrade POS efficiently in the presence of GAS6 and serum. In contrast, in the presence of MFGE8 POS degradation is slowed down. See Figure S3 for fluorescence-based POS phagocytosis data. (G) Wild-type and MERTK mutant RPE were primed for 1 h with 30% serum. Next, cells were challenged with POS and incubated for 3 or 6 h at 37°C before processing. (H) Quantification of the immunoblot in (G). Total POS 3 h in hESC-RPE was used as control condition for normalization. For significance calculation all samples were compared with each other. MERTK mutant RPE show POS internalization defect.
Figure 6
Figure 6
MERTK Mutations in Human RPE Abolish POS Ensheathment (A) A schematic of the experiment in (B–H). (B–D) Ten images containing around ten cells from each condition were analyzed. Significance was calculated using one-way ANOVA test. ns > 0.05, p < 0.05, ∗∗p < 0.01, ∗∗∗p < 0.001, ∗∗∗∗p < 0.0001. Data are represented as means ± SD. N = 3 biological repeats. In Figure S7 ensheathment rescue in isogenic control is shown. (B) Quantification of the number of sheets associated with POS per cell. (C) Quantification of the percentage of cells presenting sheets. (D) Quantification of the number of unensheathed F-POS per cell. (E–H) SEM images of wild-type and MERTK mutant RPE treated with F-POS and 30% serum. Scale bar, 10 μm. (E) Wild-type hESC-RPE. (F) MERTK mutant MERTK-RPE. (G) MERTK mutant EX2-RPE. (H) MERTK mutant EX14-RPE. (I) A schematic of the experiment in (J–W). Wild-type and MERTK mutant RPE (grown on transwells) were primed 1 h with 30% serum. Alternatively, wild-type RPE cells were primed with 5 μg/mL GAS6 or MFGE8 for 1 h. Next, cells were challenged with W-POS and incubated for 3 and 5 h at 37°C. Samples were next processed for SEM. (J) Two types of W-POS particles were observed by SEM elongated (red arrow) and round-oval (blue arrow) outer segments. Scale bar, 5 μm. (K) Whole POS particles are RHO rich. Scale bar, 3 μm. (L–N) SEM images. Stages of POS binding, ensheathment, and ensheathment-mediated fragmentation. Scale bar, 5 μm. (L) Upon contact between hESC-RPE and W-POS in the presence of 30% serum, RPE extends its membrane sheets around the particle. (M) Next, RPE sheets invade POS and fragment them. (N) POS are completely fragmented before they are internalized. (O) Analysis of W-POS ensheathment in SEM images at 3 h and fragmentation by 5 h in the presence of 30% serum. Data are represented as means ± SD. N = 3 biological repeats. (P–W) Representative SEM images of the analysis shown in (O). Scale bars, 50 μm (P, R, T, and V). Zoomed-in SEM images of (Q), (S), (U), and (W). Scale bar, 10 μm. W-POS were ensheathed at 3 h (P and Q) and fragmented after 5 h by hESC-RPE treated with 30% serum (R and S), while EX2-RPE showed neither POS ensheathment at 3 h (T and U), nor ensheathment-mediated fragmentation at 5 h (V and W).
Figure 7
Figure 7
Quantitative Live Imaging Analysis Shows that MERTK Mutant Human RPE Fail to Fragment and Internalize POS (A) Snapshots from time-lapse live fluorescence imaging performed with LSM 880 upright microscope using the Airyscan feature and a 40× dipping objective. The complete time-lapse videos can be found in Videos S1a and S1b. HESC-RPE and EX2-RPE (grown on transwells) were primed with 30% serum or 5 μg/mL MFGE8 for 1 h, and were challenged with AF488-labeled W-POS for 2.5 h at 37°C with 5% CO2 before imaging. Membranes, containing the RPE monolayer, were cut out from the Transwell insert and placed with the apical side of the cells facing the dipping objective in a 35-mm cell culture dish with 2 mL medium containing SiR-actin dye and 30% serum. (A) Many of the whole POS particles that were still seen at the start of imaging (0 min) in hESC-RPE got fragmented within around 52 min. In contrast, whole POS particles in EX2-RPE did not get fragmented within the same or longer time frame (56 min). Scale bar, 10 μm. (B) Box-violin plot of the live imaging performed in (A) shows distribution of the POS particle size under different conditions at the start of the imaging (0 min) and at the end (56 min). (C and D) Snapshots from time-lapse live fluorescence imaging performed with an inverted Leica confocal microscope (SP5-mp) on hESC-RPE and EX2-RPE plated in 96-well plates, and treated with 30% serum and SiR-actin (D) or LysoTracker (C), to monitor POS internalization or co-localization with lysosomes, respectively. The complete time lapse can be found in Video S2 (EX2-RPE) and Video S3 (hESC-RPE). Following priming with 30% serum W-POS were added to the cells and imaging started 25 min thereafter without a washing step in between. (C) In hESC-RPE, W-POS (green arrow) were fragmented into smaller pieces and co-localized with lysosomes (orange arrow). In contrast, W-POS remained intact in EX2-RPE and did not co-localize with lysosomes. (D) Actin labeling showed many internalized POS fragments in hESC-RPE (yellow arrow). Some POS fragments were captured during the process of internalization, which takes around 30 min (white arrow). (E) Quantification of the number of POS that co-localize with lysosomes at different time points during the time lapse and in different z-planes, where (0) refers to the apical surface of the RPE and (30) refers to the basal. The number of co-localized POS increased with time and shifted toward the basal side of the RPE. (F) The number of POS/cell in hESC-RPE over the different z-planes and time points during the time lapse showed a shift in the peak of POS/cell count toward basal z planes with time, reflecting internalization. This shift was not detected in EX2-RPE.

References

    1. Besharse J.C., Hollyfield J.G., Rayborn M.E. Photoreceptor outer segments: accelerated membrane renewal in rods after exposure to light. Science. 1977;196:536–538. - PubMed
    1. Bok D., Hall M.O. The role of the pigment epithelium in the etiology of inherited retinal dystrophy in the rat. J. Cell Biol. 1971;49:664–682. - PMC - PubMed
    1. Bulloj A., Duan W., Finnemann S.C. PI 3-kinase independent role for AKT in F-actin regulation during outer segment phagocytosis by RPE cells. Exp. Eye Res. 2013;113:9–18. - PMC - PubMed
    1. Carr A.-J., Vugler A., Lawrence J., Chen L.L., Ahmado A., Chen F.K., Semo M., Gias C., da Cruz L., Moore H.D. Molecular characterization and functional analysis of phagocytosis by human embryonic stem cell-derived RPE cells using a novel human retinal assay. Mol. Vis. 2009;15:283–295. - PMC - PubMed
    1. Duncan J.L., LaVail M.M., Yasumura D., Matthes M.T., Yang H., Trautmann N., Chappelow A.V., Feng W., Earp H.S., Matsushima G.K. An RCS-like retinal dystrophy phenotype in mer knockout mice. Invest. Ophthalmol. Vis. Sci. 2002;44:826–838. - PubMed

Publication types

MeSH terms