. 2020 Mar 17;52(3):557-570.e6.
doi: 10.1016/j.immuni.2020.02.001. Epub 2020 Mar 10.

Immune Profiling of Human Gut-Associated Lymphoid Tissue Identifies a Role for Isolated Lymphoid Follicles in Priming of Region-Specific Immunity

Affiliations

Immune Profiling of Human Gut-Associated Lymphoid Tissue Identifies a Role for Isolated Lymphoid Follicles in Priming of Region-Specific Immunity

Thomas M Fenton et al. Immunity. .

Abstract

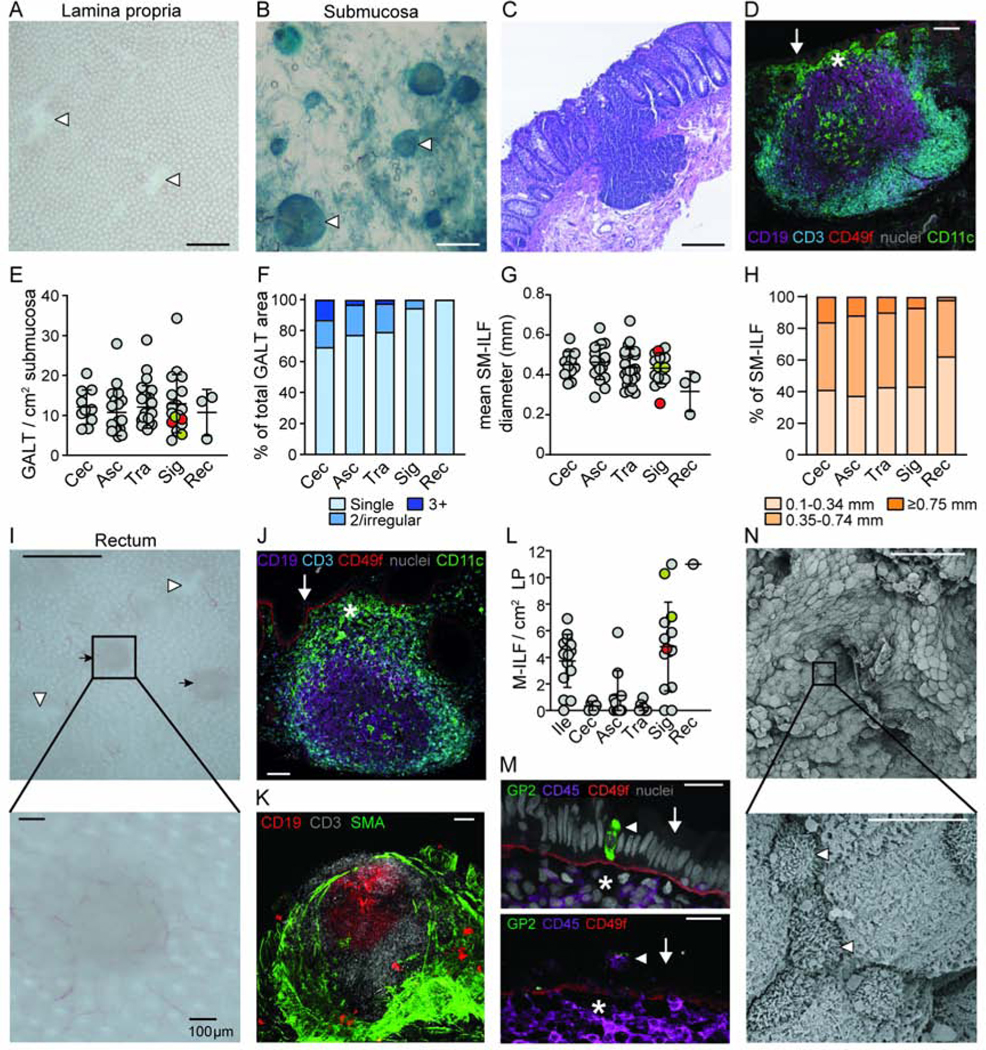
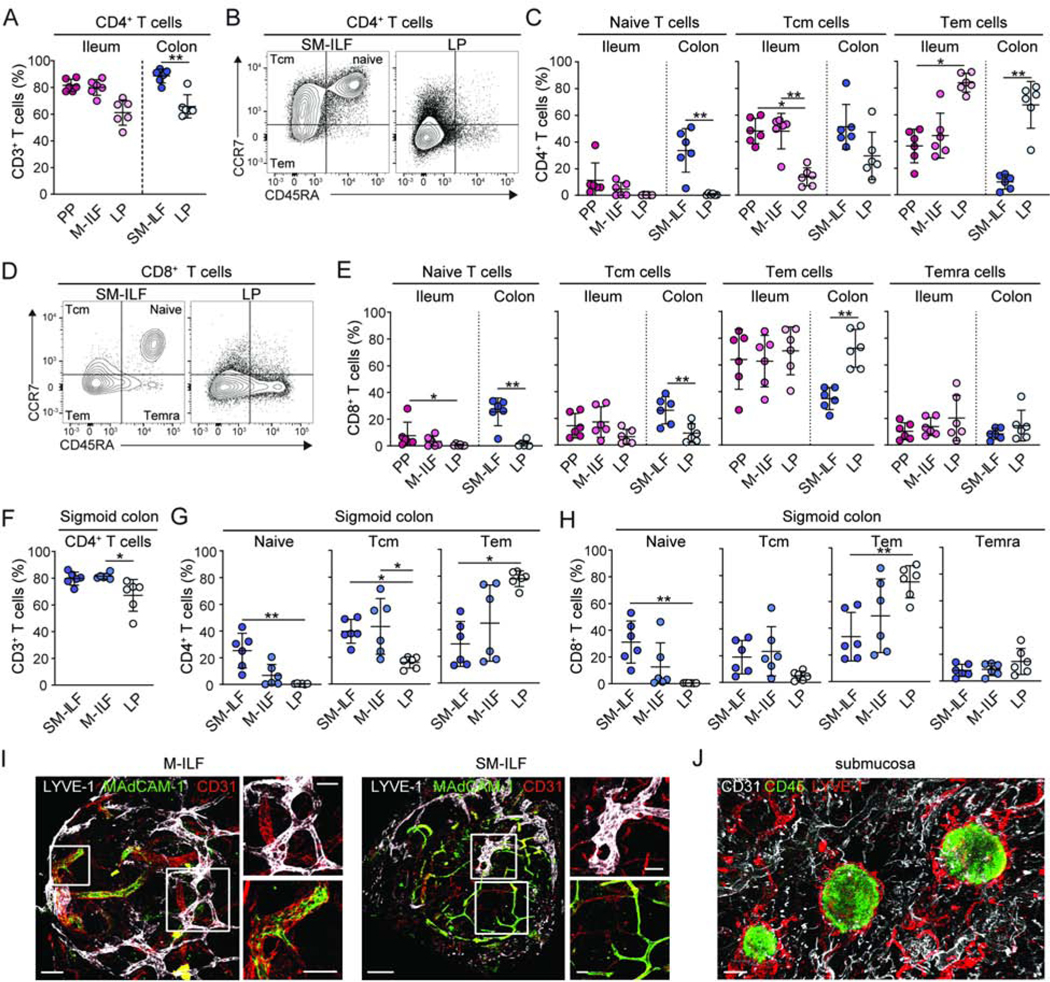
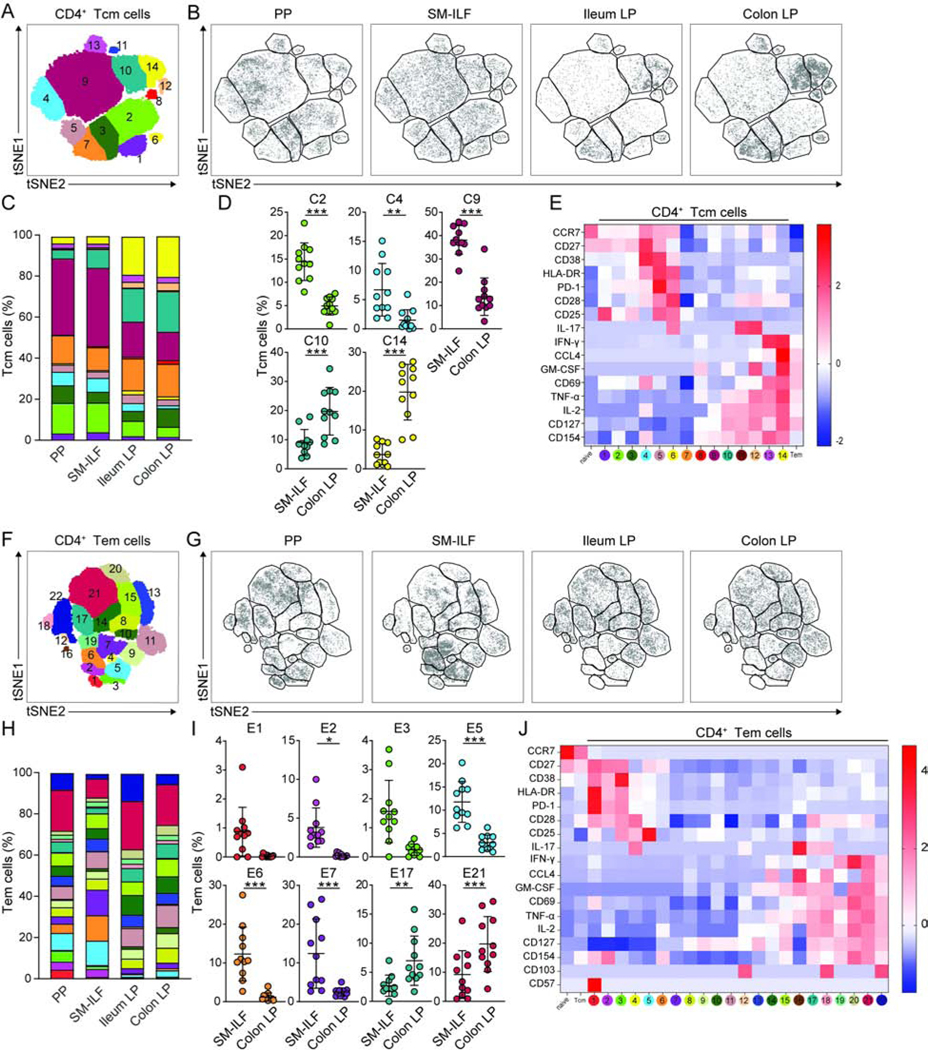
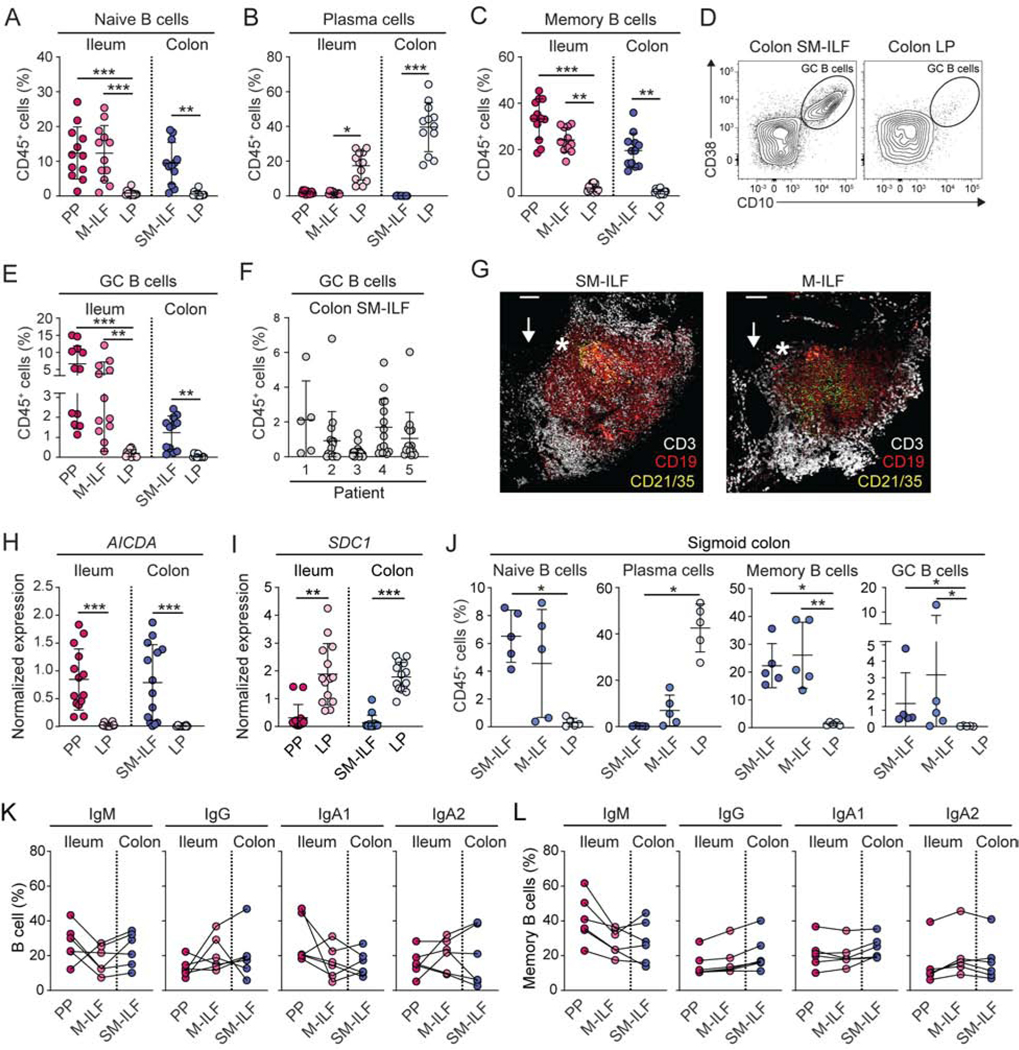
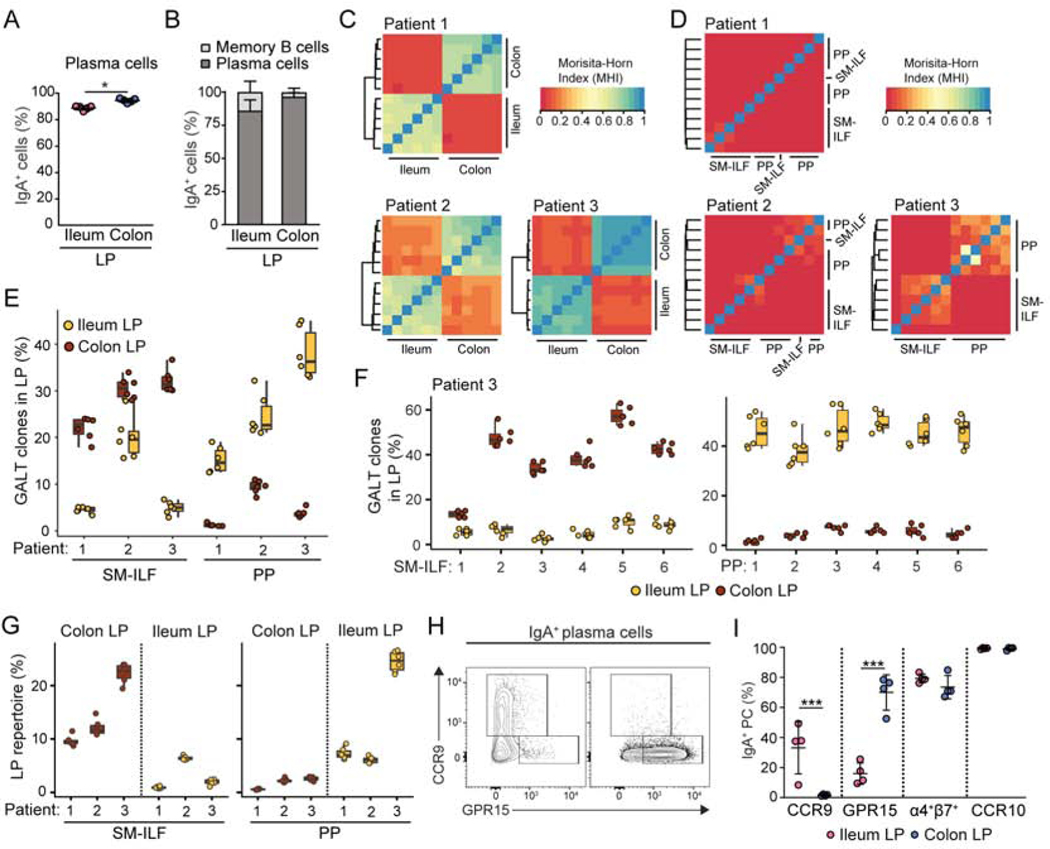
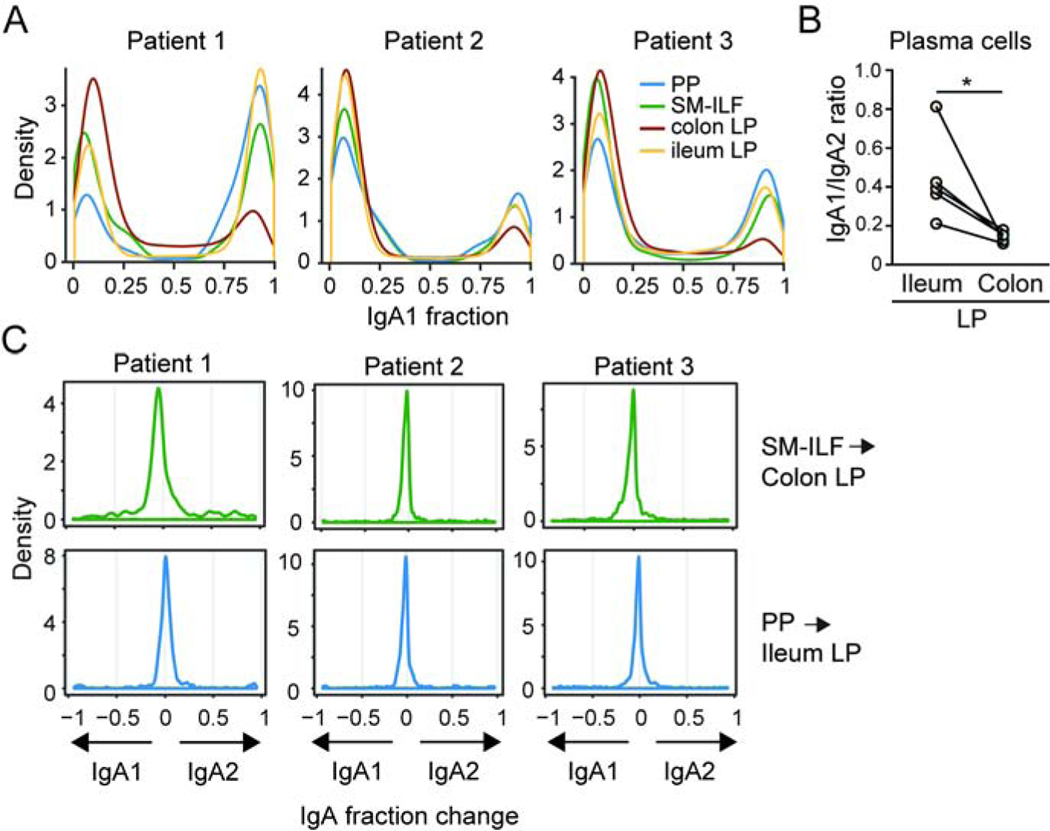
The intestine contains some of the most diverse and complex immune compartments in the body. Here we describe a method for isolating human gut-associated lymphoid tissues (GALTs) that allows unprecedented profiling of the adaptive immune system in submucosal and mucosal isolated lymphoid follicles (SM-ILFs and M-ILFs, respectively) as well as in GALT-free intestinal lamina propria (LP). SM-ILF and M-ILF showed distinct patterns of distribution along the length of the intestine, were linked to the systemic circulation through MAdCAM-1+ high endothelial venules and efferent lymphatics, and had immune profiles consistent with immune-inductive sites. IgA sequencing analysis indicated that human ILFs are sites where intestinal adaptive immune responses are initiated in an anatomically restricted manner. Our findings position ILFs as key inductive hubs for regional immunity in the human intestine, and the methods presented will allow future assessment of these compartments in health and disease.

Keywords: ILF; IgA; PP; colon; human intestinal regional mucosal follicles; iIeum.


Conflict of interest statement

Declaration of Interests The authors declare no competing interests.

Figures

Figure 1.
Figure 1.. Identification of isolated lymphoid follicles in human intestine
(A) Mucosal tissue showing holes (white arrow heads) in the colon LP after removal of SM. Scale bar, 1mm. (B) Lymphoid follicles (white arrow heads) were identified in the SM after counterstaining with methylene blue. Scale bar, 1mm. (C) H&E and (D) immunofluorescence analysis of SM follicles of full-thickness colon sections. Scale bar, (C) 200μm and (D) 100μm. (D) SM follicles comprise a central follicle of CD19+ B cells (purple) surrounded by CD3+ T cells (blue), a sub-epithelial dome (SED, star) containing CD11c+ cells (green) and an overlying CD49f+ epithelial basement membrane (red). Arrow indicates epithelium. Grey, nuclei stain. (E) Quantification of SM-GALT in indicated tissue. Each dot represents the mean number of GALT from a single patient, based on at least 2.5 cm2 of SM. Grey circles, uninvolved colorectal cancer, red circles, volvulus and orange circles, diverticulitis patients. Bars, mean ± 1SD. (F) Percentage of total GALT surface covered by the different kinds of GALT structures. Mean of 3–15 patients per site. (G) Diameter of SM-ILF within indicated tissue. Each dot represents the mean SM-ILF diameter from a single patient based on at least 2.5 cm2 of SM. Grey circles, uninvolved colorectal cancer, red circles, volvulus and orange circles, diverticulitis patients. Bars, mean ± 1SD. (H) Size distribution of SM-ILF within indicated tissue. Mean of 3–15 patients per site. (I) Mucosa after removal of SM showing the presence of M-ILF (black arrows) and holes left behind by SM-ILF (white arrow heads). Scale bar, 1mm (upper panel) and 100μm (lower panel). (J and K) Immunofluorescence staining of full-thickness sigmoid colon tissue showed M-ILF to contain a central follicle containing CD19+ B cells (purple) surrounded by CD3+ T cells (blue), a SED (star) containing CD11c+ cells (green) and overlying CD49f+ epithelial basement membrane (red). Grey, nuclei stain. Arrow indicates epithelium. Scale bar, 100μm. (K) M-ILF do not penetrate the smooth muscle actin (SMA) expressing muscularis mucosa. (L) Quantification of M-ILF in indicated tissues. Each dot represents the mean number of M-ILF from a single patient based on at least 2.5 cm2 of peeled LP. Grey circles, uninvolved colorectal cancer, red circles, volvulus and orange circles, diverticulitis patients. Bars, mean ± 1SD. (M) The follicle associated epithelium (FAE, arrow) of M-ILF showing a CD45+ lymphocyte filled pockets (lower panel, arrow head) and GP-2 expressing M cells (upper panel, arrow head). Scale bar, 20μm (upper panel) and 40μm (lower panel). Representative images of at least 3 donors. Star depicts SED. Grey, nuclei stain. (N) Scanning electron micrographs depicting cells with M-cell like morphology (white arrow heads) in the FAE of SM-ILF. Scale bar, 50μm (upper panel) and 5μm (lower panel). Representative images of 3 patients. Cec, caecum; Asc, ascending colon; Tra, transverse colon; Sig, sigmoid colon; Rec, rectum. See also Figure S1.
Figure 2.
Figure 2.. The T cell composition of human ILF indicates they function as adaptive immune inductive sites
(A–E) T cell populations in single-cell suspensions of indicated paired tissues from right-sided hemi-colectomy resections were analyzed by flow cytometry. (A) CD4+ T cell frequency among CD3+ T cells from indicated compartments. (B, C) Representative gating (B) and quantification (C) of naïve, central memory (Tcm) and effector or effector memory (Tem) CD4+ T cells in indicated compartments. (D–E) Representative gating (D) and quantification (E) of naïve, Tcm, Tem and CD45RA+effector memory (Temra) CD8+ T cells in indicated compartments. (F) CD4+ T cell frequency of total CD3+ T cells, (G) CD4+ T cell and (H) CD8+ T cell composition of indicated compartments in the sigmoid colon. (A-H) PP, Peyer’s patch; SM-ILF, submucosal follicle; M-ILF, mucosal follicle; LP, lamina propria. Each circle represents an individual donor, matched between each of the sites, with SM-ILF and M-ILF data from at least 5 pooled follicles. Bars, mean ± 1SD. Statistical significance between paired samples was determined using the paired Friedman test with Dunn’s multiple comparisons *p<0.05, **p<0.01, ***p<0.001. (I and J) Immunofluorescence staining of (I) SM-ILF and M-ILF and (J) whole-mount SM. (I) LYVE-1+ lymphatics (white) and MAdCAM-1+CD31+ vascular endothelial cells (green). Scale bar, 100μm (M-ILF, left panel), 200μm (SM-ILF, left panel) and 50μm (right panels). (J) CD45+ cells (green), LYVE-1+ lymphatics (red) CD31+ endothelial cells (white). Scale bar, 300μm. Representative images from at least 3 donors. See also Figure S2.
Figure 3.
Figure 3.. Antigen experienced CD4+ T cells in GALT and LP are functionally distinct
(A–K) Cell suspensions from indicated tissues were stimulated with PMA and ionomycin and analyzed by CyTOF. (A and F) 2D tSNE plots of total (A) CD45RACCR7+ CD4+ Tcm cells and (F) CD45RACCR7 effector or effector memory CD4+ Tem cells. (B and G) 2D tSNE plots of (B) Tcm and (G) Tem cells within indicated immune niche. Data are concatenated from 6–11 patients. (C and H) Bar charts showing mean cluster frequencies of (C) Tcm and (H) Tem cells. (D and I) Frequency of (D) Tcm and (I) Tem cell clusters within SM-ILF and colon LP. Clusters showing differences between sites are shown. Each circle represents an individual donor with samples paired from 11 patients; SM-ILF data is from at least 20 pooled follicles per patient. Bars, mean ± 1SD. (E and J) Heatmaps of (C) Tcm and (H) Tem cell cluster phenotypes showing Z-score of intensity of each marker, normalized by row. MFI of total naïve and Tcm or Tem cell populations is included for comparison. PP, Peyer’s patch; SM-ILF, submucosal isolated lymphoid follicle; LP, lamina propria. Statistical significance was determined using paired 2-way ANOVA, false discovery rate was corrected with the twostage step-up method of Benjamini, Krieger and Yekutieli, *p<0.05, **p<0.01, ***p<0.001. See also Figure S3.
Figure 4.
Figure 4.. B cell subset composition of human GALT is distinct from LP.
(A-E) B cell populations in indicated tissues were assessed by flow cytometry. (A) Naïve IgD+CD19+ B cell frequency of total CD45+ cells. (B) CD20CD38+ PC frequency of total CD45+ cells. (C) CD38CD10- memory B cell frequency amongst total CD45+ T cells. Each circle represents an individual donor, matched between each of the sites, with SM-ILF and M-ILF data from at least 5 pooled follicles. Bars, mean ± 1SD. (D–E) Representative contour plots (D) and frequency (E) of CD20hiCD10+ GC B cells amongst total CD45+ cells. (F) CD20hiCD10+ GC B cell frequency amongst total CD45+ cells in individual SM-ILF from 5 different donors. Each circle represents a single follicle. Bars, mean ± 1SD. (G) Whole-mount immunofluorescence stain of distal colon M-ILF and SM-ILF showing CD21+CD35+ follicular dendritic cells (green or yellow) within a CD19+ B cell follicle (red) surrounded by CD3+ T cells (white). Arrow depicts location of epithelium and star location of sub-epithelial dome. Scale bars, 100μm. (H and I) Expression of (H) AICDA and (I) SDC1 mRNA in indicated tissues as assessed by qPCR. Each circle represents a single follicle (PP or ILF) or LP sample (LP) and data are from 4 patients. Bars, mean ± 1SD. (J) B cell populations in indicated sites of the sigmoid colon. Each circle represents an individual donor with paired samples. SM-ILF and M-ILF data are from at least 5 pooled follicles per patient. Bars, mean ± 1SD. Pooled data of indicated Ig isotype expression by (K) GC and (L) memory B cells in PP, M-ILF and SM-ILF. Each circle represents an individual donor with lines joining paired samples. SM-ILF and M-ILF data are from least 5 pooled ILF per patient. Bars, mean ± 1SD. PP, Peyer’s patch; SM-ILF, submucosal follicle; M-ILF, mucosal follicle; LP, lamina propria. Statistical significance was determined using the paired Friedman test with Dunn’s multiple comparisons *p<0.05, **p<0.01, ***p<0.001. See also Figure S4.
Figure 5.
Figure 5.. Isolated lymphoid follicles contribute to region-specific adaptive immune responses
(A) Proportion of LP PC expressing IgA and (B) proportion of LP IgA+ cells that were PC in indicated tissue. Each circle represents an individual donor with paired samples. (C–G) The IgA repertoire in ileum and proximal colon GALT and LP was determined in 3 individual donors. (C and D) The Morisita-Horn similarity index (MHI) between (C) six individual cLP and siLP samples and (D) six individual PP and colon SM-ILF follicles, collected from each of the three patients analyzed. (E) Percentage of the most dominant GALT IgA clones in indicated LP samples. The 100 most abundant clones within each PP follicle (n=6) and SM-ILF (n=6) were pooled (PP: 471–583; SM-ILF: 521–570 clones) and the percentage of these clones that were present with ≥10 reads in each of the ileum and colon LP samples assessed. (F) Percentage of top 100 clones present in each individual GALT sample (X axis) from patient 3 that were present with ≥10 reads in each LP sample. (G) Proportion of the IgA repertoire in each LP sample that was covered by the dominating 100 clones in the 6 pooled SM-ILF (521–570 clones) or 6 pooled PP follicles (471–583 clones). Data from each of the three patients (X axis) is shown. (E-G) Bars represent boxplots with 1st, median and 3rd quartile. (H) Representative flow cytometry plots and (I) pooled analysis of intestinal homing receptor expression by IgA+ PC in indicated tissue. Each circle represents an individual donor with paired samples. PP, Peyer’s patch; SM-ILF, submucosal follicle; M-ILF, mucosal follicle; LP, lamina propria; GALT, gut-associated lymphoid tissue. See also Figure S5.
Figure 6.
Figure 6.. IgA isotype is related to clonality with little evidence of sequential IgA1 to IgA2 switching
(A) The distribution of the IgA1:IgA2 ratio per clone (IgA1+ ~1.0; IgA2+ ~0.0) in indicated samples (see STAR methods). (B) IgA1:IgA2 ratio of LP PC in ileum and proximal colon LP as assessed by flow cytometry. Each circle represents a single patient with paired samples. *p<0.05, paired student’s t test. (C) Distribution of change in IgA isotype for the top 100 GALT clones showing ≥ 10 reads within the LP. Clones of each GALT sample were compared to each LP sample. The change in IgA isotype of a specific clone was calculated by subtracting the IgA1 fraction of the clone in LP from the IgA1 fraction of the clone in GALT. Displayed are the change in fraction of each clone from IgA2 to IgA1 (negative values) or from IgA1 to IgA2 (positive values). Top panels, SM-ILF clones in colonic LP, lower panels PP clones in ileal LP. PP, Peyer’s patch; SM-ILF, submucosal follicle; LP, lamina propria.

References

    1. Agace WW, and McCoy KD (2017). Regionalized Development and Maintenance of the Intestinal Adaptive Immune Landscape. Immunity 46, 532–548. - PubMed
    1. Barone F, Patel P, Sanderson JD, and Spencer J. (2009). Gut-associated lymphoid tissue contains the molecular machinery to support T-cell-dependent and T-cell-independent class switch recombination. Mucosal Immunol. 2, 495–503. - PubMed
    1. Bergqvist P, Stensson A, Lycke NY, and Bemark M. (2010). T Cell-Independent IgA Class Switch Recombination Is Restricted to the GALT and Occurs Prior to Manifest Germinal Center Formation. J. Immunol 184, 3545–3553. - PubMed
    1. Bolotin DA, Poslavsky S, Mitrophanov I, Shugay M, Mamedov IZ, Putintseva EV, and Chudakov DM (2015). MiXCR: software for comprehensive adaptive immunity profiling. Nat. Methods 12, 380–381. - PubMed
    1. Boursier L, Gordon JN, Thiagamoorthy S, Edgeworth JD, and Spencer J. (2005). Human Intestinal IgA Response Is Generated in the Organized Gut-Associated Lymphoid Tissue but Not in the Lamina Propria. Gastroenterology 128, 1879–1889. - PubMed

Publication types

MeSH terms