. 2020 Mar 17;52(3):528-541.e7.
doi: 10.1016/j.immuni.2020.02.005. Epub 2020 Mar 10.

Tuft-Cell-Derived Leukotrienes Drive Rapid Anti-helminth Immunity in the Small Intestine but Are Dispensable for Anti-protist Immunity

Affiliations

Tuft-Cell-Derived Leukotrienes Drive Rapid Anti-helminth Immunity in the Small Intestine but Are Dispensable for Anti-protist Immunity

John W McGinty et al. Immunity. .

Abstract

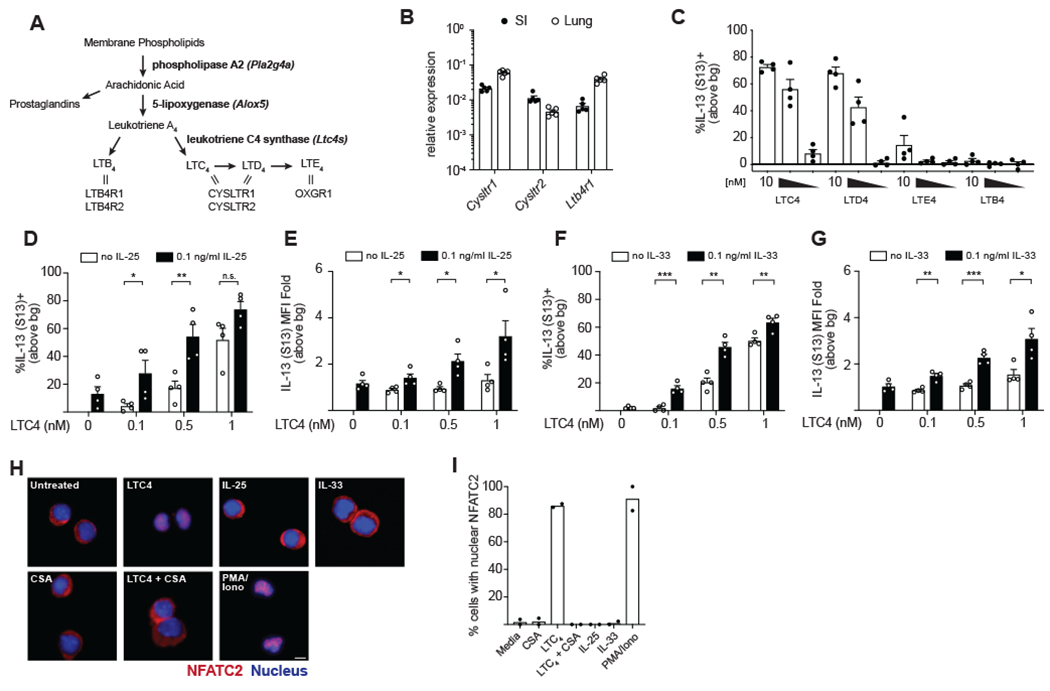
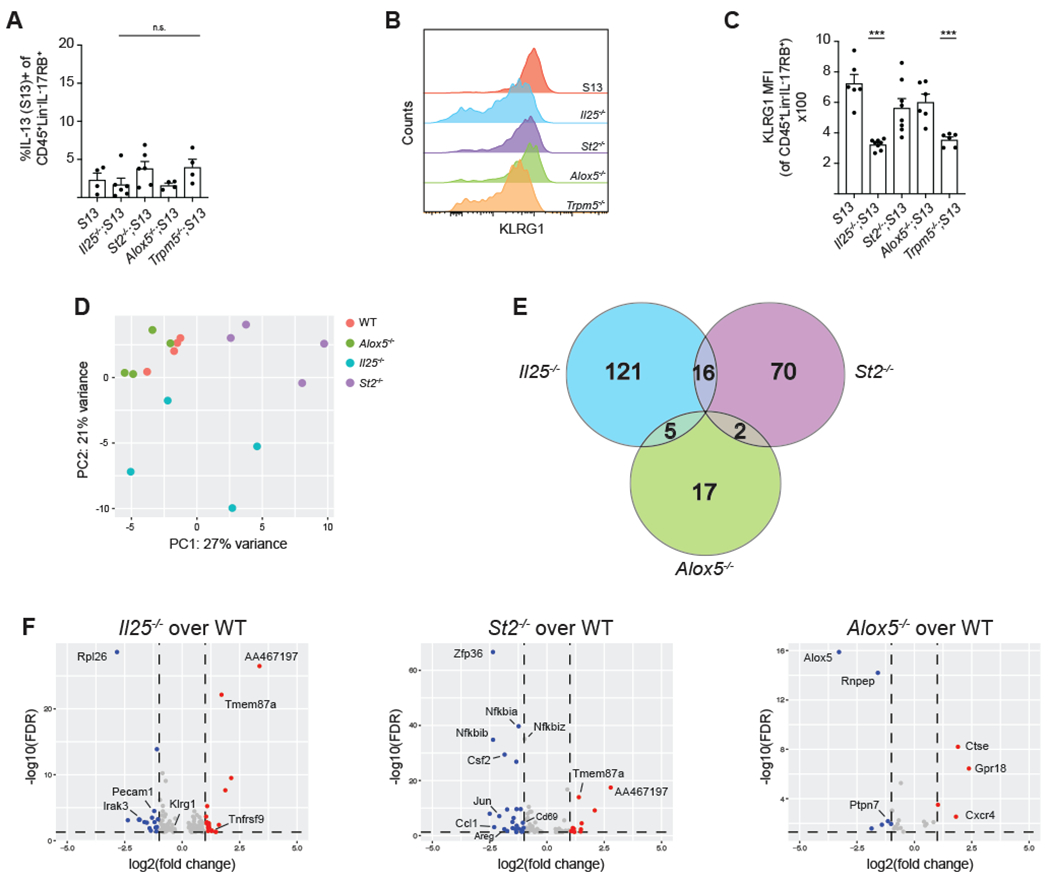
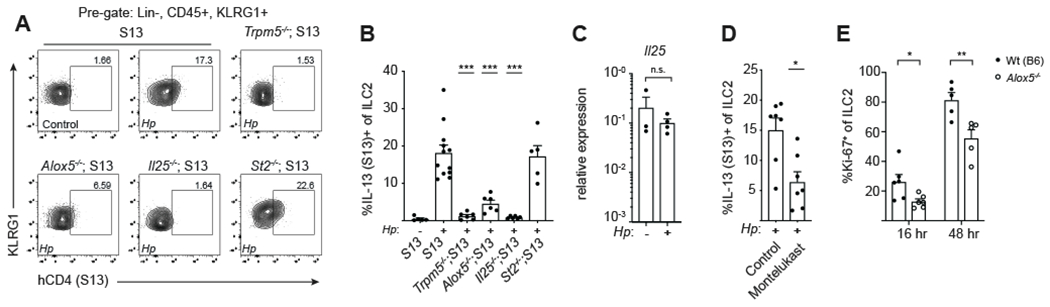
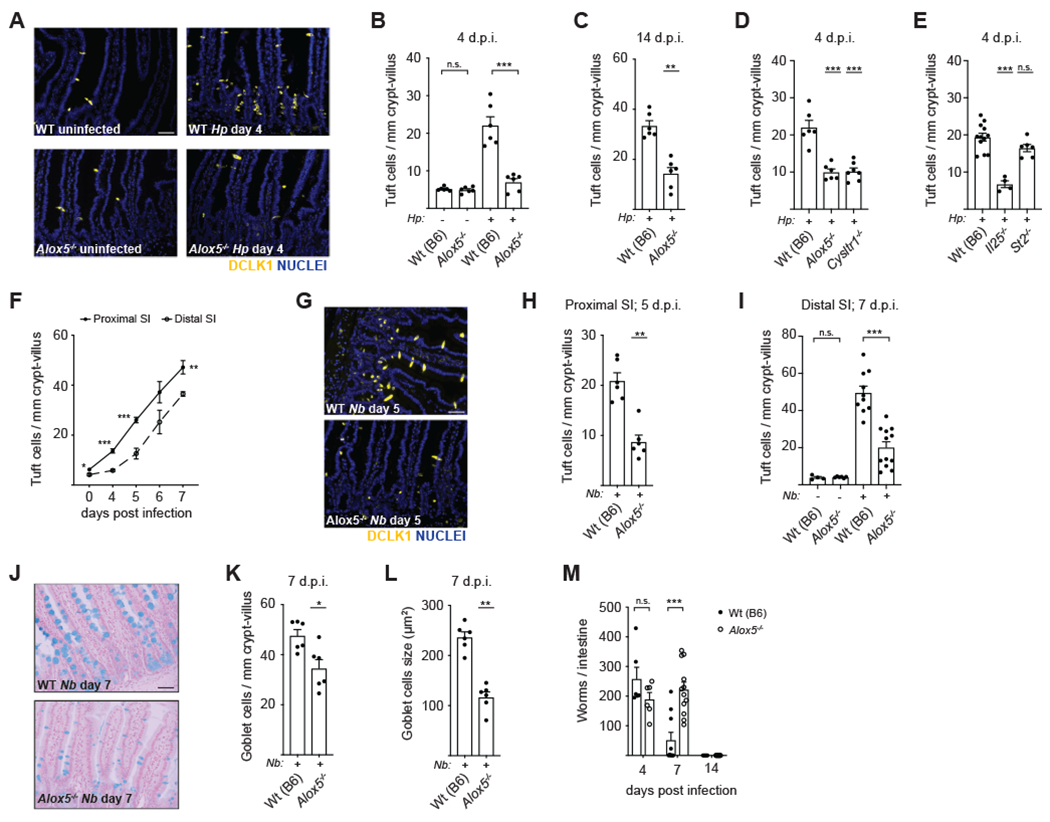
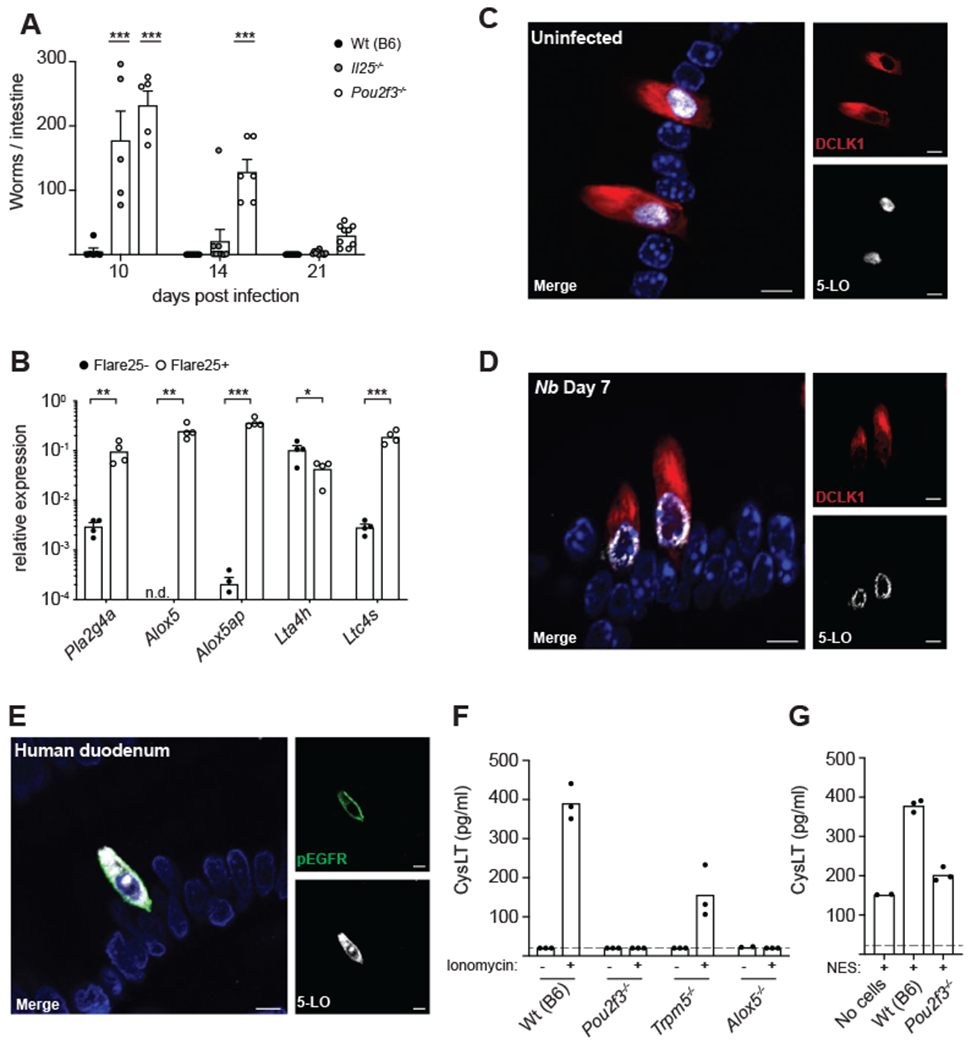
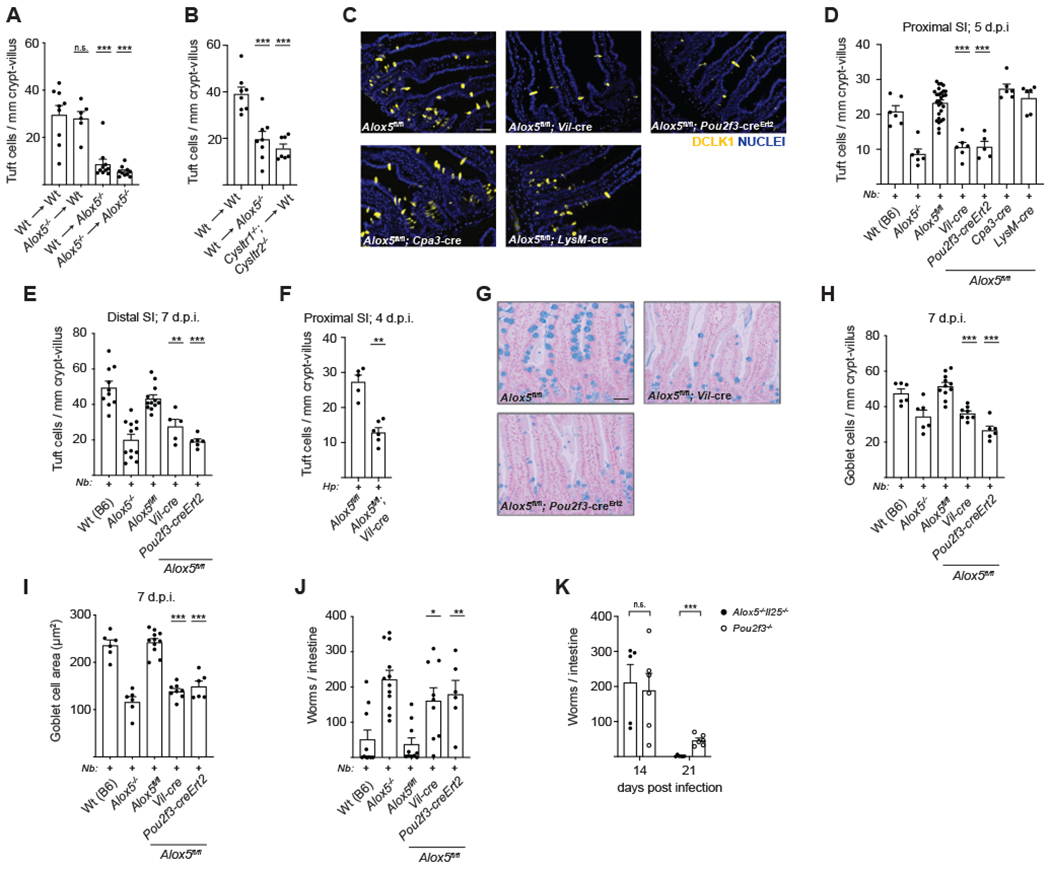
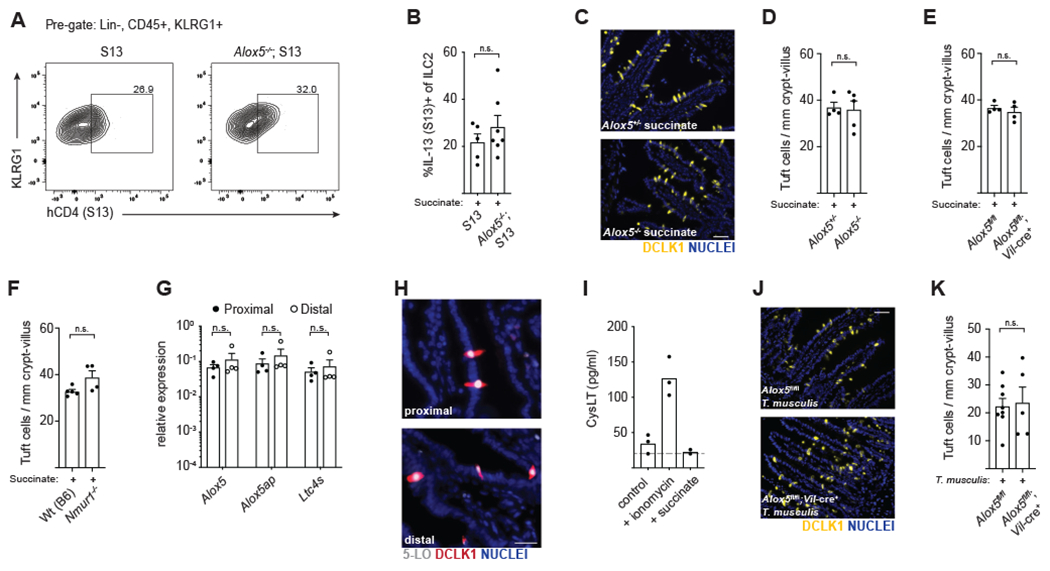
Helminths, allergens, and certain protists induce type 2 immune responses, but the underlying mechanisms of immune activation remain poorly understood. In the small intestine, chemosensing by epithelial tuft cells results in the activation of group 2 innate lymphoid cells (ILC2s), which subsequently drive increased tuft cell frequency. This feedforward circuit is essential for intestinal remodeling and helminth clearance. ILC2 activation requires tuft-cell-derived interleukin-25 (IL-25), but whether additional signals regulate the circuit is unclear. Here, we show that tuft cells secrete cysteinyl leukotrienes (cysLTs) to rapidly activate type 2 immunity following chemosensing of helminth infection. CysLTs cooperate with IL-25 to activate ILC2s, and tuft-cell-specific ablation of leukotriene synthesis attenuates type 2 immunity and delays helminth clearance. Conversely, cysLTs are dispensable for the tuft cell response induced by intestinal protists. Our findings identify an additional tuft cell effector function and suggest context-specific regulation of tuft-ILC2 circuits within the small intestine.

Keywords: Heligmosomoides polygyrus; ILC2; Nippostrongylus brasiliensis; brush cell; helminth; intestine; leukotriene; protist; succinate; tuft cell.


Conflict of interest statement

Declaration of Interests The authors declare no competing interests.

Figures

Figure 1.
Figure 1.. Cysteinyl leukotrienes are a non-redundant signal for intestinal ILC2 activation
(A) Schematic of leukotriene synthesis. Enzymes in bold. Double lines represent ligand-receptor interactions. (B) Gene expression in ILC2s sorted from the SI lamina propria and lung. (C) Frequency of IL-13 (S13)+ SI ILC2s following 6 hour in vitro culture with the indicated leukotriene. Ten-fold dilutions from 10-0.1 nM are shown. (D,F) Frequency and (E,G) mean fluorescence intensity (MFI) of IL-13 (S13)+ SI ILC2s following 6 hour in vitro culture with the indicated combinations of LTC4 and IL-25 (D,E) or IL-33 (F,G). (H) SI ILC2s were treated for 30 min with 1 μM cyclosporin A (CSA) where indicated, followed by 90 min treatment with 100nM LTC4, 100ng/ml IL-25, 100ng/ml IL-33, or 30ng/ml PMA and 500ng/ml ionomycin. Cells were stained with anti-NFATC2 (red) and DAPI (blue). Scale bar: 20μm. (I) Quantification of cells with nuclear NFATC2. At least 30 cells were counted for each condition. In (B)-(G) each symbol represents an individual mouse pooled from two or more experiments. In (I) symbols are technical replicates representative of three independent experiments, bg, background. *p < 0.05, **p < 0.01, ***p < 0.001 by multiple t tests (D-G). n.s., not significant. Graphs depict mean + SEM. See also Figure S1.
Figure 2.
Figure 2.. ILC2 homeostasis in the proximal small intestine is leukotriene-independent and minimally requires IL-25 and IL-33
(A) Quantification of IL-13 (S13) expression by ILC2s (CD45+;Lineage;IL-17RB+) in the proximal (first 5cm) SI of naïve mice. (B) Mean fluorescence intensity (MFI) of KLRG1 expression by ILC2s. (C) Quantification of MFI in (B). (D-F) mRNA sequencing of ILC2s of the indicated genotype sorted from the proximal SI of naïve mice. (D) PCA of top 500 differentially expressed genes (DEG). (E) Venn diagram depicting DEGs for each genotype as compared to wildtype (FDR <.05, row mean >10). (F) Volcano plots depicting DEGs as compared to wildtype (FDR <.05, row mean >10). Red = log2 fold change > 1, blue = log2 fold change < 1. In (A-D) each symbol represents an individual mouse pooled from two or more experiments. Samples in D were analyzed in one sequencing run. *p < 0.05, **p < 0.01, ***p < 0.001 by one way ANOVA (A, C) with comparison to S13. n.s., not significant. Graphs depict mean + SEM. See also Figure S2 and Tables S1–4.
Figure 3.
Figure 3.. Cysteinyl leukotrienes drive rapid ILC2 activation following helminth infection
(A) Flow cytometry for IL-13 (S13) expression by ILC2s in the proximal (first 10cm) SI 16 hours after infection with H. polygyrus (H.p.). (B) Quantification of IL-13 (S13) expression in (A). (C) Il25 mRNA expression in tuft cells sorted from the proximal SI of naïve Wt(B6) mice and mice infected with H.p. for 16 hours. (D-E) Analysis of ILC2s from the proximal SI. (D) IL-13 (S13)+ ILC2s in mice treated with montelukast (10mg/kg) 60 min prior to 16 hours infection with H.p. (E) ILC2 Ki-67 expression at the indicated time points following infection with H.p. In (B)-(E) each symbol represents an individual mouse pooled from two or more experiments. *p < 0.05, **p < 0.01, ***p < 0.001 by one way ANOVA (B) with comparison to infected S13, by Mann-Whitney (C-D), or by multiple t tests (E). n.s., not significant. Graphs depict mean + SEM. See also Figure S3.
Figure 4.
Figure 4.. Tuft-ILC2 circuit activation and helminth clearance are delayed in the absence of cysteinyl leukotrienes
(A) Tuft cell frequency in the proximal (first 10cm) SI of mice infected with H. polygyrus (H.p.) for 4 days. DCLK1 (yellow) marks tuft cells. DAPI (blue) marks nuclei. Scale bar: 50μm. (B) Quantification of tuft cells in (A). (C) Tuft cell frequency in the proximal SI after 14 days of H.p. infection. (D-E) Tuft cell frequency in the proximal SI of the indicated genotypes after 4 days of H.p. infection. (F) Tuft cell frequency in the proximal and distal (last 10cm) SI of wildtype mice at the indicated time points post-N. brasiliensis (N.b.) infection. (G) Representative images of proximal SI on day 5 post-N. b. infection. Scale bar: 50μm. (H) Quantification of tuft cells in (G). (I) Tuft cell frequency in the distal SI after 7 days of N.b. infection. (J) Goblet cells identified in the jejunum (10-20cm from stomach) by alcian blue staining 7 days after infection with N.b. Representative images are shown. Scale bar: 50μm. (K-L) Quantification of goblet cell (K) number and (L) size in (J). (M) Worm burden across the entire SI at the indicated time points post-N.b. infection. In (B)-(E), (H)-(I), and (K)-(M) each symbol represents an individual mouse pooled from two or more experiments. In (F) each symbol represents the average of five mice pooled from two experiments, d.p.i., days post infection. *p < 0.05, **p < 0.01, ***p < 0.001 by Mann-Whitney (C, H, K-L), by multiple t tests (B, F, I, M), or by one way ANOVA (D-E) with comparison to Wt(B6). n.s., not significant. Graphs depict mean + SEM. See also Figure S4.
Figure 5.
Figure 5.. Tuft cells synthesize cysteinyl leukotrienes
(A) Mice were infected with N. brasiliensis (N.b.) and SI worm burden determined at the indicated time points. (B) Gene expression in tuft cells (Flare25+) and non-tuft epithelial cells (Flare25+) sorted from the entire SI. (C) Colocalization of 5-LO (white) and DCLK1 (red) in the proximal (first 10cm) SI of a naïve mouse. DAPI (blue) marks nuclei. Representative images are shown. Scale bars: 5μm. (D) Example of 5-LO localization in tuft cells from the proximal SI of a mouse infected with N.b. for 7 days. Scale bars: 5μm. (E) Colocalization of 5-LO (white) and pEGFR (green) in human duodenum. Images are representative of three different patient samples. Scale bars: 5μm. (F-G) Cysteinyl leukotriene (cysLT) production in supernatants of intestinal monolayer cultures derived from mice of the indicated genotype following stimulation with 1μg/ml ionomycin (F) or 100μl NES (G) for 30 minutes. Dashed line represents limit of detection. In (A)-(B) each symbol represents an individual mouse from two or more pooled experiments. In (F)-(G) each symbol is a technical replicate and representative of three or more experiments, n.d., not detected. *p < 0.05, **p < 0.01, ***p < 0.001 by two way ANOVA (A) with comparison to Wt(B6) or by multiple t tests (B). n.s., not significant. Graphs depict mean + SEM. See also Figure S5.
Figure 6.
Figure 6.. Tuft cells are the physiologic source of leukotrienes for induction of type 2 immunity in the small intestine
(A-B) Quantification of tuft cells in the distal (last 10cm) SI of chimeric mice of the indicated genotypes 7 days after N. brasiliensis (N.b.) infection. (C) Representative images of the proximal (first 10cm) SI 5 days post-N.b. infection. DCLK1 (yellow) marks tuft cells. DAPI (blue) marks nuclei. Scale bar: 50μm. (D) Quantification of tuft cells in (C). (E) Tuft cell frequency in the distal SI after 7 days of N.b. infection. (F) Tuft cell frequency in the proximal SI after 4 days of H. polygyrus (H.p.) infection. (G) Mice were infected with N.b. for 7 days and goblet cells identified in the jejunum (10-20cm from stomach) by alcian blue staining. Representative images are shown. Scale bar: 50μm. (H-I) Quantification of goblet cell (H) number and (I) size in (G). (J-K) Worm burden in the SI of N.b. infected mice at (J) day 7 or at (K) the indicated time points post-infection. In (A)-(B), (D)-(F), and (H)-(K) each symbol represents an individual mouse from two or more pooled experiments. In (D-E) and (H-J) Wt(B6) and Alox5−/− are the same as in Figure 4, shown for comparison, d.p.i., days post infection. *p < 0.05, **p < 0.01, ***p < 0.001 by one way ANOVA (A-B, D-E, H-J) with comparison to WT->WT or Alox5fl/fl, by Mann-Whitney (F), or by multiple t tests (K). n.s., not significant. Graphs depict mean + SEM. See also Figure S6.
Figure 7.
Figure 7.. Cysteinyl leukotrienes are dispensable for protist-induced type 2 immunity
(A) Flow cytometry for IL-13 (S13) expression by ILC2s in the distal (last 10cm) SI after 36 hours of succinate treatment. (B) Quantification of IL-13 (S13) expression in (A). (C) Tuft cells in the distal SI after 7 days of succinate treatment. DCLK1 (yellow) marks tuft cells. DAPI (blue) marks nuclei. Scale bar: 50μm. (D) Quantification of tuft cells in (C). (E-F) Quantification of tuft cells in the distal SI of mice treated with succinate for 7 days. (G) Gene expression in tuft cells sorted from the proximal (first 10cm) or distal SI of naïve Wt(B6) mice. (H) 5-LO (white) and DCLK1 (red) in the proximal and distal SI of naïve mice. DAPI (blue) marks nuclei. Scale bar: 25μm. (I) Cysteinyl leukotriene (cysLT) production in supernatants of distal SI epithelial monolayer cultures following 30 minute stimulation with 500ng/ml ionomycin or 10mM succinate. Dashed line represents limit of detection. (J) Tuft cells in the distal SI 7 days post-colonization with T. musculis. Scale bar: 50μm. (K) Quantification of tuft cells in (J). In (B), (D-G) and (K) each symbol represents an individual mouse from two or more pooled experiments. In (I) symbols are technical replicates representative of two independent experiments. *p < 0.05, **p < 0.01, ***p < 0.001 by Mann-Whitney (B, D-F, K) or by multiple t tests (G). n.s., not significant. Graphs depict mean + SEM.

Comment in

References

    1. Bäck M, Dahlén S-E, Drazen JM, Evans JF, Serhan CN, Shimizu T, Yokomizo T, and Rovati GE (2011). International Union of Basic and Clinical Pharmacology. LXXXIV: Leukotriene Receptor Nomenclature, Distribution, and Pathophysiological Functions. Pharmacol. Rev 63, 539–584. - PubMed
    1. Barker N (2013). Adult intestinal stem cells: critical drivers of epithelial homeostasis and regeneration. Nat. Rev. Mol. Cell Biol 15, 19. - PubMed
    1. Barlow JL, Peel S, Fox J, Panova V, Hardman CS, Camelo A, Bucks C, Wu X, Kane CM, Neill DR, et al. (2013). IL-33 is more potent than IL-25 in provoking IL-13-producing nuocytes (type 2 innate lymphoid cells) and airway contraction. J. Allergy Clin. Immunol 132, 933–941. - PubMed
    1. Beller TC, Maekawa A, Friend DS, Austen KF, and Kanaoka Y (2004). Targeted gene disruption reveals the role of the cysteinyl leukotriene 2 receptor in increased vascular permeability and in bleomycin-induced pulmonary fibrosis in mice. J. Biol. Chem 279, 46129–46134. - PubMed
    1. Bezençon C, Fürholz A, Raymond F, Mansourian R, Métairon S, Le Coutre J, and Damak S (2008). Murine intestinal cells expressing Trpm5 are mostly brush cells and express markers of neuronal and inflammatory cells. J. Comp. Neurol 509, 514–525. - PubMed

Publication types

MeSH terms