. 2020 Mar 10;30(10):3397-3410.e5.
doi: 10.1016/j.celrep.2020.02.056.

ABCA1 Exerts Tumor-Suppressor Function in Myeloproliferative Neoplasms

Affiliations

ABCA1 Exerts Tumor-Suppressor Function in Myeloproliferative Neoplasms

Manon Viaud et al. Cell Rep. .

Abstract

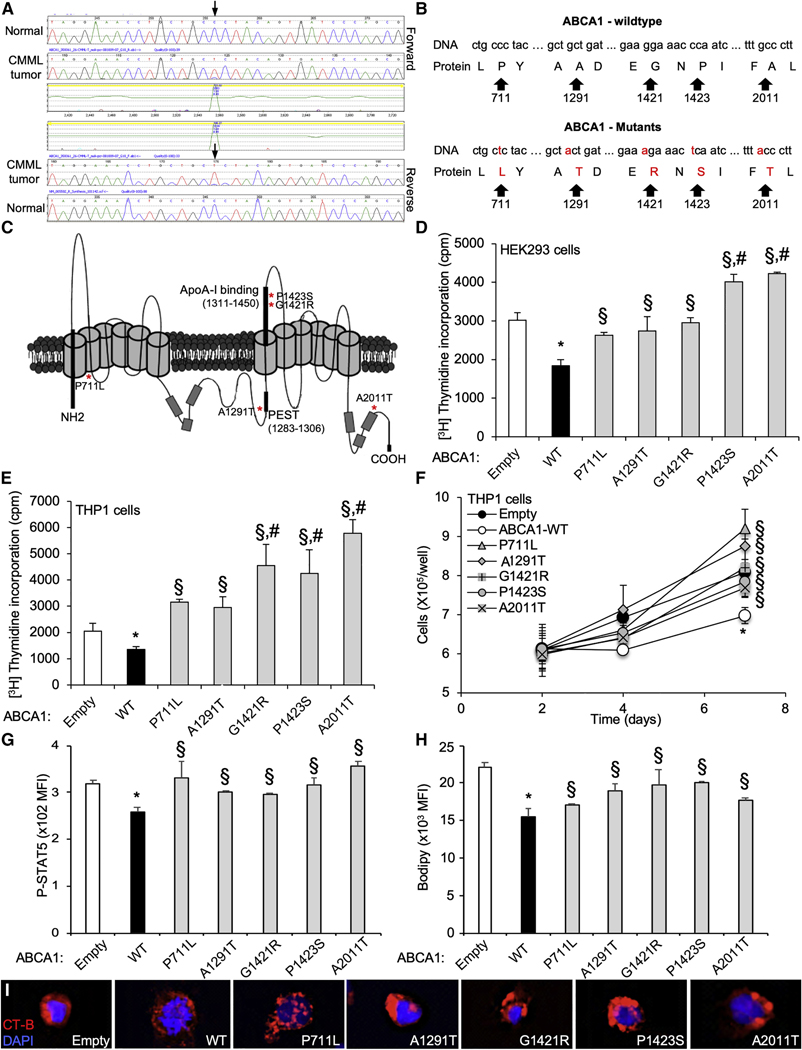
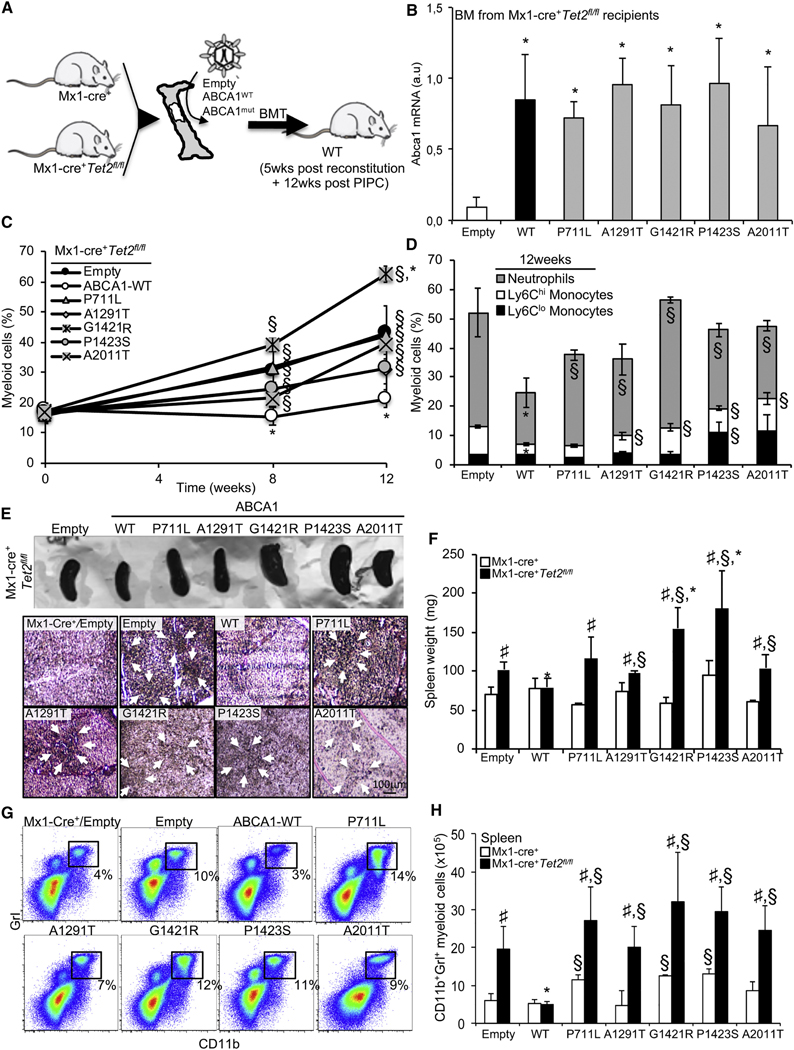
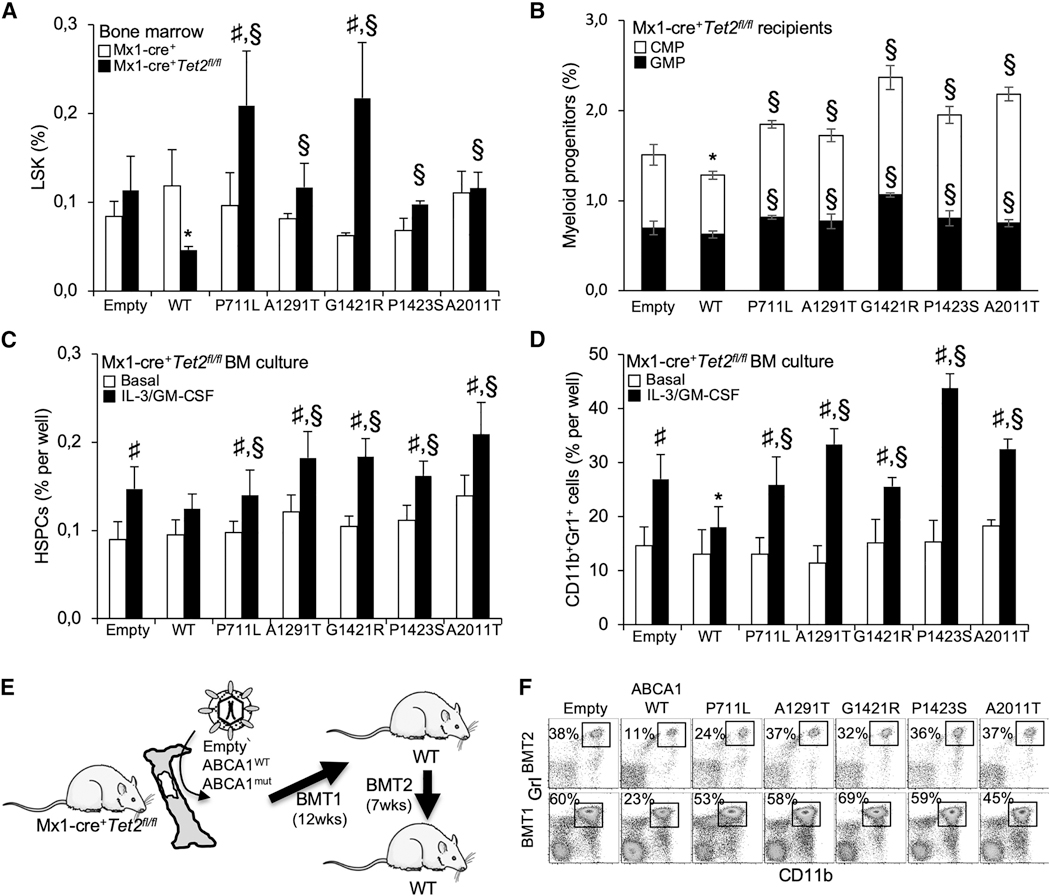
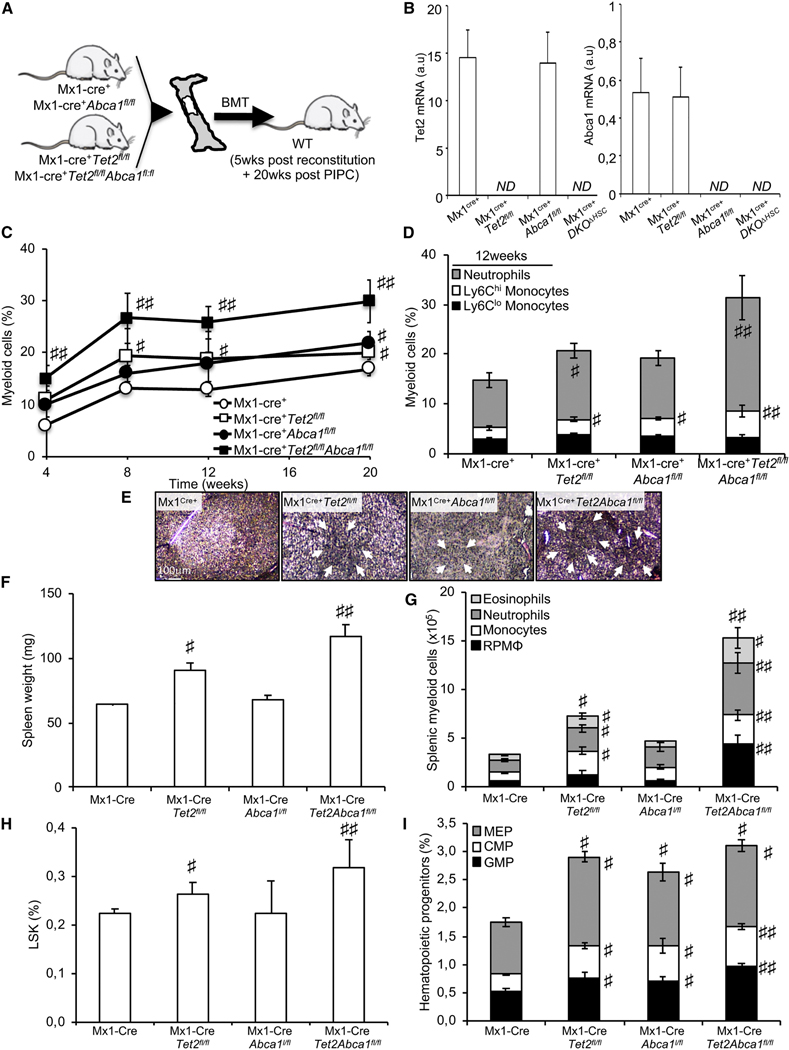
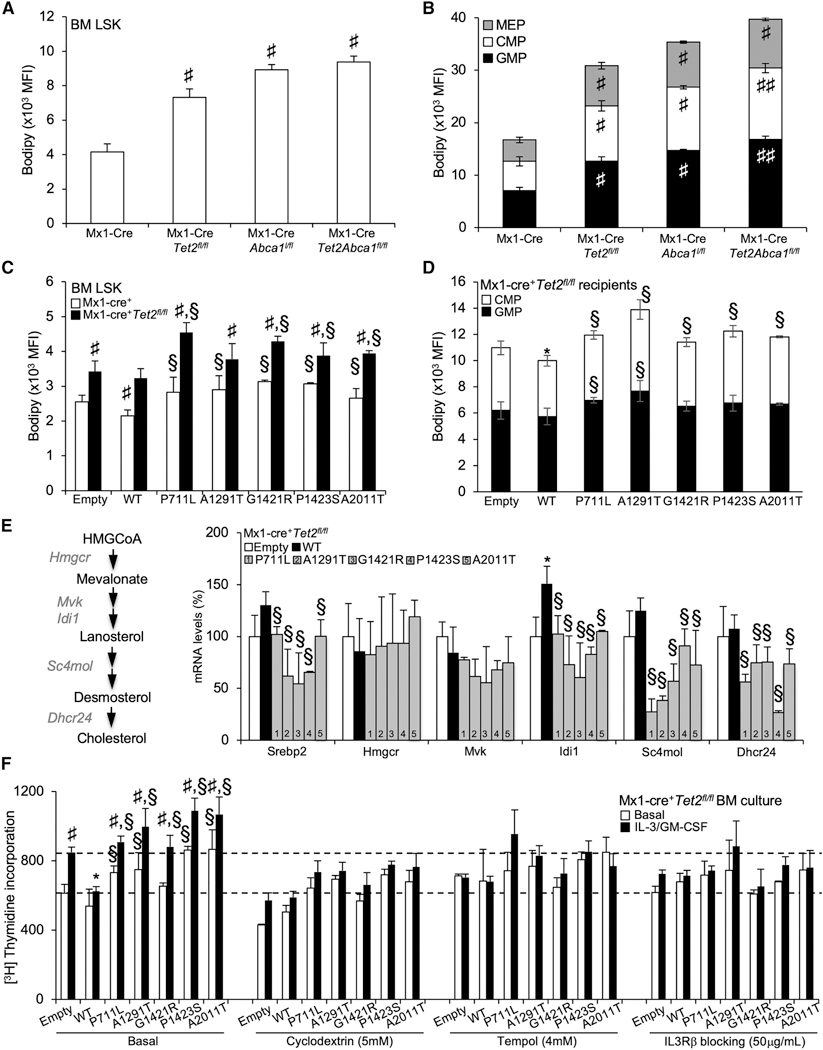
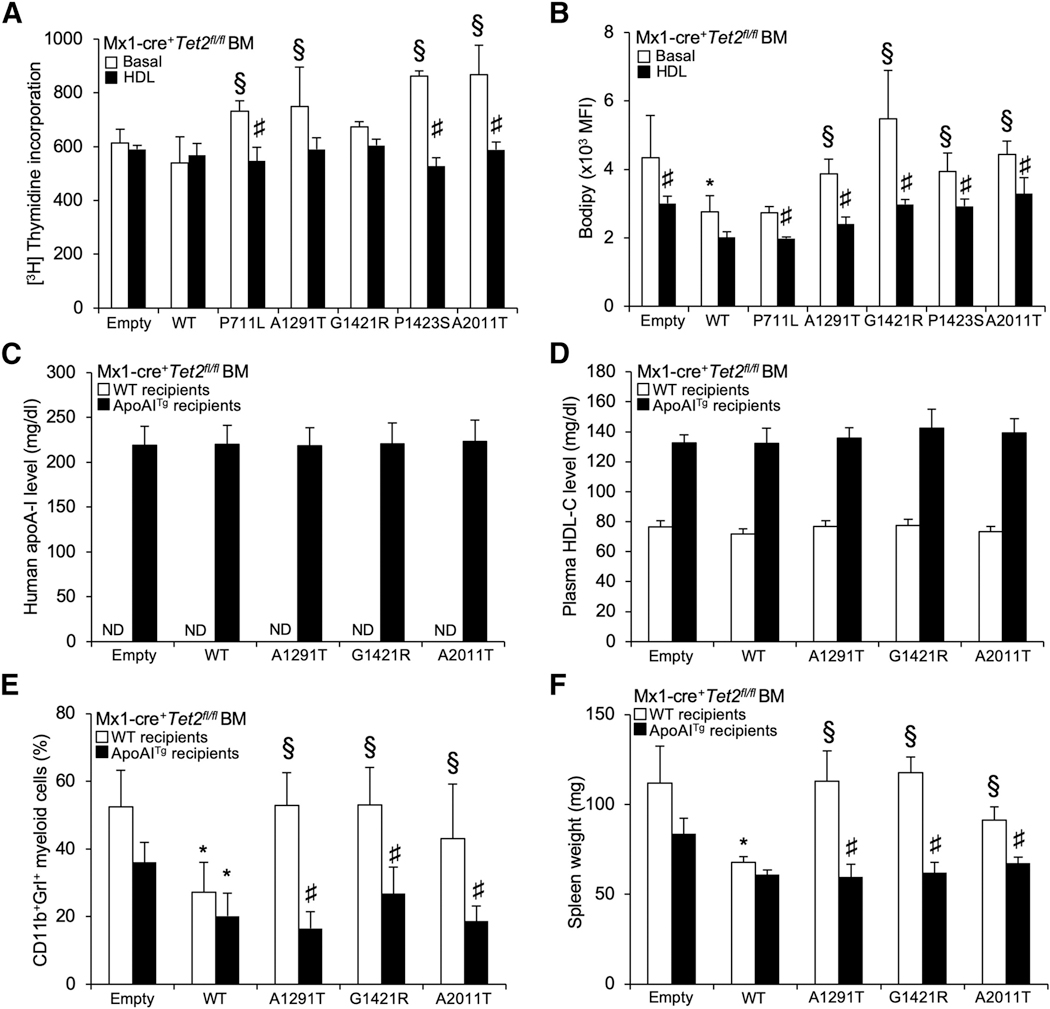
Defective cholesterol efflux pathways in mice promote the expansion of hematopoietic stem and progenitor cells and a bias toward the myeloid lineage, as observed in chronic myelomonocytic leukemia (CMML). Here, we identify 5 somatic missense mutations in ABCA1 in 26 patients with CMML. These mutations confer a proliferative advantage to monocytic leukemia cell lines in vitro. In vivo inactivation of ABCA1 or expression of ABCA1 mutants in hematopoietic cells in the setting of Tet2 loss demonstrates a myelosuppressive function of ABCA1. Mechanistically, ABCA1 mutations impair the tumor-suppressor functions of WT ABCA1 in myeloproliferative neoplasms by increasing the IL-3Rβ signaling via MAPK and JAK2 and subsequent metabolic reprogramming. Overexpression of a human apolipoprotein A-1 transgene dampens myeloproliferation. These findings identify somatic mutations in ABCA1 that subvert its anti-proliferative and cholesterol efflux functions and permit the progression of myeloid neoplasms. Therapeutic increases in HDL bypass these defects and restore normal hematopoiesis.

Keywords: ATP-binding cassette transporter; cholesterol efflux; hematopoietic stem and progenitor cells; leukemia biology; somatic mutations; ten-eleven translocation 2.


Conflict of interest statement

Declaration of Interests R.L.L. is on the supervisory board of QIAGEN and is a scientific advisor to Loxo, Imago, C4 Therapeutics, and Isoplexis, each of which include an equity interest. He receives research support from and has consulted for Celgene and Roche, has received research support from Prelude Therapeutics, and has consulted for Astellas, Incyte, Janssen, Morphosys, and Novartis. He has received honoraria from Lilly and Amgen for invited lectures and from Gilead for grant reviews. The authors have filed a patent, EB19024, on the use of HDL-raising therapies in the treatment of myeloproliferative neoplasms.

Figures

Figure 1.
Figure 1.. Identification of Loss of Function ABCA1 Mutants in CMML
Forward (upper trace) and reverse (lower trace) sequence traces of ABCA1 gene demonstrating a heterozygous cytosine-to-thymine substitution (arrows) present in myeloid cell DNA from patients with chronic myelomonocytic leukemia (CMML). The mutation is not present in buccal DNA from the same patient (upper trace). (A and B) DNA sequence (A) and protein translation (B) for both the wild-type (WT) and mutant ABCA1 alleles. The mutations result in amino acid substitution at codons 711, 1,291, 1,421,1,423, and 2,011. (C ) Representative 3D structure of ABCA1 transporter. The asterisks represent localizations ABCA1 mutants. (D and E) [3H]-Thymidine proliferation assays (Pulsed for 2h) were performed in HEK293 cells transiently transfected with plasmid constructs expressing ABCA1-WT and ABCA1 mutants or empty vector (D), or in THP-1 monocytic leukemia cells transduced for 72 h with lentiviral particles expressing ABCA1-WT, ABCA1 mutants or empty vector (E). (F) THP-1 cells transduced for 72 h with ABCA1 mutants exhibit growth advantage over a 7-day period compared with ABCA1-WT. (G and H) Expression of phosphoSTAT5 (G) and BODIPY staining (H) determined by flow cytometry in these cells. (I) Confocal images of lipid raft staining in THP-1 cells transduced for 72 h with empty, ABCA1-WT, and ABCA1 mutants. Values are mean ±SEMs of at least 3 experiments performed in triplicate. *P < 0.05 ABCA1-WT versus empty control. #P < 0.05 ABCA1 mutants versus empty control. §p < 0.05 versus ABCA1-WT.
Figure 2.
Figure 2.. Loss of Functional ABCA1 Reduces Tumor Suppression in Myelomonocytic Leukemia Induced by Tet2 Loss
(A) Experimental overview. BM from Mx1-Cre+ or Mx1-Cre+Tet2fl/fl mice were transduced with lentiviral particles expressing ABCA1-WT, ABCA1 mutants, or empty vector before bone marrow transplantation (BMT) into lethally irradiated WT mice, and after a 5-week recovery period, the mice were injected with poly(l:C) and analyzed over a 12-week-period. (B) Modulation of Abca1 mRNA expression levels in the BM of the aforementioned mouse models. (C) Quantification of the percentage of peripheral blood myeloid cells determined by hematology cell counter over the course of 12 weeks after poly (l:C) injection in recipient mice transplanted with empty, ABCA1-WT, or ABCA1 mutants expressing Mx1-Cre+Tet2fl/fl BM. (D) Peripheral blood myeloid subsets (CD115+Ly6Chl and CD115+Ly6Clo monocytes and CD115-Ly6Chl neutrophils) were also quantified in these mice at the indicated time point. (E) Representative spleen (upper panel) and hematoxylin and eosin (H&E) staining of paraffin-embedded spleen sections from recipient mice transplanted with control or M×1-Cre+Tet2fl/fl BM expressing empty, ABCA1-WT, or ABCA1 mutants (lower panel). Original magnification × 200. Arrows indicate extensive cellular infiltrate. (F) Quantification of spleen weight of these mice. (G and H) Representative dot plot (G) and quantification (H) of CD11 b+ Grl+ myeloid cells determined by flow cytometry in the spleens of recipient mice transplanted with control or Mx1-Cre+Tet2fl/fl BM expressing empty, ABCA1-WT, or ABCA1 mutants. The results are means ± SEMs of 5–9 animals per group. ND, not detectable. *p < 0.05 versus empty control on a Tet2-deficient background. §p < 0.05 versus ABCA1-WT. #p < 0.05 and ##p < 0.001 versus Mx1-Cre+ controls.
Figure 3.
Figure 3.. ABCA1 Mutants Support Tet2-Deficient HSPC Expansion and Myeloid Lineage Commitment and Spreads CMML-like Disease in Serial BM Transplantation
(A and B) Quantification of hematopoietic stem (A) and progenitor (B) cells in the BM of recipient mice transplanted with control or Mx1-Cre+Tet2fl/fl BM expressing empty, ABCA1-WT, or ABCA1 mutants. Lineage(Lin) Sca1c-Kit+ LSK cells are hematopoietic stem and progenitor cells (HSPCs); Lin_Sca1 c-Kit+CD34hiFcγRhi are granulocyte-monocyte progenitors (GMPs); and LinSca1c-Kit+CD34hiFcγRlow are common myeloid progenitors (CMPs). The results are the means ± SEMs of 5–9 animals per group. (C and D) The quantification of hematopoietic progenitors (C) and myeloid cells (D) in BM cultures isolated from Mx1-Cre+Tet2fl/fl BM expressing empty, ABCA1-WT, or ABCA1 mutants and grown ex vivo for 72 h in liquid culture in the presence or absence of 6 ng/mL IL-3 and 2 ng/mL GM-CSF. The results are the means ± SEMs of experiments performed in triplicate. (E) Experimental overview. BM from WT and ABCA1 mutant-transduced animals on aTet2-deficient background were serially transplanted into lethally irradiated WT mice and analyzed 7 weeks later. (F) Quantification of the percentage of peripheral blood CD11bhi,Gr-1hi myeloid cells was determined by flow cytometry at the end of the study period. The results are means ± SEMs. *p < 0.05 versus empty control transduced animals on a Tet2-deficient background. §p < 0.05 versus ABCA1-WT. #p < 0.05 and ##p < 0.001 versus Mx1-Cre+ controls.
Figure 4.
Figure 4.. ABCA1 Invalidation Propagates Myelopoiesis and Accelerates Extramedullary Hematopoiesis on a Tet2-Deficient Background
(A) Experimental overview. BM from Mx1-Cre+, Mx1-Cre+Abca1fl/fl, Mx1-Cre+Tet2fl/fl, and Mx1-Cre+Tet2,l/flAbca1fl/,fl mice were transplanted into lethally irradiated WT mice, and after a 5-week recovery period, the mice were injected with poly(l:C) and analyzed over a 20-week period. (B) Modulation of Abca1 and Tet2 mRNA expression levels in the BM of the aforementioned mouse models. (C) Quantification of the percentage of peripheral blood myeloid cells determined by hematology cell counter over the course of 20 weeks after poly (I:C) injection in recipient mice transplanted with the BM from Mx1-Cre+, Mx1-Cre+Abca1fl/fl, Mx-Cre+Tet2fl/fl, and Mx1-Cre+Tetfl/fl Abca1fl/fl mice. (D) Peripheral blood myeloid subsets (CD115+Ly6Chi and CD115+Ly6Clo monocytes and CD115Ly6Chi neutrophils) were also quantified in these mice at the indicated time point (E) Representative H&E staining of paraffin-embedded spleen sections from these mice. Original magnification × 200. Arrows indicate extensive cellular infiltrate. (F and G) Quantification of spleen weight (F) and myeloid subsets (eosinophils, neutrophils, monocytes, and red pulp macrophages [RPMs] in the spleens (G) of recipient mice transplanted with the BM from Mx1-Cre+Abca1fl/fl, Mx1-Cre+Tet2, and Mx1-Cre+Tet2fl/fl Abca1fl/fl mice. (H and I) Quantification of hematopoietic stem (H) and progenitor (MEPs); LinSca1c-kit+CD34hiFcγRhi are GMP; and LinSca1c-kit+CD34hi FcγRlow are CMPs. The results are the mean ± SEMs of 5–7 animals per groups ND, not detectable. #p < 0.05 and ##p < 0.001 versus Mx1-Cre+ controls.
Figure 5.
Figure 5.. Cholesterol Accumulation Couples ABCA1 Invalidation and Tet2 Deficiency to IL-3 Receptor β Signaling Hypersensitivity
(A-D) Quantification of BODIPY staining by flow cytometry expressed as mean fluorescence intensity (MFI) as a surrogate of cellular cholesterol neutral lipid per cell (A-D) in BM hematopoietic stem (A and C) and progenitor (B and D) cells (i.e., LSKs, MEPs, CMPs, and GMPs) of recipient mice transplanted with Mx1-Cre+, Mx1-Cre+Abca1fl/fl, Mx1-Cre+Tet2fl/fl,and Mx1-Cre+Tet2fl/,lAbca1fl/fl BM (A and B) or control and Mx1-Cre+Tet2fl/fl BM expressing empty, ABCA1-WT, or ABCA1 mutants (C and D). Results are means ± SEMs of 5–9 animals per group. (E) mRNA expression of SREBP-2 and cholesterol biosynthesis target genes (Hmgcr, Mvk, Idi1, Sc4mol, and Dhcr24) from empty, WT, and ABCA1 mutant-transduced BM on a Tet2-deficient background isolated at the end of the study period. The expression of mRNA was normalized to m36B4. mRNA levels were expressed as percentage over WT whole BM cells. (F) Proliferation rates were determined after 2 h [3H]-thymidine pulse labeling in BM cells from empty, ABCA1-WT, and ABCA1 mutant-transduced animals on a Tet2-deficient background that were grown for 72 h in liquid culture in the presence or absence of 6 ng/mL IL-3 and 2 ng/mL GM-CSF and the indicated chemical compounds. Results are means ± SEMs of cultures from at least 3 independent mice. *p < 0.05 versus empty control-transduced animals on a Tet2-deficient background. §p < 0.05 versus ABCA1-WT. #p < 0.05 and ##p < 0.001 versus Mx1-Cre+ controls.
Figure 6.
Figure 6.. HDL Overcome Loss-of-Function ABCA1 Mutants and Limit the Myeloproliferative Disorder Induced by These Mutants in Tet2-Deficient Mice
(A) Proliferation rates were determined after 2 h [3H]-thymidine pulse labeling in BM cells from empty, ABCA1-WT, and ABCA1 mutant-transduced animals on a Tet2-deficient background that were grown for 72 h in liquid culture in the presence or absence of 50 (μg/mL polyethylene glycol (PEG)-HDL. (B) The quantification of BODIPY staining was determined by flow cytometry in these cells and expressed as the MFI. The results are means ± SEMs of cultures from at least 3 independent mice. (C and D) Levels of human apoA-1 (hApoA-1) (C) and plasma HDL-cholesterol levels (D) were determined in WT or apoA-1 transgenic recipient mice transplanted with Mx1-Cre+Tet2fl/fl BM transduced with lentiviral particles expressing ABCA1-WT or ABCA1 mutants or empty vector. (E and F) Peripheral blood CD11b+Grl+ myeloid subsets (E) and spleen weight (F) were quantified at the end of the study period (i.e., 7 weeks post-poly(l:C) injection that followed a 5-week recovery period post-BMT) in WT or apoA-1 transgenic recipient mice transplanted with Mx1-Cre+Tet2fl/fl BM transduced with lentiviral particles expressing ABCA1-WT or ABCA1 mutants or empty vector. Results are means ± SEMs of 4–5 animals per group. *p < 0.05 versus empty control-transduced animals on a Tet2-deficient background. §p < 0.05 versus ABCA1-WT. #p < 0.05 versus non-HDL-treated conditions or transduced animals on a non-ApoA1Tg background.

References

    1. Abdel-Wahab O, and Levine RL (2010). Metabolism and the leukemic stem cell. J. Exp. Med. 207, 677–680. - PMC - PubMed
    1. Boroughs LK, and DeBerardinis RJ (2015). Metabolic pathways promoting cancer cell survival and growth. Nat. Cell Biol. 17, 351–359. - PMC - PubMed
    1. Bovenga F, Sabbà C, and Moschetta A. (2015). Uncoupling nuclear receptor LXR and cholesterol metabolism in cancer. Cell Metab. 21, 517–526. - PubMed
    1. Bowman RL, and Levine RL (2017). TET2 in Normal and Malignant Hematopoiesis. Cold Spring Harb. Perspect. Med. 7, a026518. - PMC - PubMed
    1. Brown MS, and Goldstein JL (2009). Cholesterol feedback: from Schoen- heimer’s bottle to Scap’s MELADL. J. Lipid Res. 50 (Suppl), S15–S27. - PMC - PubMed

Publication types

MeSH terms

LinkOut - more resources