. 2020 Mar 10;30(10):3411-3423.e7.
doi: 10.1016/j.celrep.2020.02.049.

Transferrin Receptor Is a Specific Ferroptosis Marker

Affiliations

Transferrin Receptor Is a Specific Ferroptosis Marker

Huizhong Feng et al. Cell Rep. .

Abstract

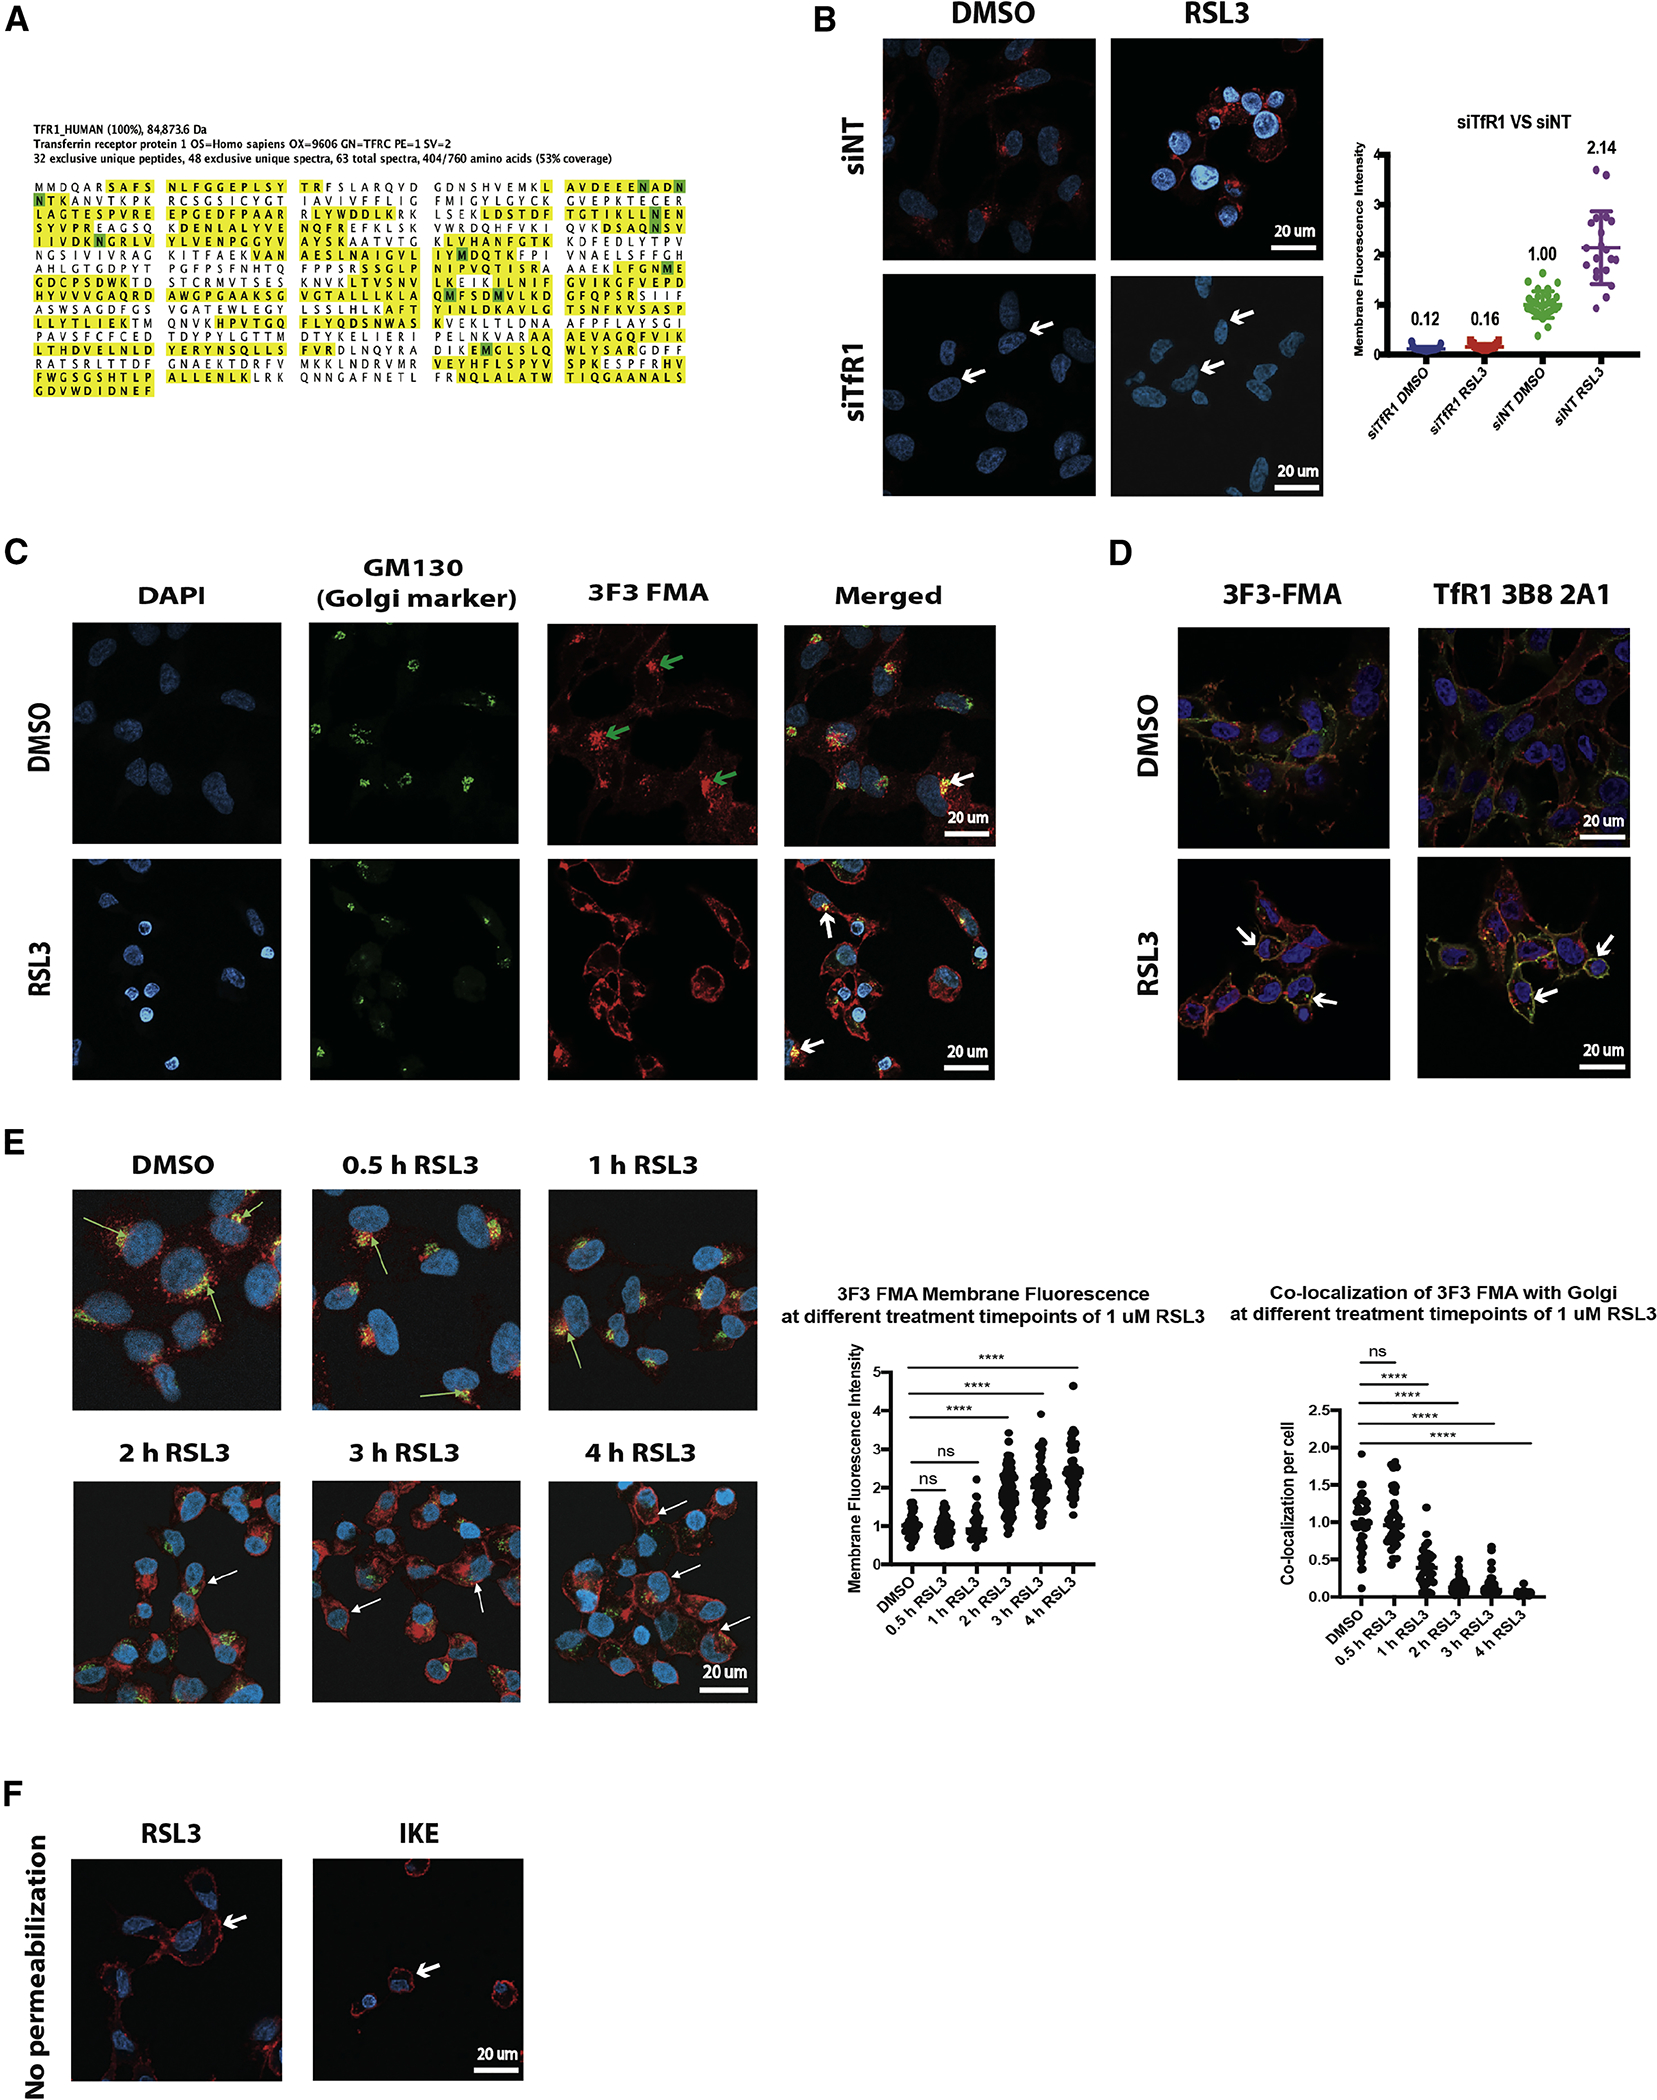
Ferroptosis is a type of regulated cell death driven by the iron-dependent accumulation of oxidized polyunsaturated fatty acid-containing phospholipids. There is no reliable way to selectively stain ferroptotic cells in tissue sections to characterize the extent of ferroptosis in animal models or patient samples. We address this gap by immunizing mice with membranes from lymphoma cells treated with the ferroptosis inducer piperazine erastin and screening ∼4,750 of the resulting monoclonal antibodies generated for their ability to selectively detect cells undergoing ferroptosis. We find that one antibody, 3F3 ferroptotic membrane antibody (3F3-FMA), is effective as a selective ferroptosis-staining reagent. The antigen of 3F3-FMA is identified as the human transferrin receptor 1 protein (TfR1). We validate this finding with several additional anti-TfR1 antibodies and compare them to other potential ferroptosis-detecting reagents. We find that anti-TfR1 and anti-malondialdehyde adduct antibodies are effective at staining ferroptotic tumor cells in multiple cell culture and tissue contexts.

Keywords: ROS; biomarker; cancer; cell death; ferroptosis; ferroptosis marker; ferroptosis-specific antibody; iron; tissue staining; transferrin receptor.


Conflict of interest statement

Declaration of Interests B.R.S. is a consultant to and has equity in Inzen Therapeutics. B.R.S. also is an inventor on patents and patent applications related to ferroptosis. C.E.Y. is currently an employee of Vertex Pharmaceuticals.

Figures

Figure 1.
Figure 1.. Screen of 672 Monoclonal Antibodies Generated by Infecting Mice with PE-Induced Membrane Fractions
(A) Cells were confirmed to be undergoing ferroptosis by using the fluorescent probe C11-BODIPY as a lipid ROS indicator. Blue represents DMSO-treated cells. Red represents PE-treated cells. (B) Western blot confirmation of plasma membrane and total membrane by organelle markers. The presence of plasma membrane was determined by anti-sodium potassium ATPase antibody, cytosol by anti-glyceraldehyde 3-phosphate dehydrogenase (GAPDH), ER by anti-PDI, and nuclei by anti-histone H3. (C) A flowchart illustrating the screen from ~4,750 unknown target antibodies to 3F3-FMA by flow cytometry, immunofluorescence, and high-content image analysis. (D) 3F3-FMA is shown as an example of cherry picking and high-content-analysis. There was an increased number of cells, which had >3 spots in cytoplasm in RSL3-induced ferroptosis. *p ≤ 0.05. Data plotted are mean ± SEM. See also Figure S1.
Figure 2.
Figure 2.. Identification of 3F3-FMA as a Ferroptosis Marker Using Various Cell Death Inducers and Different Cell Lines
(A) HT-1080 cells (human fibrosarcoma cells) were incubated with 1 μM RSL3 or 1 μM RSL3 + 5 μM Fer-1 for 4 h. 3F3-FMA showed a significantly different pattern upon RSL3-induced ferroptosis, but not with fer-1 co-treatment. Nuclei were stained with DAPI (blue). 3F3-FMA was stained with Alexa Fluor 594 (red). White arrows indicate the differences. The quantification of membrane intensities of 3F3-FMA is shown at right (DMSO n = 107; RSL3 n = 96; RSL3 + Fer-1 n = 123). ****p ≤ 0.0001, ns, p > 0.05 (one-way ANOVA). Data plotted are mean ± SEM. Each dot represents 1 cell. (B) HT-1080 cells (human fibrosarcoma cells) were incubated with 10 μM IKE for 8 h, 15 μM erastin for 8 h, 10 μM FIN56 for 8 h, 15 μM FINO2 for 8 h, and 100 μM tBuOOH for 8 h. 3F3-FMA showed a reproducible staining pattern upon IKE-induced, erastin-induced, FIN56-induced, FINO2-induced, and tBuOOH-induced ferroptosis. Nuclei were stained with DAPI (blue). 3F3-FMA was stained with Alexa Fluor 594 (red). White arrows indicate the differences. The quantification of membrane intensities of 3F3-FMA is shown at bottom (IKE n = 113 and 129; erastin n = 68 and 92; FIN56 n = 68 and 86; FINO2 n = 59 and 30; tBuOOH n = 73 and 49). ****p ≤ 0.0001 (2-tailed t test). Data plotted are mean ± SEM. Each dot represents 1 cell. (C) HT-1080 cells (human fibrosarcoma cells) were incubated with 1 μM staurosporine (STS) for 6 h and 2 μM camptothecin for 24 h. Cleaved caspase-3 antibody and cleaved PARP antibody were used to mark the induction of apoptosis. The staining pattern of 3F3-FMA during apoptosis was different from ferroptosis. Nuclei were stained with DAPI (blue). 3F3-FMA was stained with Alexa Fluor 594 (red). The quantification of membrane intensity of 3F3-FMA (DMSO n = 71; STS n = 53; DMSO n = 166; camptothecin n = 91) and overall intensity of cleaved caspase-3 (n = 7) and cleaved PARP (n = 7) is shown at right. *p ≤ 0.05, ***p ≤ 0.001. Data plotted are mean ± SEM. Each dot represents 1 cell. (D) A-673 cells, SK-BR-3 cells, Huh-7 cells, and SK-LMS-1 cells were incubated with 1 μM RSL3 for 4 h. The same pattern as with 3F3-FMA was observed. Nuclei were stained with DAPI (blue). 3F3-FMA was stained with Alexa Fluor 594 (red). White arrows indicate the differences. The quantification of membrane intensities of 3F3-FMA is shown at right (A-673 n = 70 and 16; SK-BR-3 n = 65 and 33; Huh-7 n = 63 and 61; SK-LMS-1 n = 149 and 139). ****p ≤ 0.0001 (2-tailed t test). Data plotted are mean ± SEM. Each dot represents 1 cell. See also Figure S2.
Figure 3.
Figure 3.. The Target of 3F3-FMA Is TfR1, Which Is Located in the Golgi and the Plasma Membrane
(A) IP-mass spectrometry (MS) result of human TfR1 sequence. Yellow represents the identified sequences. Green indicates modified amino acids (M, oxidation of methionine; N, deamination of asparagine). The sequence coverage was 53%. (B) siTfR1 or siNT 10 μM were combined with lipofectamine RNAiMAX in Opti-Mem media for 48 h. Then, HT-1080 cells were re-seeded in regular medium for an additional 24 h. Cells were incubated with 1 μM RSL3 for 4 h and then were fixed, permeabilized, and stained for DAPI (nuclei, blue) and 3F3-FMA (red). No 3F3-FMA was detected upon siRNA knockdown of transferrin receptor. siNT was used as a control. The white arrows indicate absence. (C) HT-1080 cells were incubated with 1 μM RSL3 for 4 h and then were fixed, permeabilized, and stained with DAPI (nuclei, blue), GM130 (Golgi, green), and 3F3-FMA. 3F3-FMA co-localized with the Golgi complex. The white arrows indicate overlap. The green arrows indicate the bright dots of 3F3-FMA in normal conditions. (D) HT-1080 cells were incubated with 1 μM RSL3 for 4 h and then were fixed and stained with DAPI (nuclei, blue), WGA (plasma membrane, red), and 3F3-FMA or TfR1 3B8 2A1 (green). 3F3-FMA and TfR1 3B8 2A1 co-localized with the plasma membrane during RSL3-induced ferroptosis. The white arrows indicate the overlap. (E) HT-1080 cells were incubated with 1 μM RSL3 for 4 h and collected at 0-, 0.5-, 1-, 2-, 3-, and 4-h time points. Cells were then fixed, permeabilized, and stained with DAPI (nuclei, blue), GM130 (Golgi, green), and 3F3-FMA. The white arrows indicate the accumulation of TfR1 in the plasma membrane, while the green arrows indicate the overlap area with the Golgi region. More membrane-located TfR1 and less Golgi-region-located TfR1 were observed. The quantification of membrane intensities of 3F3-FMA and co-localization of the Golgi marker GM130 and 3F3-FMA are shown at bottom. ****p ≤ 0.0001; ns, p > 0.05 (2-tailed t test). Data plotted are mean ± SEM. Each dot represents 1 cell. (F) HT-1080 cells were incubated with 1 μM RSL3 for 4 h or 5 μM IKE for 18 h and then were fixed and stained with DAPI (nuclei, blue) and 3F3-FMA (red). Without permeabilization, 3F3-FMA stained the cell surface clearly for cells undergoing ferroptosis. The white arrows indicate the boundaries. See also Figure S3.
Figure 4.
Figure 4.. 3F3-FMA, Anti-TfR1 3B8 2A1, Anti-TfR1 H68.4, Anti-MDA 1F83, and Anti-4-HNE Antibodies Can Be Used as Ferroptosis Markers by Immunofluorescence
(A) HT-1080 cells were incubated with 1 μM RSL3 for 4 h and then were fixed, permeabilized, and stained with DAPI (nuclei, blue), 3F3-FMA, anti-TfR1 3B8 2A1, or anti-TfR1 H68.4 antibodies (red). The white arrows indicate differences. The quantification of membrane intensities of anti-TfR1 antibodies is shown at bottom (3F3-FMA n = 107 and 96; TfR1 3B8 2A1 n = 32 and 9; TfR1 H68.4 n = 22 and 13). ****p ≤ 0.0001 (2-tailed t test). Data plotted are mean ± SEM. Each dot represents 1 cell. (B) HT-1080 cells were incubated with 1 μM RSL3 for 4 h and then were fixed, permeabilized, and stained with DAPI (nuclei, blue), anti-MDA 1F83 antibody (red), and anti-4-HNE ab46545 antibodies (green). The white arrows indicate differences. The quantification of membrane intensities of the antibodies is shown at bottom (MDA 1F83 n = 35 and 73; 4-HNE ab46545 n = 33 and 26). ****p ≤ 0.0001 (2-tailed t test). Data plotted are mean ± SEM. Each dot represents 1 cell. (C) HT-1080 cells were incubated with 1 μM STS for 6 h and then were fixed, permeabilized, and stained with DAPI (nuclei, blue), 3F3-FMA (red), anti-TfR1 3B8 2A1 (red), anti-TfR1 H68.4 (red), anti-MDA 1F83 (red), and anti-4-HNE ab46545 antibodies (green). The white arrows indicate the stain outside intact cells. The quantification of membrane intensities of the antibodies is shown at bottom (3F3-FMA n = 71 and 53; TfR1 3B8 2A1 n = 103 and 63; TfR1 H68.4 n = 93 and 80; MDA 1F83 n = 81 and 71; 4-HNE ab46545 n = 56 and 69). ns, p > 0.05 (2-tailed t test). Data plotted are mean ± SEM. Each dot represents 1 cell. See also Figure S4.
Figure 5.
Figure 5.. Anti-TfR1, Anti-MDA, and Anti-4-HNE Antibodies Were Effective in Flow Cytometry Applications, While 3F3-FMA and TfR1 H68.4 Antibodies Were Effective in Western Blot Applications
(A) HT-1080 cells were treated with DMSO or 1 μM RSL3 for 4 h. Cells were then harvested and stained with 1st and 2nd antibodies or C11-BODIPY without permeabilization. Approximately 15,000 cells were recorded and gated. RSL3-treated cells had increased intensities for 3F3-FMA, TfR1 3B8 2A1, TfR1 H68.4, MDA 1F83, MDA ab6463, and 4-HNE ab46545. C11-BODIPY, a probe for lipid peroxidation was used as a metric. (B) HT-1080 cells were treated with DMSO or 1 μM STS for 6 h. Cells were then harvested and stained with 1st and 2nd antibodies without permeabilization. Approximately 50,000 cells were recorded and gated. STS-treated cells had decreased intensities of 3F3-FMA staining. (C) HT-1080 cells were treated with 1 μM RSL3 for 2 h and 10 μM IKE for 4 h. Cells were collected at multiple time points, as shown. Cells were then lysed, stained with 1st and 2nd antibodies, and detected using western blot. 3F3-FMA and TfR1 H68.4 were used as TfR1 antibodies. An increased amount of TfR1 protein was observed during ferroptosis. GAPDH was used as a control. (D) HT-1080 cells were treated with 1 μM RSL3 or 10 μM IKE for 8 h. cDNAs were generated from total RNA collected and purified from cells. Two sets of TfR1 primers were used to quantify the amount of cellular TfR1 transcripts. CHAC1 was used as a positive control. The level of TfR1 mRNAs did not increase during ferroptosis. Blotting of TfR1 proteins using TfR1 H68.4 antibody is shown side by side. RSL3-treated western blot, 4 and 8 h, were not harvested due to an insufficient number of viable cells.
Figure 6.
Figure 6.. Comparison of TfR1 Antibodies and Other Potential Ferroptosis-Staining Reagents in Mouse Xenograft Tumor Tissue Samples
(A) An illustration of the preparation of the mouse xenograft tumor and IKE dose. (B) B cell lymphoma tumor tissues were fixed in 4% paraformaldehyde (PFA) for 24 h, perfused in 30% sucrose for 24 h, and stained with 1st and 2nd antibodies. Anti-TfR1 3B8 2A1, anti-TfR1 H68.4, and anti-MDA 1F83 showed a significant difference in intensities between vehicle and IKE treatments, 3F3-FMA showed no difference, and anti-MDA ab6463 and anti-4-HNE ab46545 showed slight differences. Controls without primary antibody staining are shown at right. The quantification of overall intensity of the antibodies is shown at bottom (n = 7). ****p ≤ 0.0001, ***p ≤ 0.001, **p ≤ 0.01, *p ≤ 0.05, and ns, p > 0.05 (2-tailed t test). Data plotted are mean ± SEM. Each dot represents 1 image. (C) HCC tumor tissues was fixed in 4% PFA for 24 h, perfused in 30% sucrose for 24 h, and stained with 1st and 2nd antibodies. 3F3-FMA, anti-TfR1 3B8 2A1, and anti-MDA 1F83 showed differences in intensities between vehicle and IKE groups, while other antibodies did not. Controls without primary antibody staining are shown at right. The quantification of overall intensity of the antibodies is shown at bottom (n = 7). ****p ≤ 0.0001, **p ≤ 0.01, and ns, p > 0.05 (2-tailed t test). Data plotted are mean ± SEM. Each dot represents 1 image. See also Figure S6.

References

    1. Aisen P (2004). Transferrin receptor 1. Int. J. Biochem. Cell Biol 36, 2137–2143. - PubMed
    1. Alkan SS (2004). Monoclonal antibodies: the story of a discovery that revolutionized science and medicine. Nat. Rev. Immunol 4, 153–156. - PubMed
    1. Carpenter AE, Jones TR, Lamprecht MR, Clarke C, Kang IH, Friman O, Guertin DA, Chang JH, Lindquist RA, Moffat J, et al. (2006). CellProfiler: image analysis software for identifying and quantifying cell phenotypes. Genome Biol. 7, R100. - PMC - PubMed
    1. Cox J, and Mann M (2008). MaxQuant enables high peptide identification rates, individualized p.p.b.-range mass accuracies and proteome-wide protein quantification. Nat. Biotechnol 26, 1367–1372. - PubMed
    1. Cox J, Neuhauser N, Michalski A, Scheltema RA, Olsen JV, and Mann M (2011). Andromeda: a peptide search engine integrated into the MaxQuant environment. J. Proteome Res 10, 1794–1805. - PubMed

Publication types