. 2020 Mar 10;30(10):3520-3535.e7.
doi: 10.1016/j.celrep.2020.02.026.

Neuronal BIN1 Regulates Presynaptic Neurotransmitter Release and Memory Consolidation

Affiliations

Neuronal BIN1 Regulates Presynaptic Neurotransmitter Release and Memory Consolidation

Pierre De Rossi et al. Cell Rep. .

Abstract

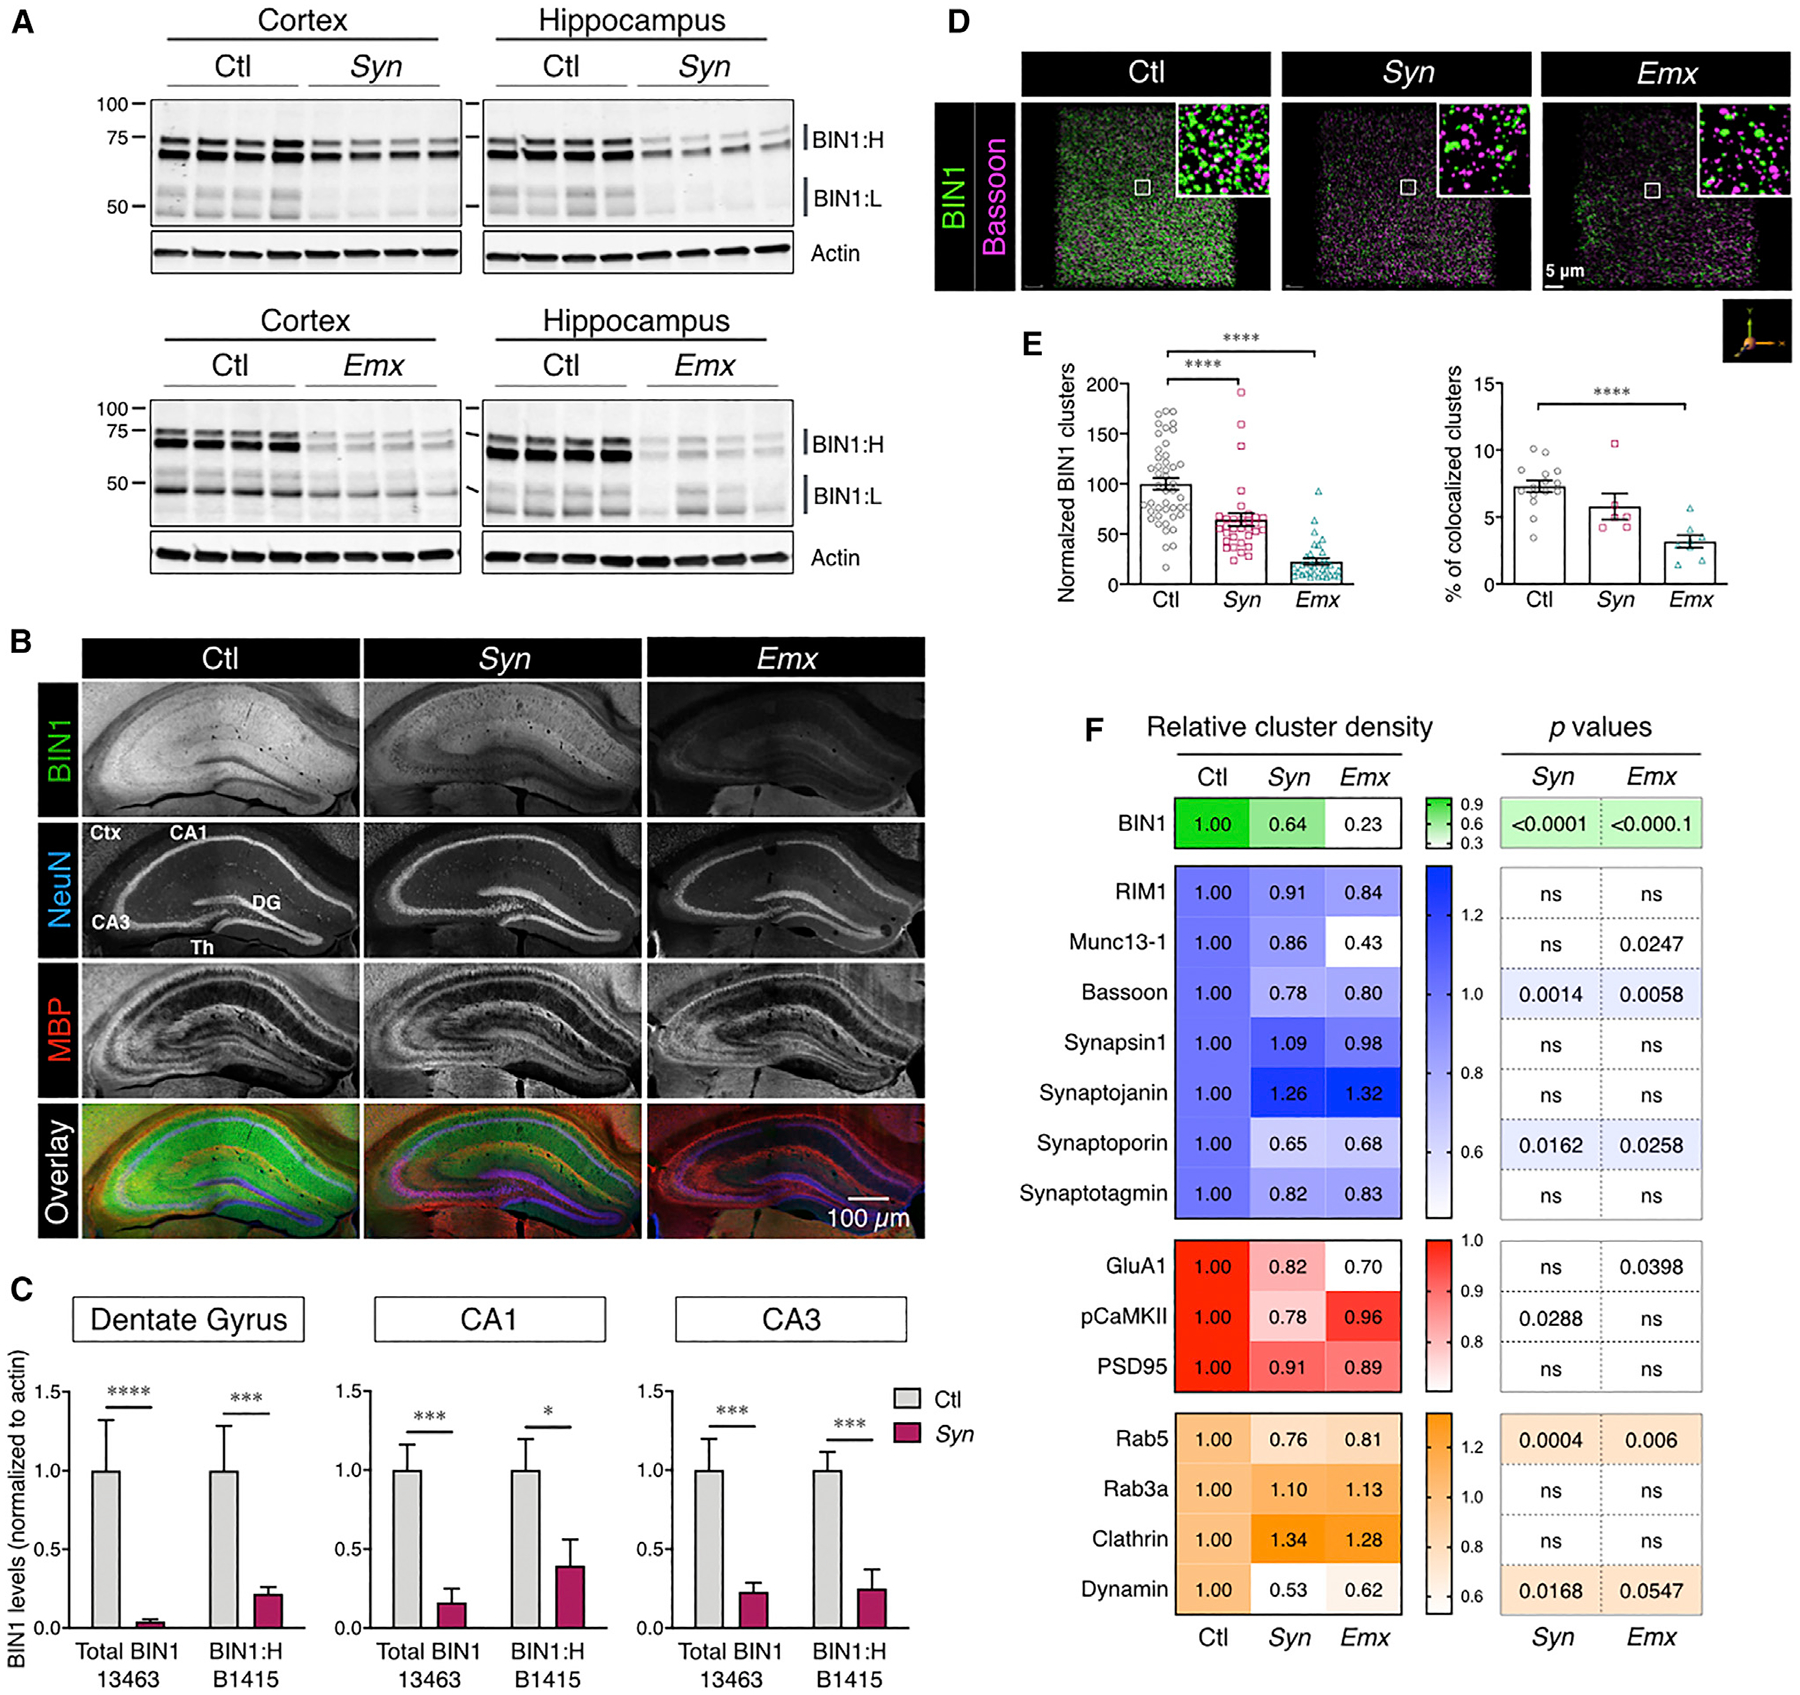
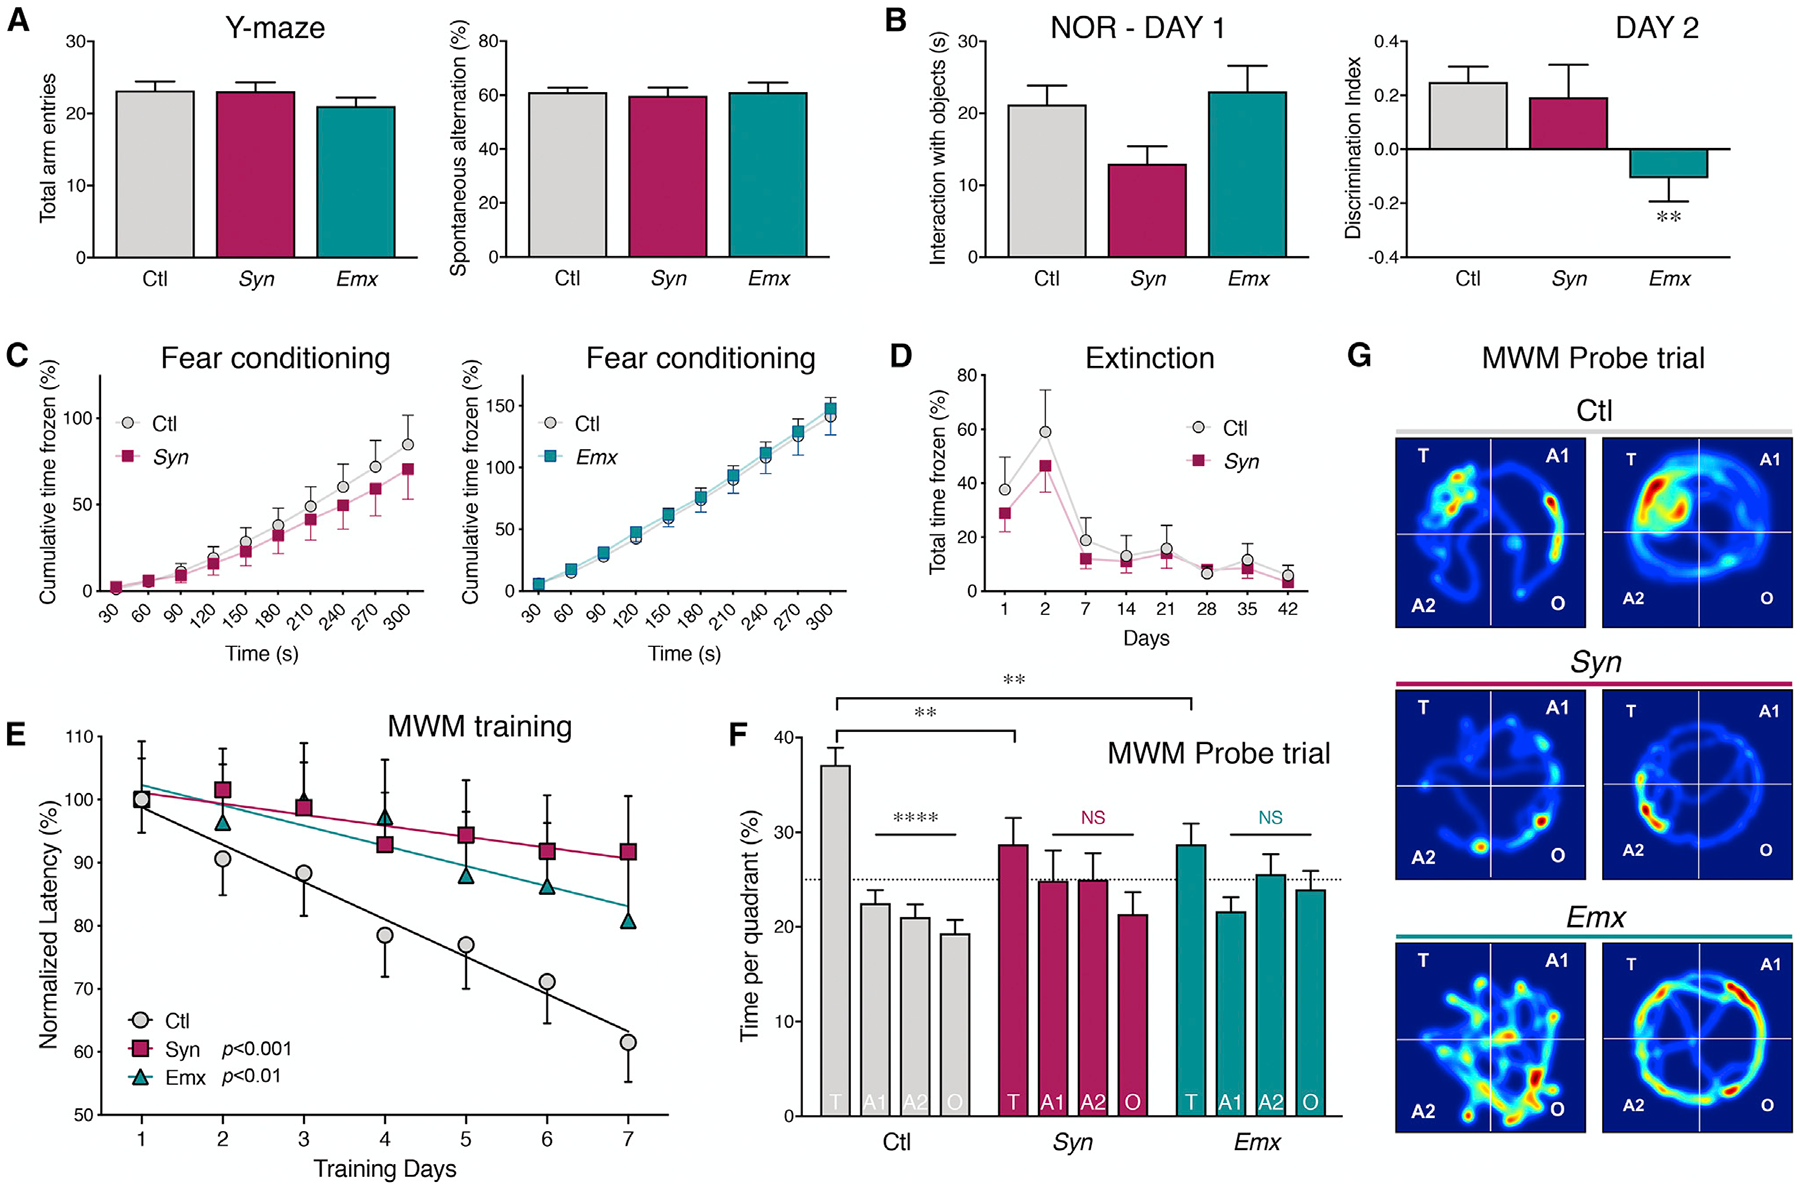
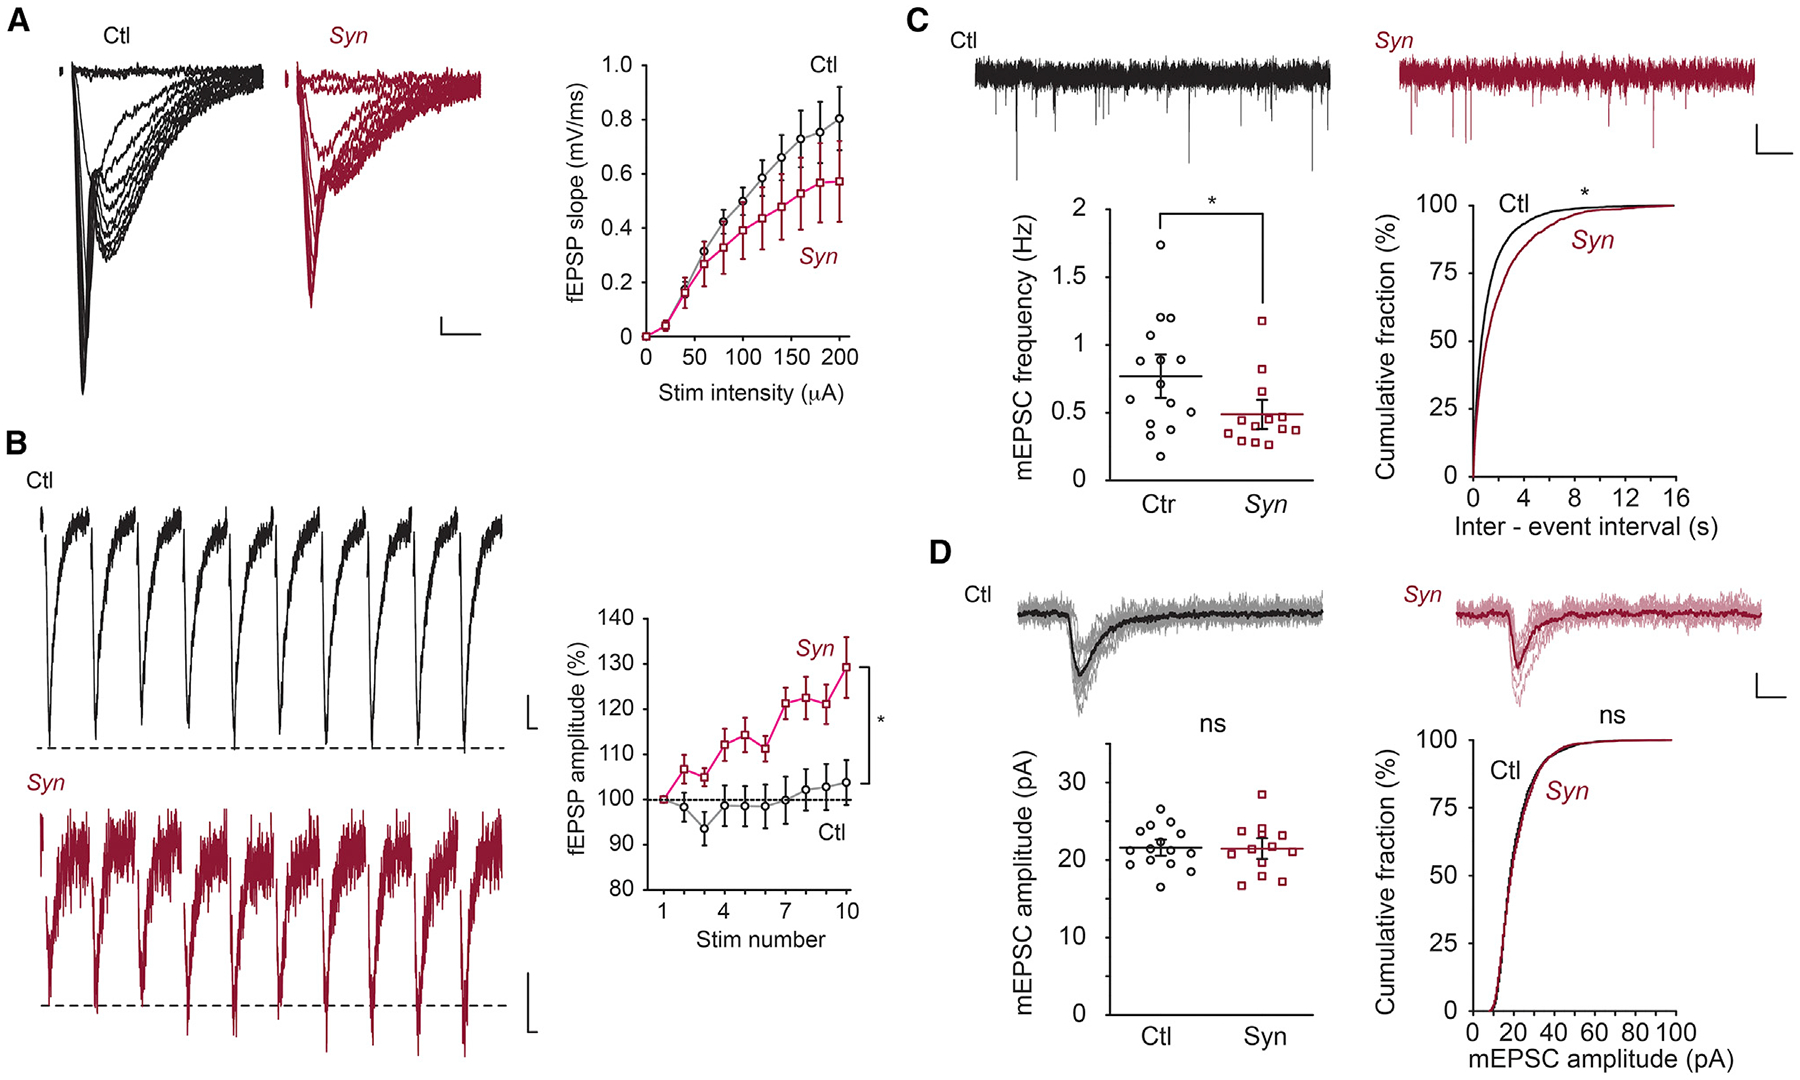
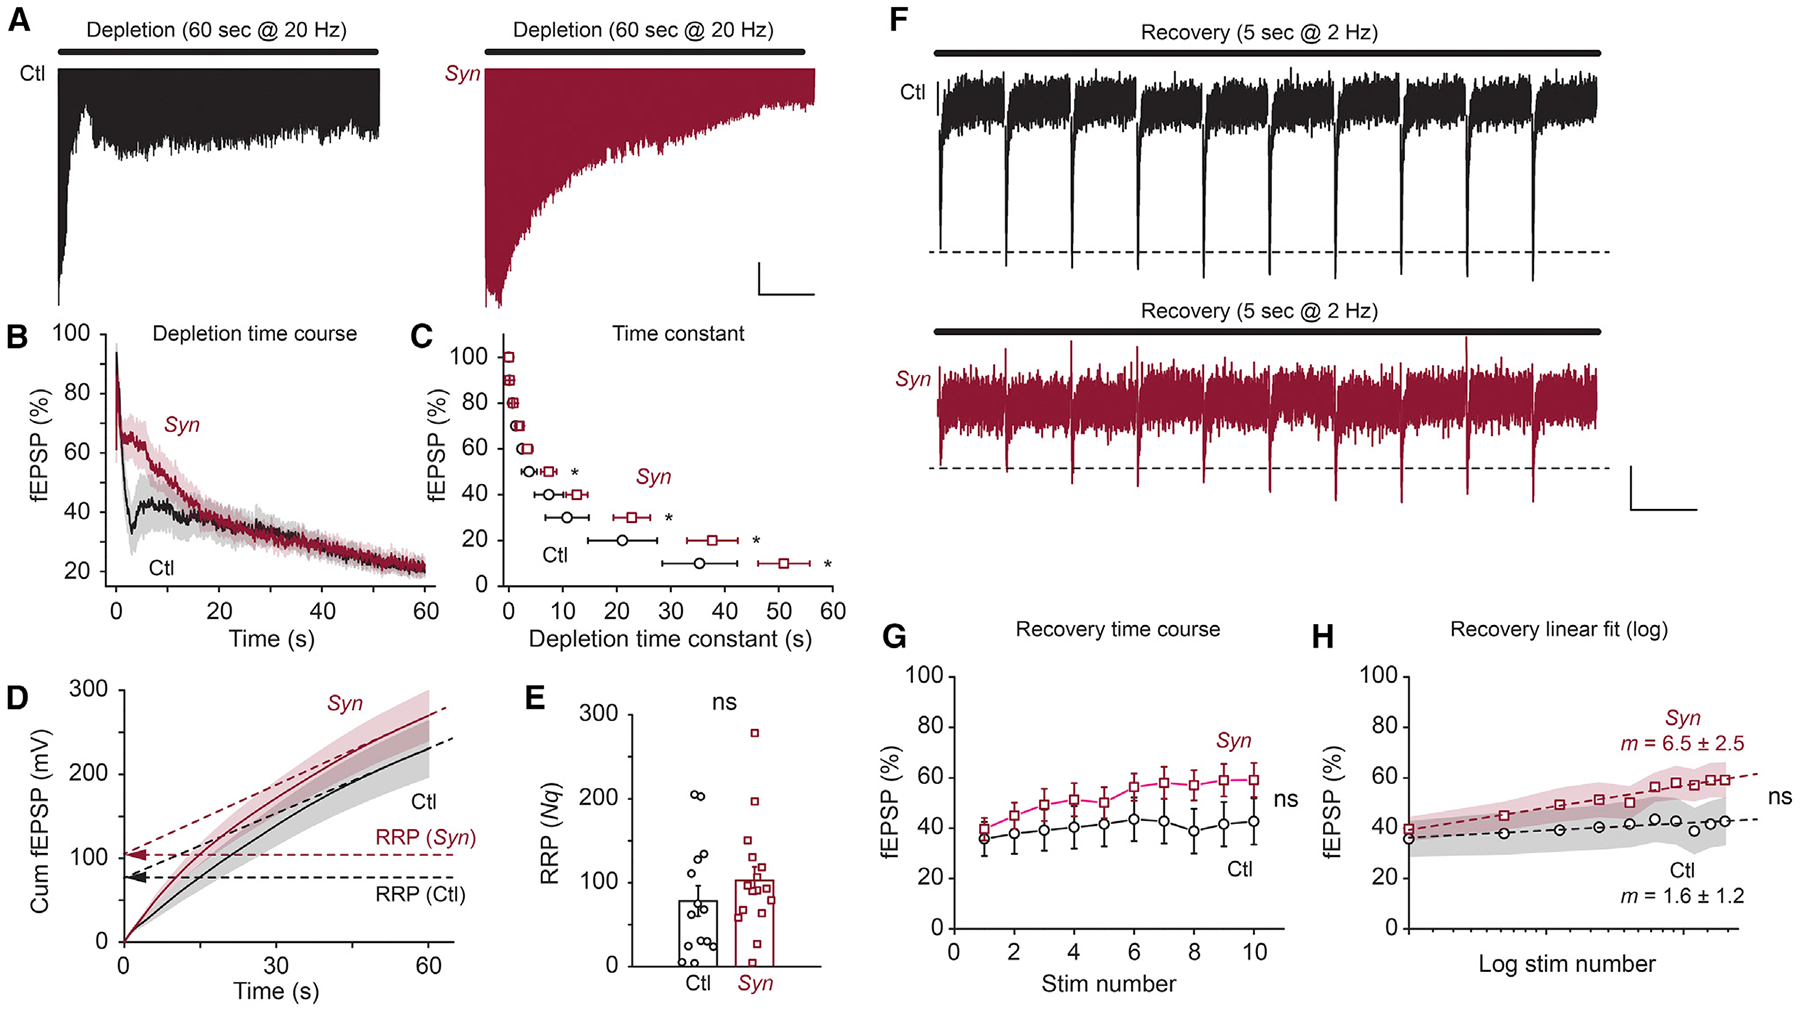
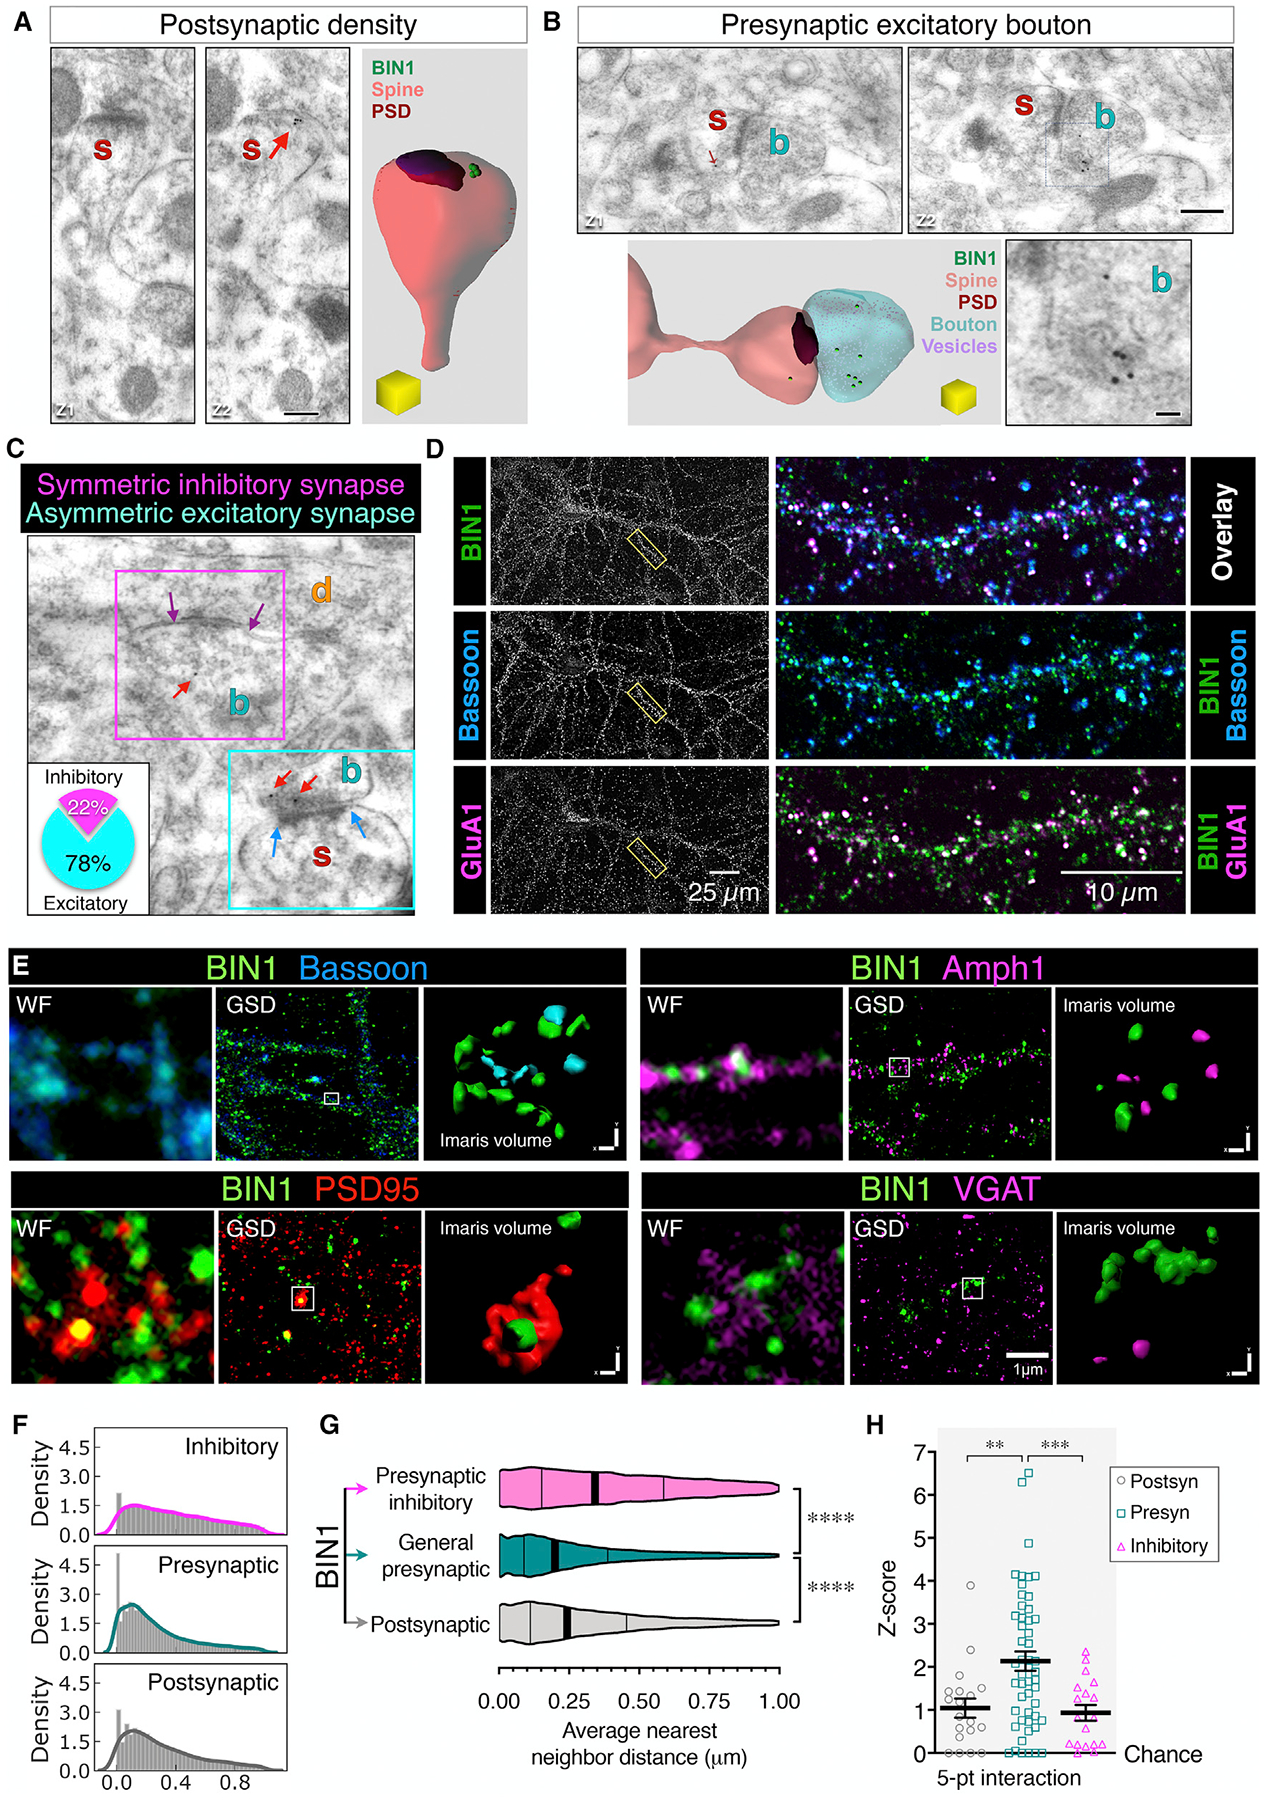
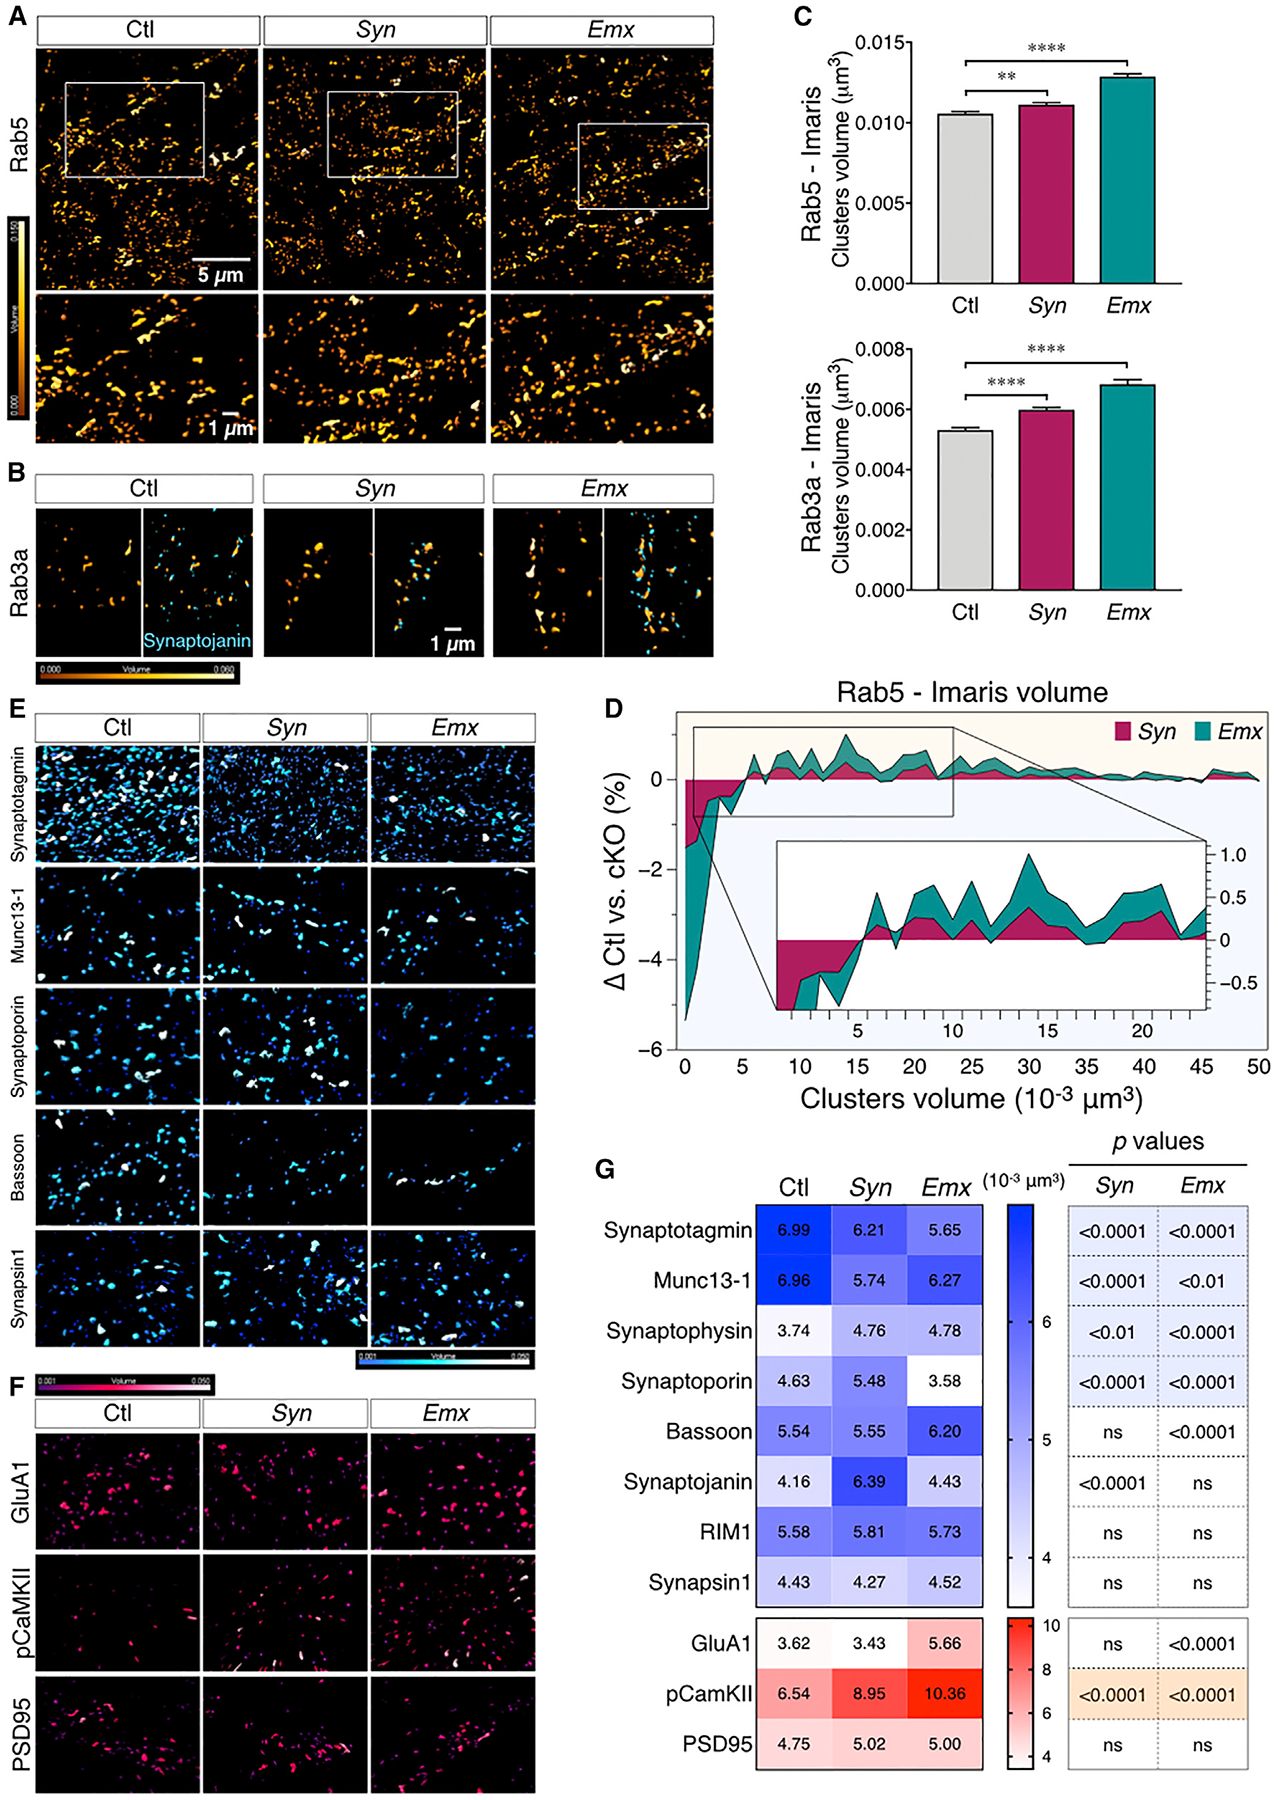
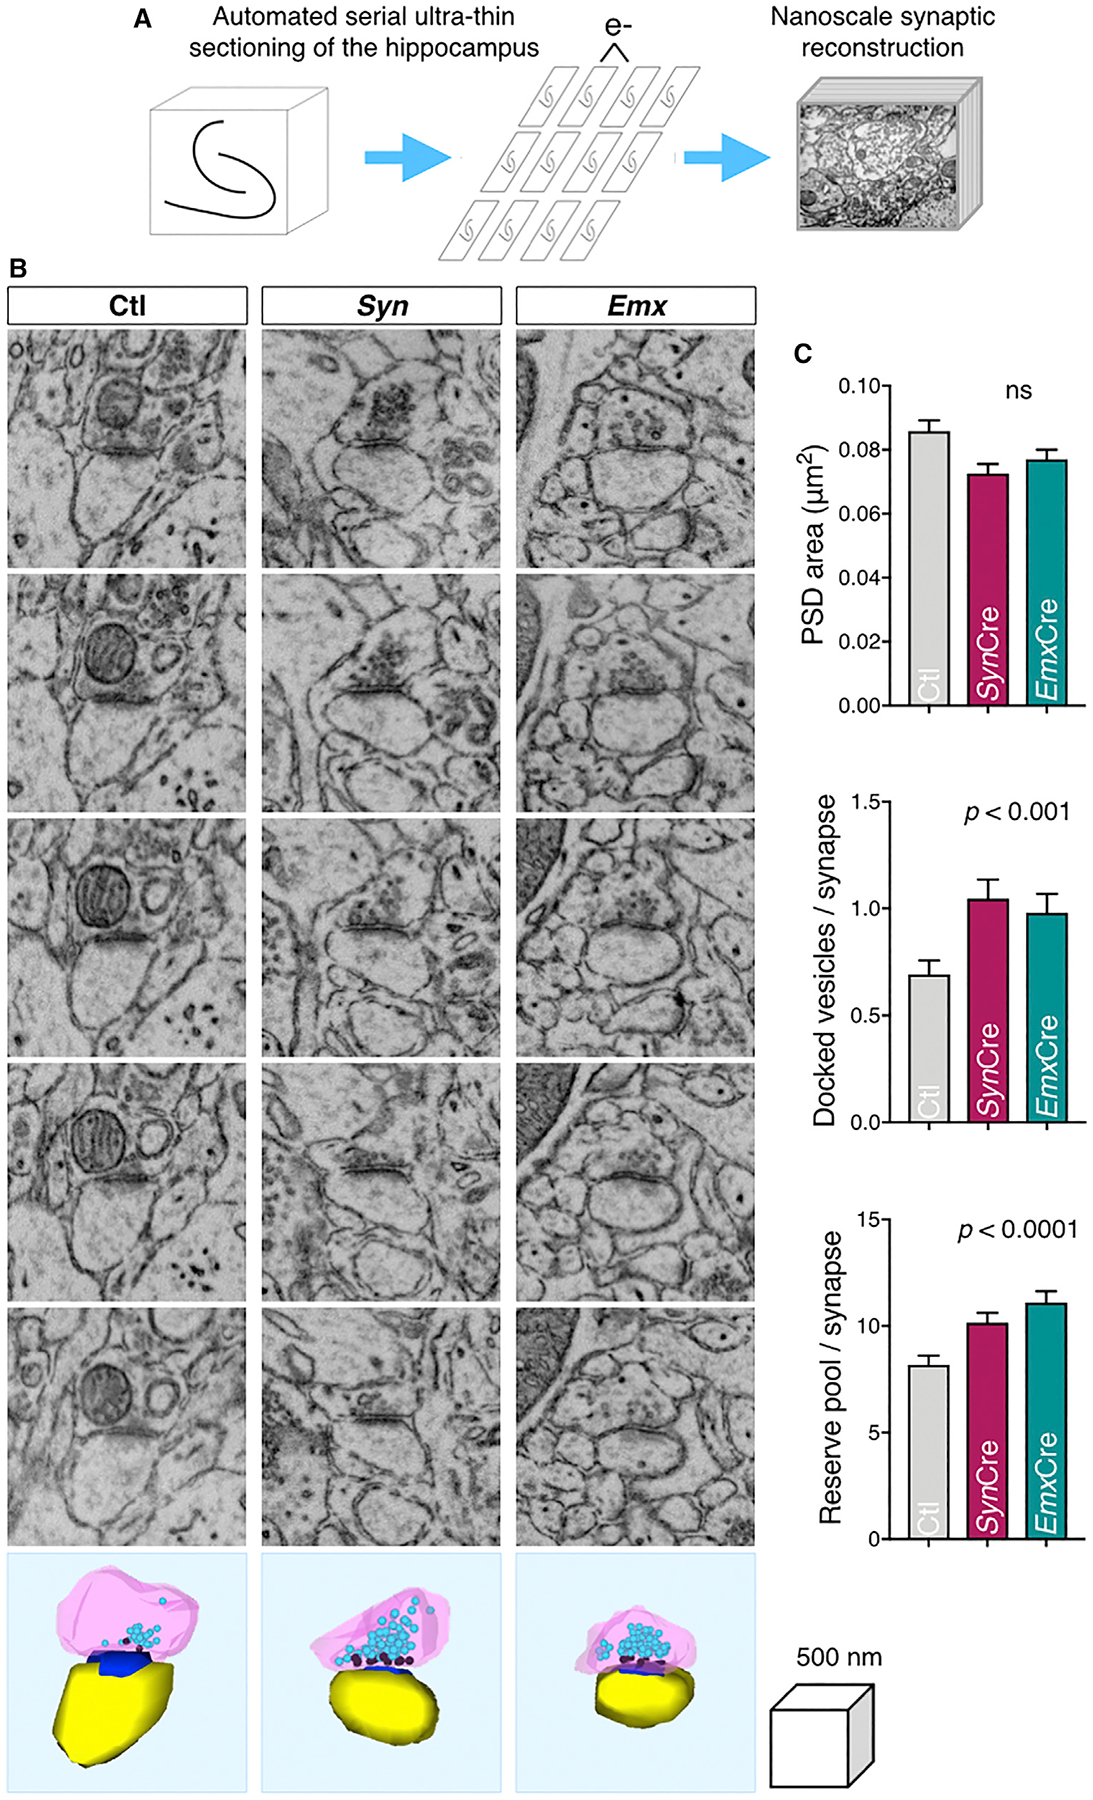
BIN1, a member of the BAR adaptor protein family, is a significant late-onset Alzheimer disease risk factor. Here, we investigate BIN1 function in the brain using conditional knockout (cKO) models. Loss of neuronal Bin1 expression results in the select impairment of spatial learning and memory. Examination of hippocampal CA1 excitatory synapses reveals a deficit in presynaptic release probability and slower depletion of neurotransmitters during repetitive stimulation, suggesting altered vesicle dynamics in Bin1 cKO mice. Super-resolution and immunoelectron microscopy localizes BIN1 to presynaptic sites in excitatory synapses. Bin1 cKO significantly reduces synapse density and alters presynaptic active zone protein cluster formation. Finally, 3D electron microscopy reconstruction analysis uncovers a significant increase in docked and reserve pools of synaptic vesicles at hippocampal synapses in Bin1 cKO mice. Our results demonstrate a non-redundant role for BIN1 in presynaptic regulation, thus providing significant insights into the fundamental function of BIN1 in synaptic physiology relevant to Alzheimer disease.

Keywords: 3D EM reconstruction; Amphiphysin 2; BIN1; Morris water maze; STED; dSTORM; late-onset Alzheimer disease; release probability; super-resolution; synaptic physiology.


Conflict of interest statement

Declaration of Interests The authors declare no competing interests.

Figures

Figure 1.
Figure 1.. Loss of Neuronal BIN1 Expression in cKO Mice
(A) Immunoblot analysis of BIN1 levels in the cortex and hippocampus of BIN1 cKO mice (polyclonal antibody [pAb] 14647). (B) Confocal microscopy analysis of neuronal BIN1 expression in control (Ctl) and cKO (Syn and Emx) mice (mAb 13463; no epitope retrieval). Adjacent image panels acquired using a 10× objective were stitched together for the visualization of the entire hippocampus. Scale bar: 200 μm. (C) Analysis of the diminution of BIN1 expression in the micro-dissected areas of the hippocampus of cKO mice. The means ± SEMs are plotted in each graph. *p < 0.05, **p < 0.01, ***p < 0.001, and ****p < 0.0001. (D) Decreased presynaptic marker density in neuronal Bin1 cKO mice. Masks of BIN1 and Bassoon immunostaining in confocal images (see Method Details) were used to quantify synaptic marker densities from a block of 50 z stack images representing a depth of ~25 μm (96,193 mm3 volume). (E) Decrease in BIN1 cluster density (left) in cKO mice (ANOVA: F(2, 107) = 50.7, p < 0.0001; Fisher’s LSD post hoc test: Ctl versus Syn and Ctl versus Emx p < 0.0001). Decrease of and BIN1-Bassoon colocalization, normalized to Bassoon cluster density (right) in Emx mice (ANOVA: F(2, 26) = 14.18, p < 0.0001; Fisher’s LSD post hoc test: Ctl versus Syn p = 0.0907 and Ctl versus Emx p < 0.0001). (F) Heatmap representing mean changes in the density of different presynaptic markers (blue), postsynaptic markers (red), and presynaptic endocytic vesicle markers (orange). See also Figures S1, S2, and S7 and Tables S1 and S2.
Figure 2.
Figure 2.. Loss of Neuronal BIN1 Expression Impairs Spatial Learning and Memory
Neuronal cKO mice, 6 to 10 weeks old, and their littermate Ctl were subject to multiple behavioral tests. (A) Y-maze test shows no significant difference between the groups in the number of arm entries (left) or spontaneous alternation behavior (ANOVA F(2, 78) = 0.07933, p = 0.9238; n = 44 Ctl, 18 Syn, and 19 Emx mice) (right). (B) In the novel object recognition test, no significant difference between groups was observed during the interaction with the objects on day 1 (ANOVA: F(2, 101) = 2.419, p = 0.0942; n = 56 Ctl, 23 Syn, and 25 Emx mice). The discrimination index is plotted at right. ANOVA (F(2, 97) = 5.560, p = 0.0052; n = 56 Ctl, 19 Syn, and 25 Emx mice) showed no significant difference between Ctl and Syn (Fisher’s LSD post hoc test, p = 0.6411) and a significant difference between Ctl and Emx (Fisher’s LSD post hoc test, p = 0.0014). (C) Contextual fear conditioning test shows no difference between cKO mice and their respective littermate Ctl in the cumulative time frozen (Ctl versus Syn: t27 = 0.5876, p = 0.5617, n = 15 Ctl and 14 Syn mice; Ctl versus Emx: t32 = 0.2483, p = 0.8055, n = 21 Ctl and 13 Emx mice; two-tailed Student’s t test). (D) No statistical difference was observed in fear conditioning extinction between Syn mice and their littermate Ctl (Ctl versus Syn p > 0.24 at all times; n = 19 Ctl and 18 Syn mice; multiple t test analysis). (E) Morris water maze test shows spatial learning defects in Bin1 cKO mice performance over the 7 days of training. There was a significant effect of genotype on the rate of learning (raw latency to find the platform; [F(2, 107) = 19.501, p < 0.0005]; n = 54 Ctl, 28 Syn, and 27 Emx mice). The performance of Ctl mice significantly improved during training as compared with Syn (p < 0.0005) and Emx mice (p = 0.004). (F) In the probe trial, Bin1 cKO mice spent significantly less time in the target quadrant as compared with Ctl mice (F(2, 105) = 5.497, p = 0.0054). The percentage of time spent in each quadrant is plotted. T, target; A1 and A2, adjacent; O, opposite quadrant. ANOVA analysis (F(6, 424) = 2.930, p = 0.0082); post hoc Tukey’s multiple comparisons for Ctl mice: T versus A1, p < 0.0001; T versus A2, p < 0.0001; T versus O, p < 0.0001; no significant difference between the quadrants was recorded for Syn and Emx mice. (G) Representative heatmaps of average search during the probe trial for Ctl and cKO groups. See also Figure S3.
Figure 3.
Figure 3.. Bin1 Deletion Causes an Altered Presynaptic Function
(A) I/O curve of fEPSPs. Representative fEPSP traces (left) and grouped data for average slope (right) in WT (Ctl) and Bin1 cKO (Syn) mice. There is a significant interaction between stimulation intensity and genotype; p < 0.0005. Calibration: 10 ms, 0.1 mV. (B) Short-term plasticity (1 Hz). Representative fEPSP traces (left) and grouped data (right) in Ctl and Syn mice. Calibration: 10 ms, 0.1 mV. (C) mEPSC frequency. Representative mEPSC traces (top) and group data for average frequency (bottom left) and cumulative plot of the interspike interval (bottom right) in Ctl and Syn mice. Calibration: 2 s, 10 pA. (D) mEPSC amplitude. Representative individual mEPSC traces. Ten representative events and the averaged trace were presented as lighter and darker lines, respectively (top). Grouped data for average amplitude (bottom left) and cumulative plot of amplitude (bottom right) in Ctl and Syn mice. Calibration: 10 ms, 10 pA; 15–18 slices from 4 Ctl mice and 13–18 slices from 4 Syn mice were used; ns p ≥ 0.05.
Figure 4.
Figure 4.. Bin1 Deletion Causes Altered Depression of the EPSP during Sustained Synaptic Trains
(A) Representative fEPSP traces during the depletion paradigm (20 Hz stimuli for 60 s) in Bin1 WT (Ctl) and cKO (Syn) mice. Calibration: 10 s, 0.1 mV. (B) Grouped data for fEPSP depletion time course in Ctl and cKO mice. (C) Grouped data for fEPSP depletion time constants for 90%–10% of the peak in Ctl and cKO mice. (D) Grouped data for cumulative fEPSP amplitude during the depletion paradigm in Ctl and cKO mice. RRP is estimated from the y axis intersect of the linear regression fit. (E) Grouped data for estimated RRP in Ctl and cKO mice. (F) Representative fEPSP traces during the recovery paradigm (2 Hz stimuli for 5 s) in Ctl and cKO mice. Calibration: 500 ms, 0.1 mV. (G) Grouped data for fEPSP recovery time course in Ctl and cKO mice. (H) Grouped data for fEPSP recovery time course in logarithm fit in Ctl and cKO mice. The slope (m) of the linear fit is presented in each genotype; 14 slices from 3 Ctl mice and 16 slices from 4 Syn mice were used; ns, p ≥ 0.05.
Figure 5.
Figure 5.. Investigation of BIN1 Synaptic Localization Using Immuno-EM and Ground-State Depletion (GSD) dSTORM Microscopy
(A–C) Representative images of BIN1 immuno-EM localization in the mouse hippocampal CA1 region, showing BIN1-associated gold particles in the postsynaptic (A), general presynaptic (B), and inhibitory synapses (C). The inset in (C) indicates that of all of the synapses with BIN1-immunogold particles, 78% were excitatory terminals. Scale bars: 250 nm; enlarged inset, 50 nm. (D) Representative confocal images of BIN1, Bassoon, and GluA1. Image overlays of the boxed region are shown at a higher magnification at right. (E) Representative images of BIN1 (green) and markers for postsynaptic sites (PSD95; red), presynaptic sites (Bassoon; blue), and inhibitory presynaptic sites (Amph1 and VGAT; magenta). For each marker, the widefield image (WF), the super-resolution image (GSD), and the Imaris volume view (used for nearest-neighbor calculation) of the identical region are displayed. (F) The density plot depicts the frequency of the distance between the BIN1 clusters and synaptic markers. The x axis indicates the binned DBSCAN average nearest-neighbor distance (microns) between BIN1 and synaptic markers. (G) Violin plot of the average distance between BIN1 and its nearest neighbor. ANOVA analysis (F(2, 80700) = 1,332, p < 0.0001); BIN1-to-marker mean distance: general presynaptic markers = 0.2708 ± 0.001 μm; postsynaptic markers = 0.308 ± 0.002 μm; and presynaptic inhibitory markers = 0.3849 ± 0.002 μm). The vertical lines indicate the median and quartiles. (H) DBSCAN analysis of randomization score to assess the specificity of BIN1 approximation to synaptic markers (5-point interaction; 50 points per cluster at 50-nm distance). The Z-score analysis showed a specific association of BIN1 with the synaptic markers; ANOVA analysis (F(8, 255) = 5.446, p < 0.0001). When the Z score equals 0, the association between BIN1 and the markers is not greater than a chance occurrence. See also Figures S4–S6 and Table S1.
Figure 6.
Figure 6.. Decrease in the Volume of SNARE-Regulating Proteins in cKO Mice
(A) Representative images of Rab5 cluster intensity-coded by volume size (Imaris). The boxed region is shown at higher magnification in the bottom panels. (B) Rab3a clusters (left, coded by volume size) and two-color images (intensity-coded by volume) depicting the close proximity of Rab3a clusters to synaptojanin (right). (C) Bar graphs representing the analysis of Rab5 and Rab3a cluster volumes in Ctl and cKO mice. ANOVA with Fisher’s LSD post hoc test revealed a significant increase in the cluster volume sizes for Rab5 (F(2, 47322) = 60.43, p < 0.0001, Ctl versus Syn p = 0.0018, Ctl versus Emx p < 0.0001) and Rab3a (F(2, 25397) = 50.55, p < 0.0001, Ctl versus Syn and Ctl versus Emx p < 0.0001). (D) Stacked area plot of the difference in Rab5 cluster-size frequency distribution between Ctl and cKO. The difference in distribution was calculated as [(number of Rab5 clusters/volume)Ctl (number of Rab5 clusters/volume)cKO], with a bin size of 0.001 μm3. For clarity, only the clusters ranging from 0.001 to 0.05 μm3 are shown in the plot. The inset shows an enlarged area of the plot. (E and F) Representative images of presynaptic (E, blue) and postsynaptic (F, red) protein clusters generated with Imaris and intensity-coded by volume (from 0.001 to 0.05 μm3). (G) Heatmap representation of the mean variation of presynaptic and postsynaptic protein cluster volumes. See also Figures S7 and S8 and Table S3.
Figure 7.
Figure 7.. Bin1 Deletion Increases Docked Neurotransmitter Vesicles and Reserve Pool but Does Not Affect Synapse Size
(A) Schematic representation of the tape-based pipeline for electron microscopic reconstruction of hippocampal synapses (Kasthuri et al., 2015). (B) Electron micrographs of serial sections through representative synapses are shown along with a 3D reconstruction of the dendritic spine head (yellow), the postsynaptic density (PSD; blue), and the presynaptic terminal (pink) containing docked neurotransmitter vesicles (dark pink) and the reserve pool of vesicles (aqua). (C) The PSD area was not significantly different among the three mouse genotypes, but the number of docked vesicles per synapse and the number of vesicles in the reserve pool was significantly higher among synapses in both cKO mouse strains as compared with Ctl by multivariate analysis of covariance. Multivariate analysis of variance (MANOVA) on PSD area: F(2, 436) = 0.001, p = 0.42; multivariate analysis of covariance (MANCOVA) on docked vesicles: F(2, 436) = 8.81, p = 0.0002; MANCOVA on reserve pool: F(2, 436) = 9.53, p = 0.00009. See also Figure S8.

References

    1. Andrew RJ, De Rossi P, Nguyen P, Kowalski HR, Recupero AJ, Guerbette T, Krause SV, Rice RC, Laury-Kleintop L, Wagner SL, and Thinakaran G (2019). Reduction of the expression of the late-onset Alzheimer’s disease (AD) risk-factor BIN1 does not affect amyloid pathology in an AD mouse model. J. Biol. Chem 294, 4477–4487. - PMC - PubMed
    1. Annamneedi A, Caliskan G, Müller S, Montag D, Budinger E, Angenstein F, Fejtova A, Tischmeyer W, Gundelfinger ED, and Stork O (2018). Ablation of the presynaptic organizer Bassoon in excitatory neurons retards dentate gyrus maturation and enhances learning performance. Brain Struct. Funct 223, 3423–3445. - PMC - PubMed
    1. Barthet G, Jordà-Siquier T, Rumi-Masante J, Bernadou F, Müller U, and Mulle C (2018). Presenilin-mediated cleavage of APP regulates synaptotagmin-7 and presynaptic plasticity. Nat. Commun 9, 4780. - PMC - PubMed
    1. Bungenberg J, Surano N, Grote A, Surges R, Pernhorst K, Hofmann A, Schoch S, Helmstaedter C, and Becker AJ (2016). Gene expression variance in hippocampal tissue of temporal lobe epilepsy patients corresponds to differential memory performance. Neurobiol. Dis 86, 121–130. - PubMed
    1. Calafate S, Flavin W, Verstreken P, and Moechars D (2016). Loss of Bin1 Promotes the Propagation of Tau Pathology. Cell Rep. 17, 931–940. - PubMed

Publication types

MeSH terms

LinkOut - more resources