. 2020 Mar 10;30(10):3583-3595.e5.
doi: 10.1016/j.celrep.2020.02.067.

Single-Cell Analysis of the Muscle Stem Cell Hierarchy Identifies Heterotypic Communication Signals Involved in Skeletal Muscle Regeneration

Affiliations

Single-Cell Analysis of the Muscle Stem Cell Hierarchy Identifies Heterotypic Communication Signals Involved in Skeletal Muscle Regeneration

Andrea J De Micheli et al. Cell Rep. .

Abstract

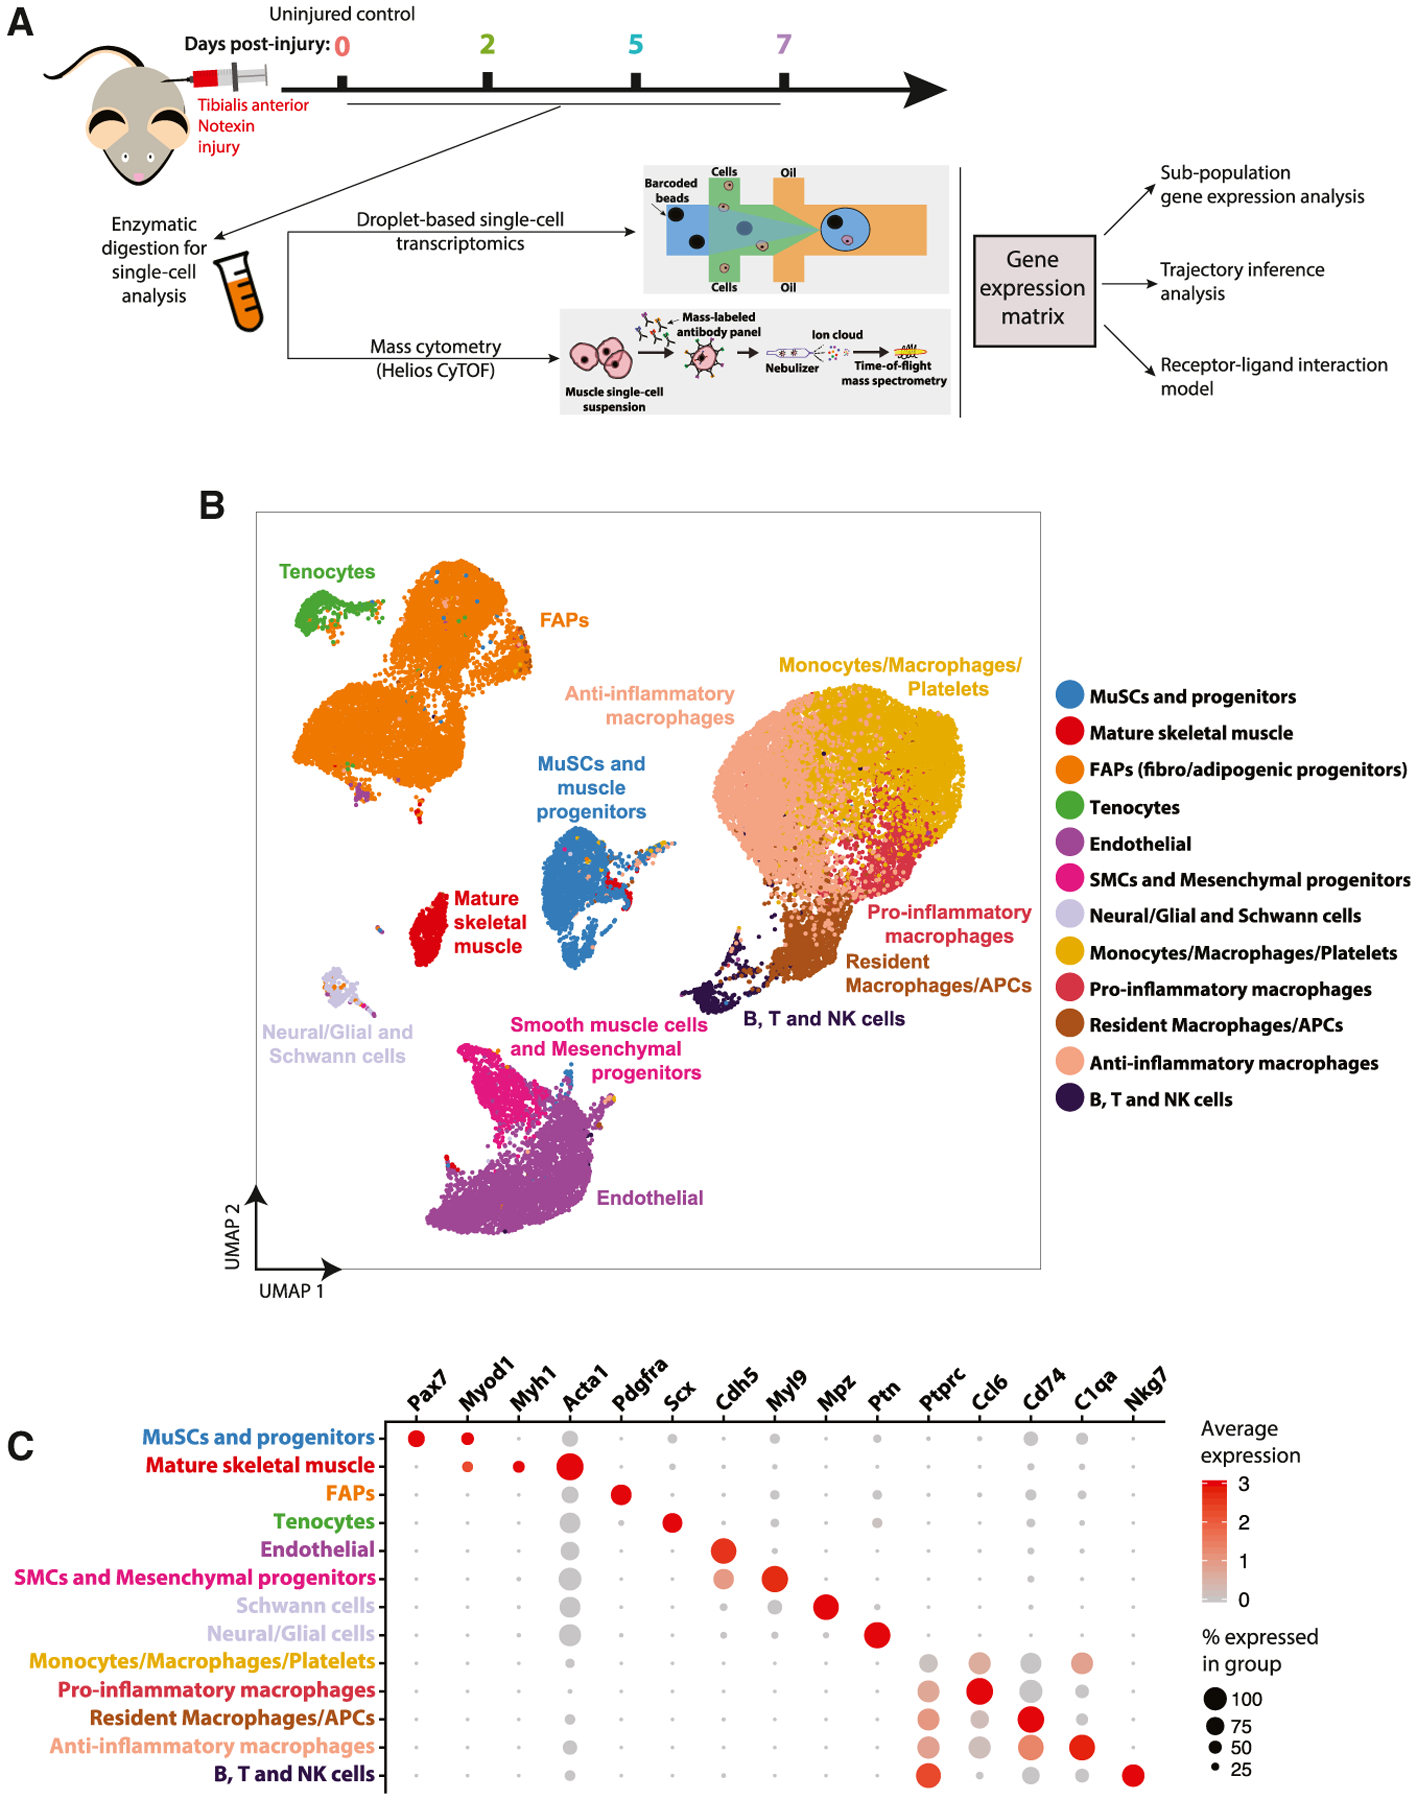
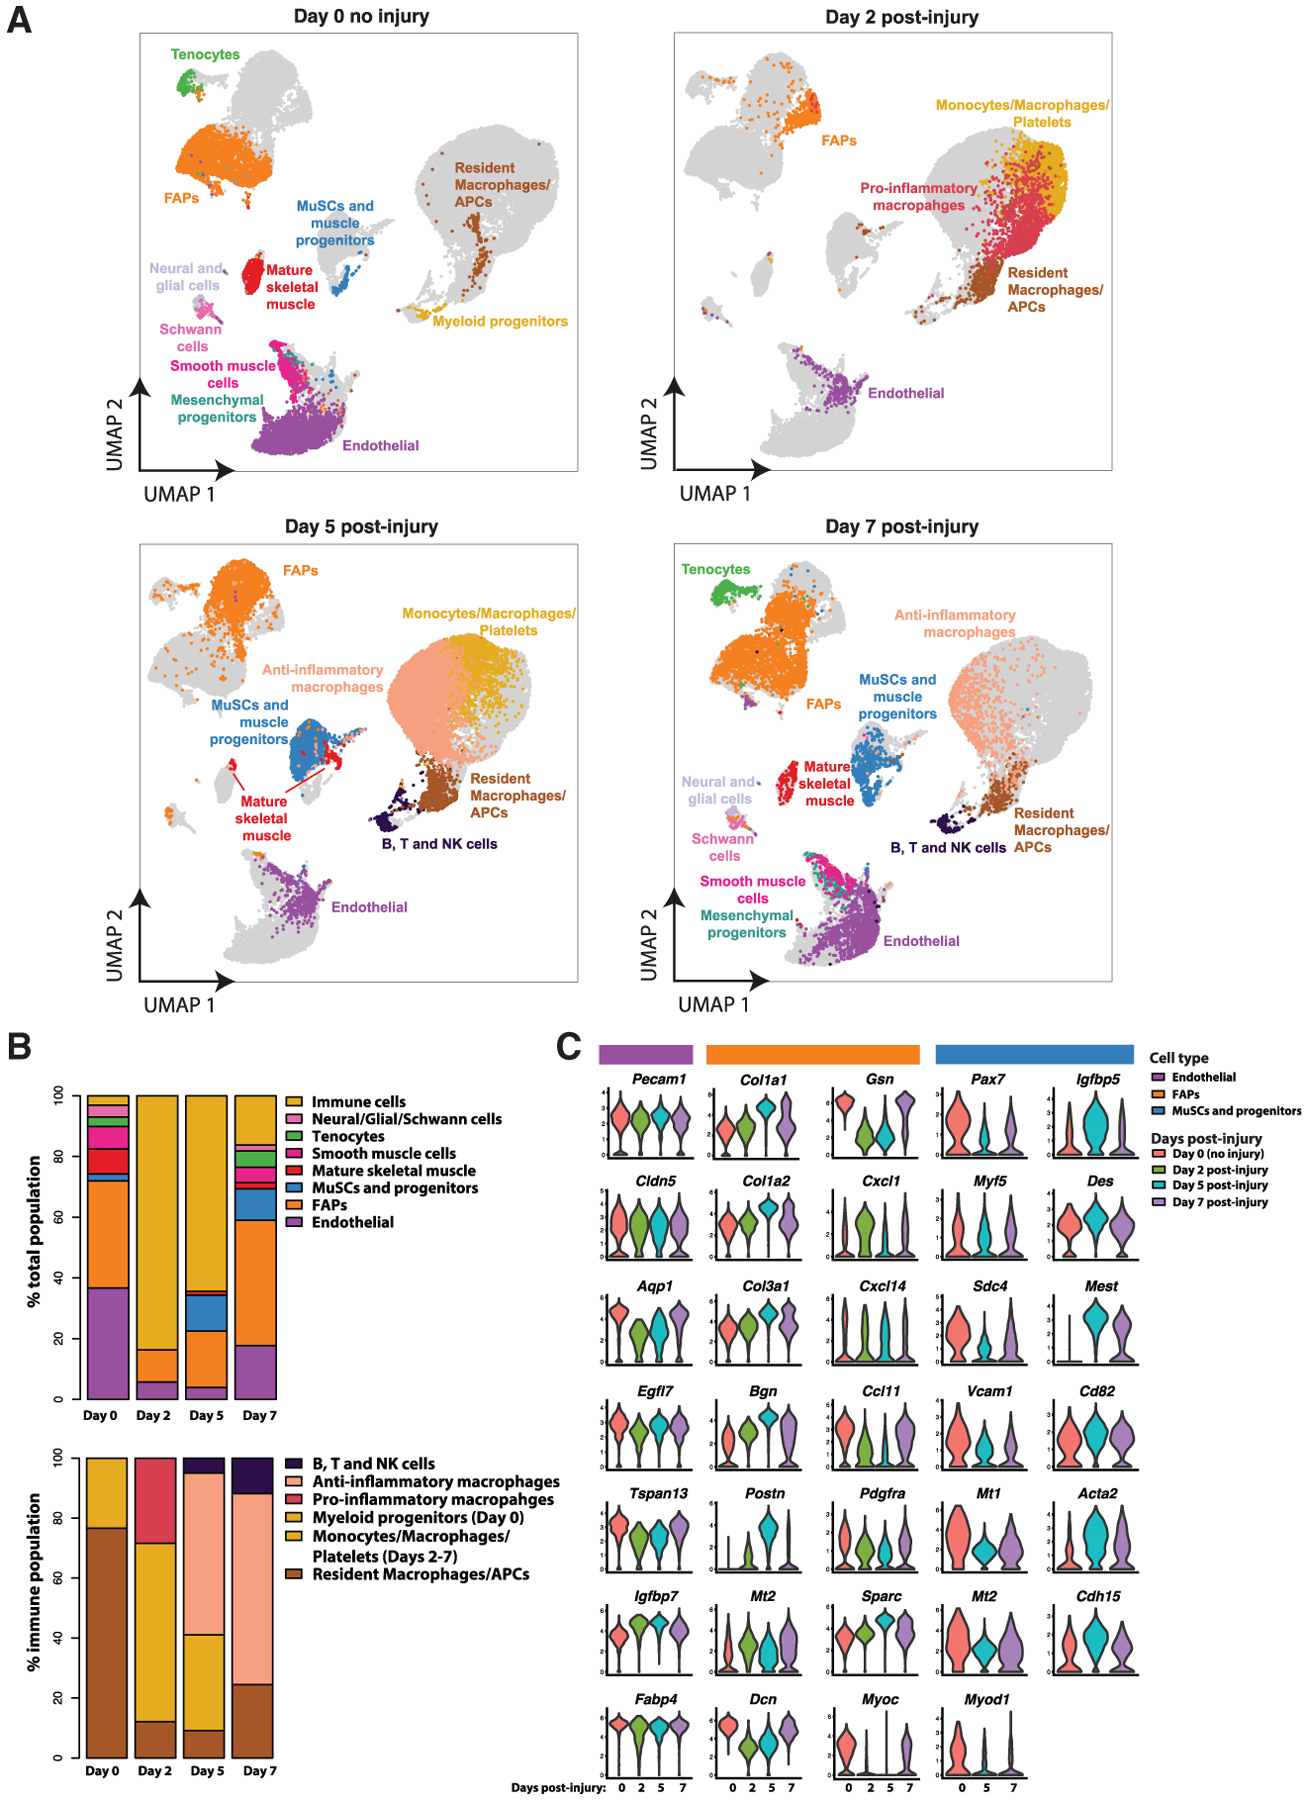
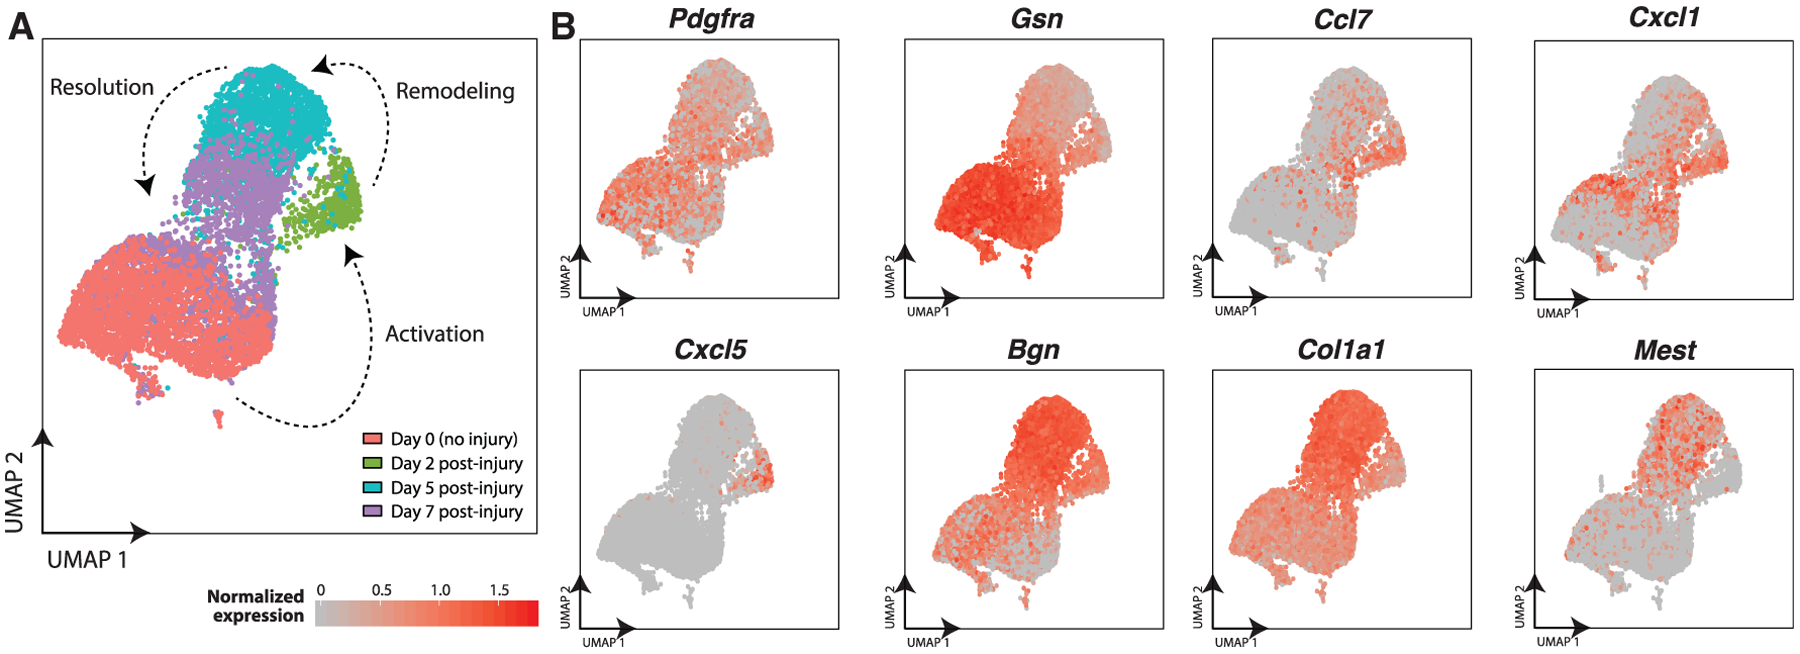
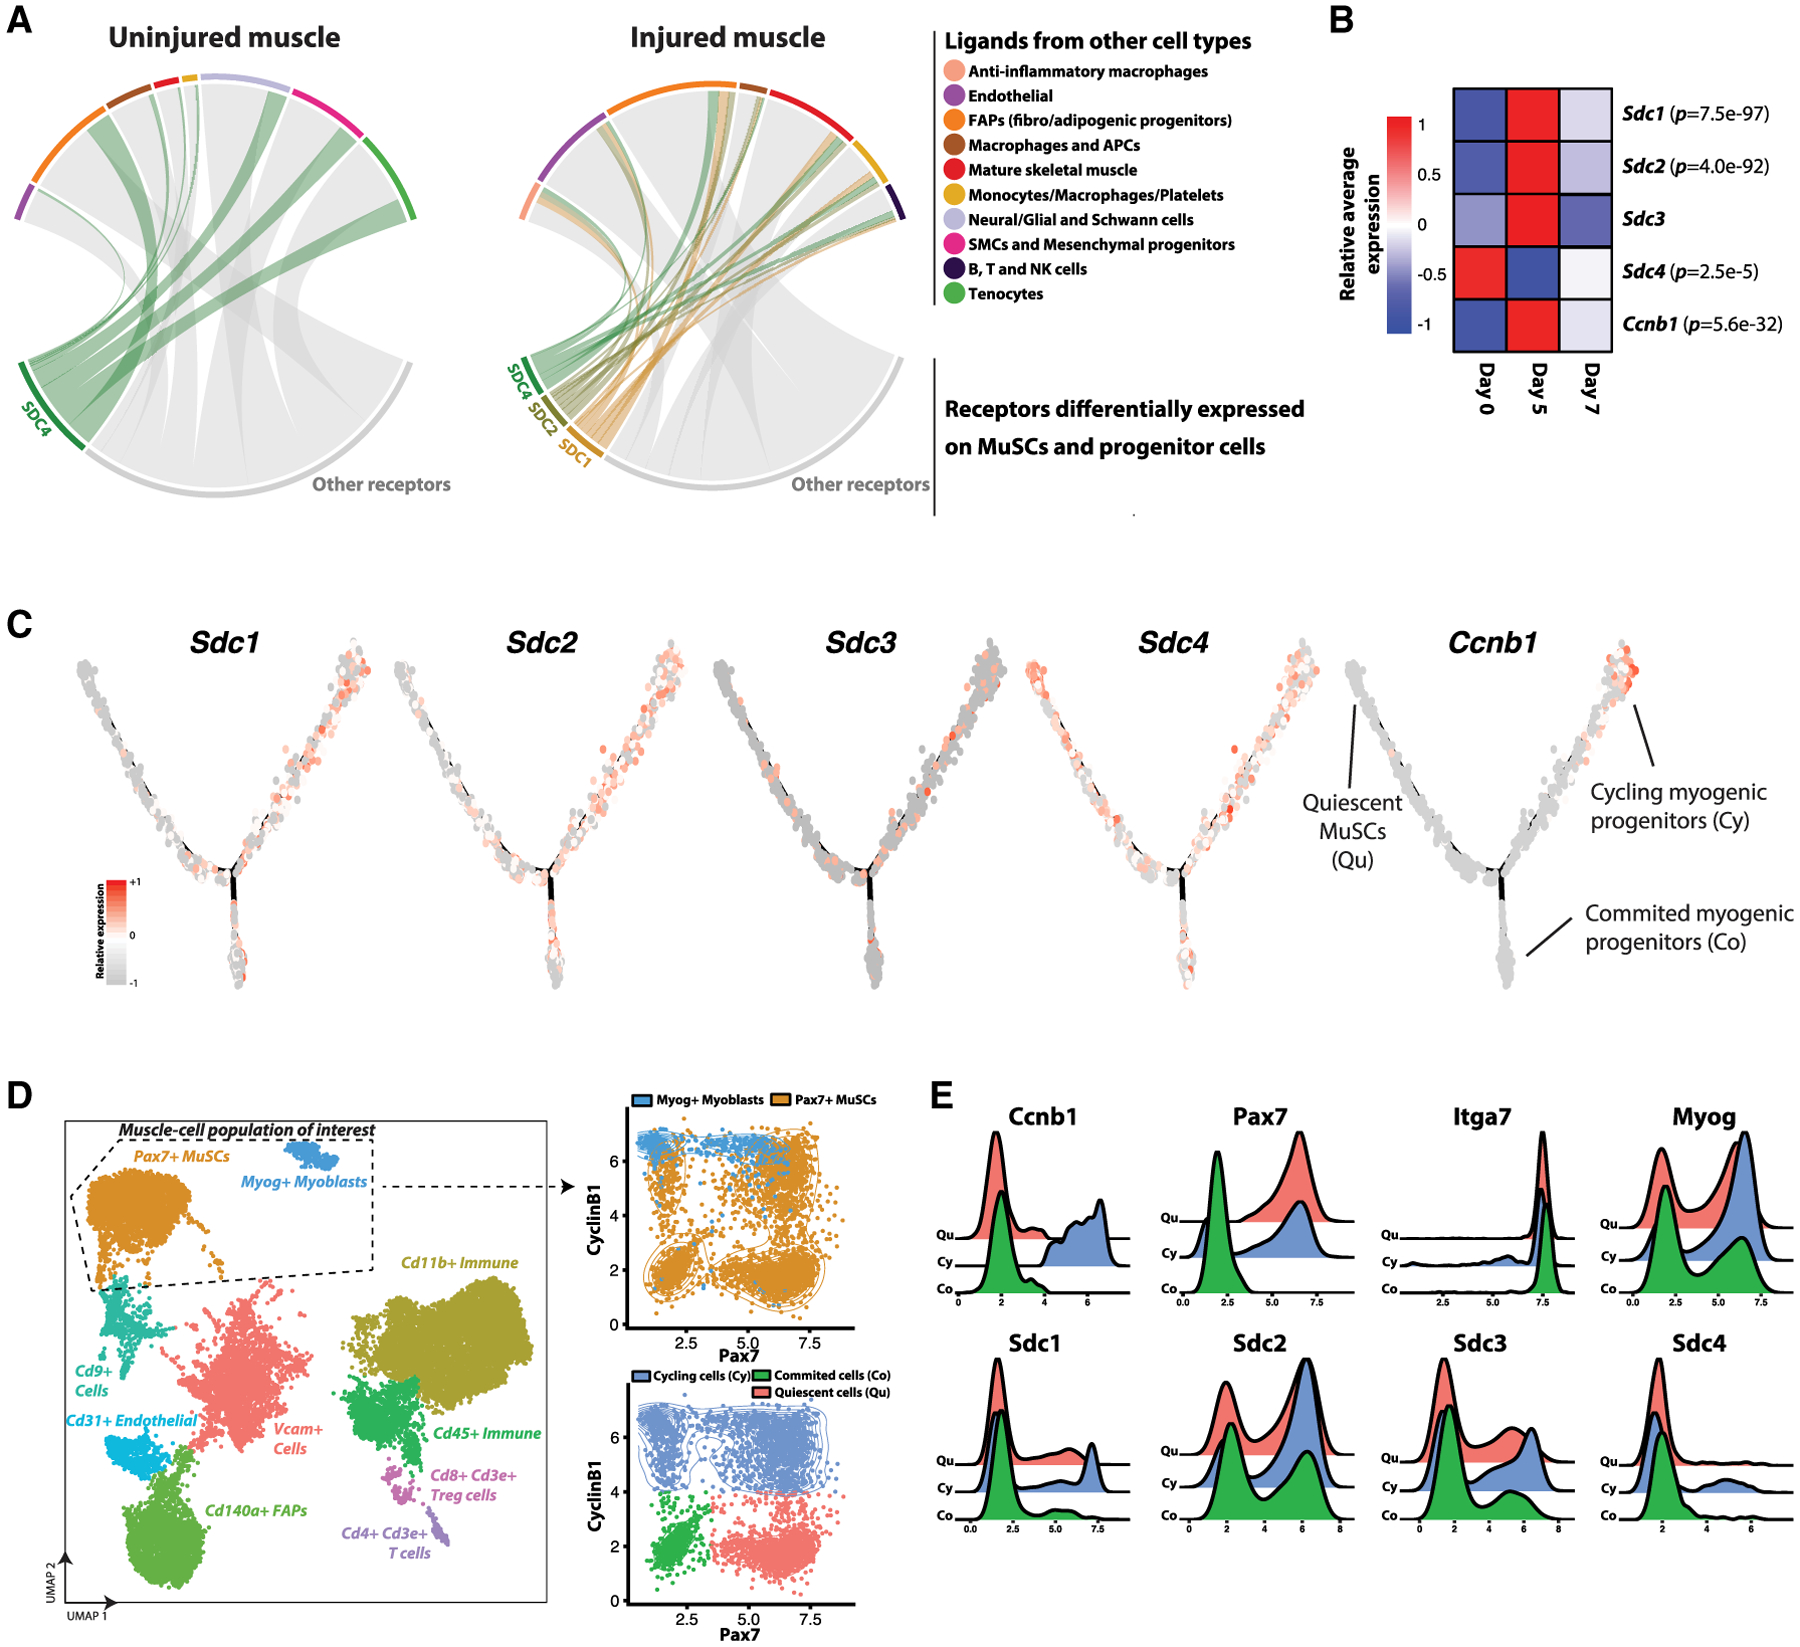
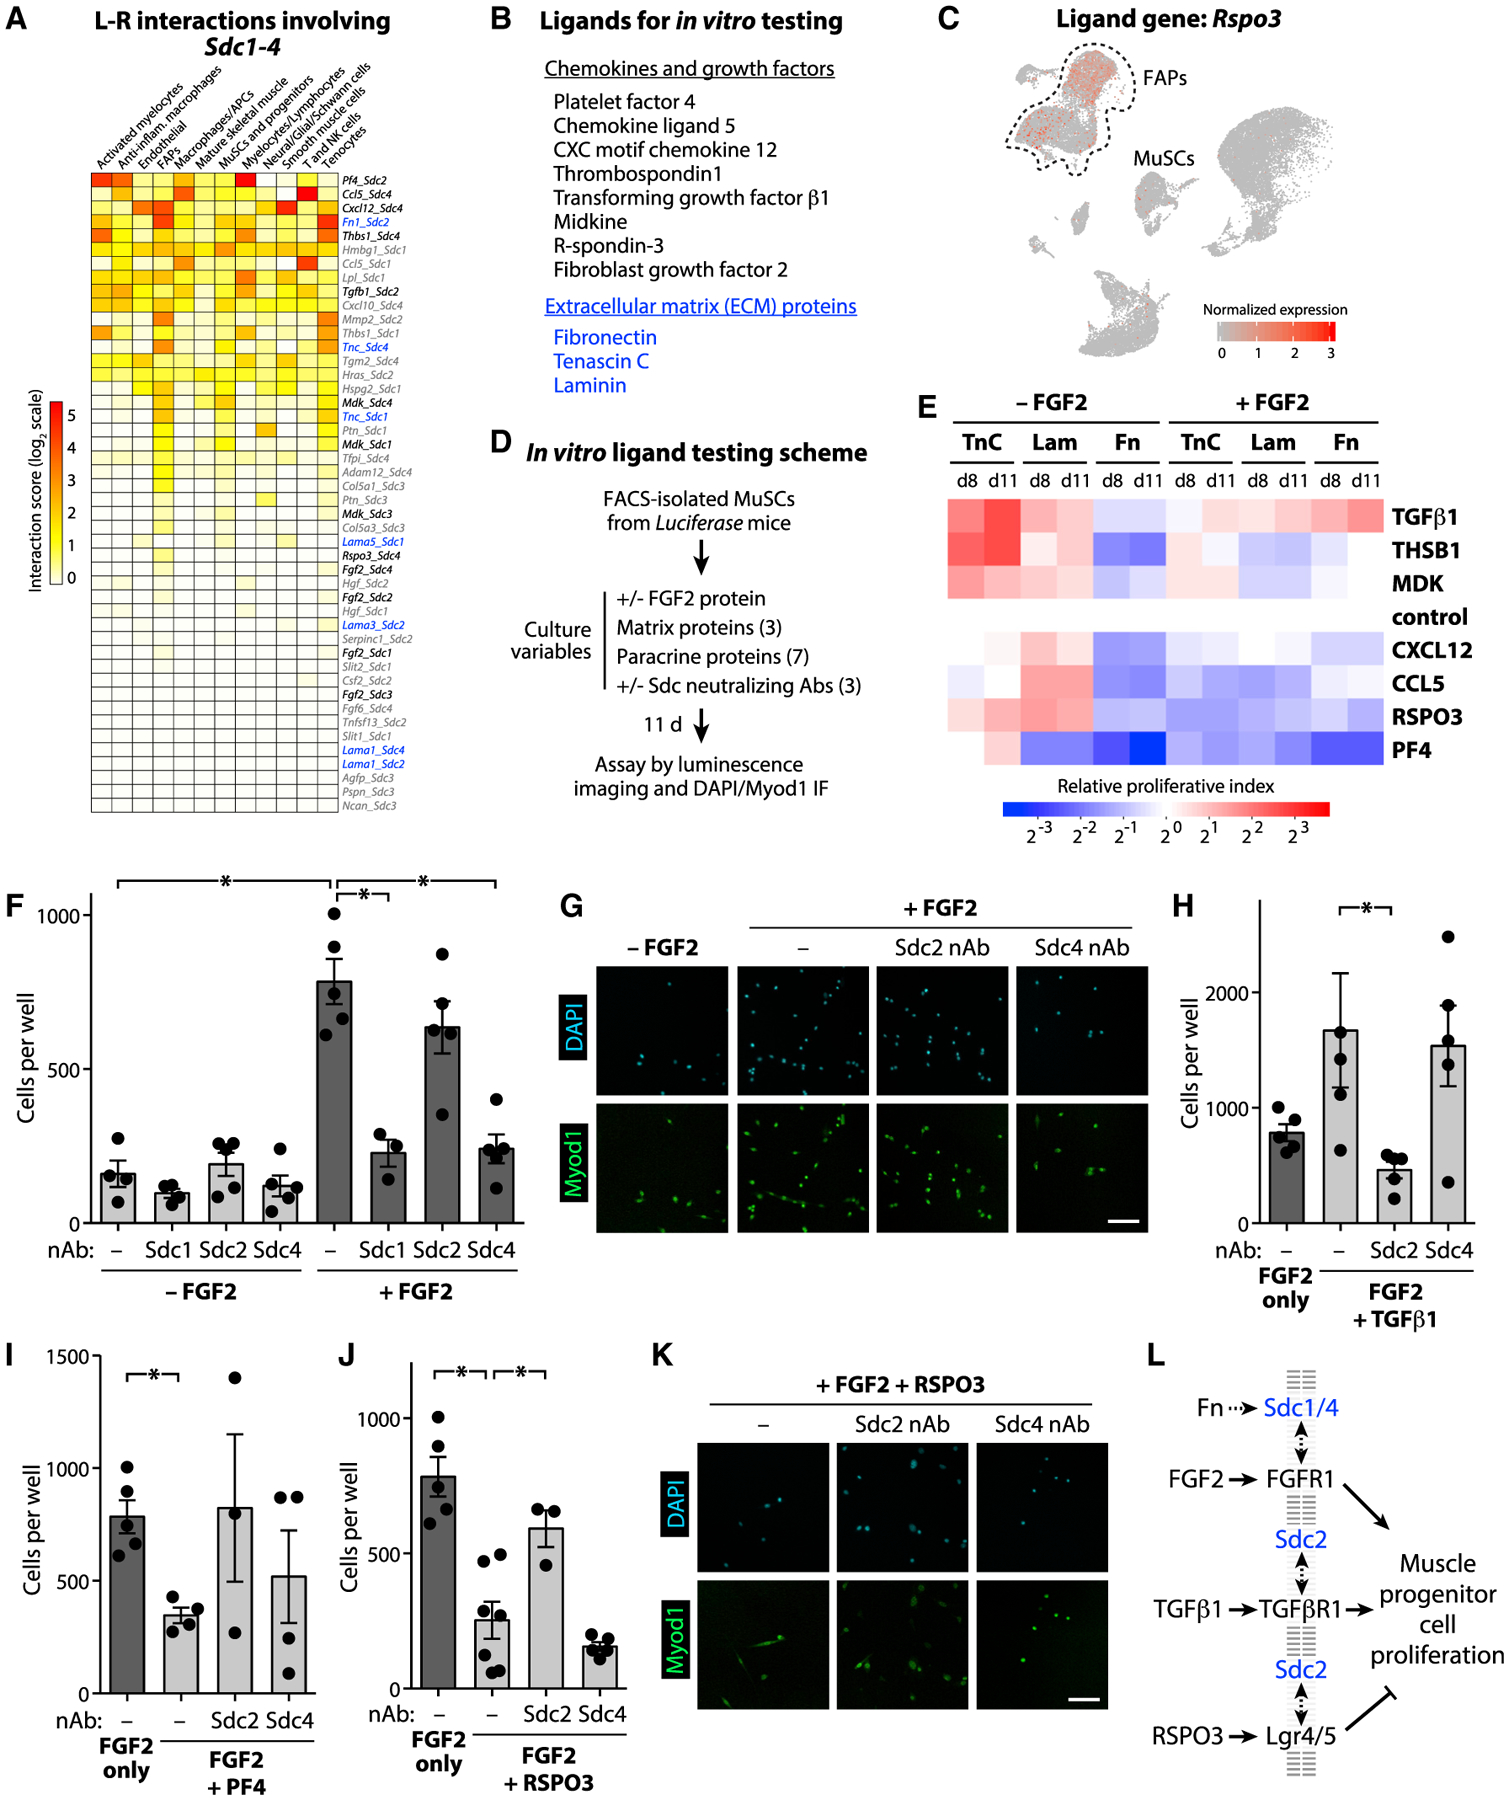
Muscle regeneration relies on the regulation of muscle stem cells (MuSCs) through paracrine signaling interactions. We analyzed muscle regeneration in mice using single-cell RNA sequencing (scRNA-seq) and generated over 34,000 single-cell transcriptomes spanning four time-points. We identified 15 distinct cell types including heterogenous populations of muscle stem and progenitor cells. We resolved a hierarchical map of these myogenic cells by trajectory inference and observed stage-specific regulatory programs within this continuum. Through ligand-receptor interaction analysis, we identified over 100 candidate regeneration-associated paracrine communication pairs between MuSCs and non-myogenic cells. We show that myogenic stem/progenitor cells exhibit heterogeneous expression of multiple Syndecan proteins in cycling myogenic cells, suggesting that Syndecans may coordinate myogenic fate regulation. We performed ligand stimulation in vitro and confirmed that three paracrine factors (FGF2, TGFβ1, and RSPO3) regulate myogenic cell proliferation in a Syndecan-dependent manner. Our study provides a scRNA-seq reference resource to investigate cell communication interactions in muscle regeneration.

Keywords: ligand receptor interaction; muscle stem cells; myogenic differentiation; single-cell RNA-sequencing; skeletal muscle regeneration; syndecans.


Conflict of interest statement

Declaration of Interests The authors declare no conflicts of interest.

Figures

Figure 1.
Figure 1.. Assembly and Curation of a scRNA-Seq Atlas of Mouse Muscle Regeneration
(A) Experimental design overview. Cell suspensions were collected from digested tibialis anterior (TA) muscles of adult mice at various time points (0 [no injury], 2, 5, and 7 days) following notexin injury (n = 2–3) and subjected to scRNA-seq and mass cytometry (CyTOF), followed by downstream analyses. (B) Complete 34,438 cell transcriptomic atlas assembled from all sample time-points. Data are presented as a UMAP projection to visualize variation in single-cell transcriptomes. Unsupervised SNN clustering resolved at least 12 distinct types of cells (color-coded in legend). More resolved cell type clusters, distinguishing neural/glial from Schwann cells and immature B from cytotoxic T cells, were evident when analyzing time-points individually (see Figure 2A). (C) Identification of cell types from SNN clusters based on cluster-average expression of canonical genes. Dot size represents the percentage of cells with a non-zero expression level and color-scale represents the average expression level across all cells within cluster. See also Figures S1–S4.
Figure 2.
Figure 2.. Cell Composition and Gene-Expression Dynamics of Muscle Regeneration
(A) UMAP atlases of muscle single-cell transcriptomes split by time-points post-injury containing, respectively, 7,025, 5,524, 14,240, and 7,646 cells for days 0, 2, 5, and 7 post-notexin injury. Fifteen total cell types were identified using SNN clustering applied to each time-point. Cells from other time-points are in gray. (B) Compositional dynamics of cell types throughout the regeneration time course. Immune cells are grouped together (top) or separated (bottom). (C) Violin plots presenting the heterogeneous gene-expression changes for a selection of differentially expressed genes within the endothelial, FAP, and MuSC and myogenic progenitors’ populations at each time-point. MuSCs and myogenic progenitor cells were too rare at day 2 to analyze. See also Figures S3 and S4.
Figure 3.
Figure 3.. Single-Cell Dynamics of Fibro/Adipogenic Progenitors (FAPs) during Muscle Regeneration
(A) UMAP atlas of FAP single-cell transcriptomes. Subset of full UMAP in Figure 1 focusing on FAP cluster. Cells colored by sample day. (B) Single-cell expression levels for select FAP gene markers. See also Figure S3.
Figure 4.
Figure 4.. Inferring a Muscle Stem/Progenitor Cell Hierarchy using Monocle Pseudotime Model
(A) All cells within the muscle stem/progenitor and mature skeletal muscle myonuclei clusters (3,276 total cells) from days 0, 5, and 7 post-injury (top left) were selected and re-analyzed by SNN/UMAP (bottom left) and Monocle reverse graph embedding (right). Graph embedding results are presented with cells color-coded by day and labeled by SNN cluster identities. (B–D) A refined analysis of muscle stem and progenitor subpopulations, after removal of mature myocytes, by Monocle. These non-mature muscle cells were subjected to reverse graph embedding and trajectory inference using Monocle’s differential expression analysis to identify cell groups (“branches”). (B) The top-75 differentially expressed genes in the three branches (Qu, quiescent MuSCs; Cy, cycling progenitors; Co, committed progenitors), organized by branch and then ordered within each branch by pseudotime value (see Figures S5D and S5E). (C) Monocle feature plots showing three branch groups (Qu, Cy, Co) connected by a learned manifold (black lines). Same colors are used to associate individual cells with branch groups in (C, top left) and (D). The abundance of Pax7, Myog, and Cdk1 transcripts are plotted for individual cells using a Z score normalized color-scale. (D) Pseudotime ordered single-cell expression trajectories for genes enriched in the quiescence (Qu) cluster (Pax7, Btg2), in the cycling (Cy) cluster (Cdk1, Cdc20), and in the commitment (Co) cluster (Myog, Cdkn1c). Overlaid lines correspond to inferred cell trajectories associated with ending in the cycling (hatched) and commitment (solid) clusters. See also Figure S5.
Figure 5.
Figure 5.. Ligand-Receptor Model Reveals Diversification of Communication Signals Linked to Heterogeneously Expressed Syndecan Family Receptors during Muscle Regeneration
(A) Chord plot summarizing the significant pairwise interactions between receptor genes that are differentially expressed in the MuSC and progenitor cell population and ligand genes expressed by other cell types within the transcriptomic atlas. (Left) Uninjured (day 0) samples. (Right) Injured (days 5 and 7 post-injury) samples. Differentially expressed receptor genes outside of the Syndecan family are in gray. For a given ligand-receptor pair, we only represent interactions whose score (Figures S6A and S6B) is greater than the 50th percentile across all cell types. (B) Sdc1/2/3/4 and Ccnb1 (Cyclin-B1) transcript averages across all non-mature myogenic cells within the transcriptomic atlas, split by days post-injury. p values listed if differentially expressed across time-points when modeled using a negative binomial distribution. (C) Ccnb1 and Sdc1/2/3/4 gene-expression levels within the myogenic cells organized into the Monocle trajectory (see Figure 4C). (D) (Left) CyTOF atlas, consisting of 19,028 cells collected from regenerating (day 5 post-injury) muscles and stained with a panel of 35 antibodies (see Table S1) including Syndecan-1/2/3/4 and Cyclin-B1. UMAP and unsupervised SNN clustering identified 11 populations including a population of Pax7+ MuSCs (orange) and Myog+ myogenic progenitors (blue). These two myogenic clusters were grouped for further analysis. (Right) Cyclin-B1 versus Pax7 scatterplots. (Top) Coded using CyTOF SNN cluster identifiers. (Bottom) Coded by subpopulation gates: Cyclin-B1 Pax7+ quiescent cells (Qu; pink), Cyclin-B1+ cycling progenitors (Cy; blue), and Cyclin-B1 Pax7 committed myocytes (Co; green). (E) Expression histograms for Syndecan-1/2/3/4 and other myogenic markers for the three subpopulations identified in (D). See also Figure S6.
Figure 6.
Figure 6.. Syndecan Family Proteins Differentially Mediate Paracrine Ligand-Induced Muscle Stem/Progenitor Cell Proliferation
(A) Transcriptomic interaction scores for any ligand-receptor pairs involving Sdc family genes. Interaction scores were calculated by averaging across all cells within the same annotated cell-type collectively among the days 0, 5, and 7 samples. Scores were summed across all cell-types and then rank-ordered in the heatmap. (B) Ligand-receptor candidate pairs selected for subsequent analysis are indicated in black (for soluble factors) or blue (for ECM factors). (C) UMAP feature plot of the full atlas showing the normalized expression level of ligand gene Rspo3. (D) Scheme for in vitro testing candidate ligands. MuSCs were isolated from 3-month–old Luciferase transgenic mice by (PI/CD45/CD11b/CD31/Sca1) CD34+ Integrin-α7+ sorting. (E) Initial screen of candidate ligands. Proliferative index of Luciferase-expressing MuSCs in culture on either Tenascin C-, Laminin-, or Fibronectin-coated tissue culture plastic, with or without FGF2, and treated with 7 different candidate ligands. Data presented as mean of n=4–8 replicates and normalized by time-point (day 8 or 11) and treatment condition to the non-ligand controls. (F–K) Proliferation of MuSC in culture on Fibronectin-coated plastic, treated with or without FGF2 (F–K), TGFβ1 (H), PF4 (I), and/or RSPO3 (J), and neutralizing antibodies (nAbs) to Syndecan-1, −2, or −4. Cell count data in (F), (H), (I), and (J) are presented as mean ± SEM of n=3–6 replicates. Asterisk (*) indicates comparisons with p value < 0.05 by unpaired t test. (G and K) Representative immunofluorescence (IF) images of myogenic cell proliferation assayed by nuclei counts (DAPI) and anti-Myod1 staining at 11 days. Scale bars: 100 μm. (L) Summary of ligand-induced myogenic cell proliferation findings.

References

    1. Baitsch D, Bock HH, Engel T, Telgmann R, Müller-Tidow C, Varga G, Bot M, Herz J, Robenek H, von Eckardstein A, and Nofer JR (2011). Apolipoprotein E induces antiinflammatory phenotype in macrophages. Arterioscler. Thromb. Vasc. Biol 31, 1160–1168. - PMC - PubMed
    1. Becht E, McInnes L, Healy J, Dutertre CA, Kwok IWH, Ng LG, Ginhoux F, and Newell EW (2018). Dimensionality reduction for visualizing single-cell data using UMAP. Nat. Biotechnol 37, 34–44(2019). - PubMed
    1. Bentzinger CF, Wang YX, von Maltzahn J, Soleimani VD, Yin H, and Rudnicki MA (2013). Fibronectin regulates Wnt7a signaling and satellite cell expansion. Cell Stem Cell 12, 75–87. - PMC - PubMed
    1. Biressi S, and Rando TA (2010). Heterogeneity in the muscle satellite cell population. Semin. Cell Dev. Biol 21, 845–854. - PMC - PubMed
    1. Blau HM, Cosgrove BD, and Ho AT (2015). The central role of muscle stem cells in regenerative failure with aging. Nat. Med 21, 854–862. - PMC - PubMed

Publication types