. 2020 Mar 11;12(5):4052-4066.
doi: 10.18632/aging.102903. Epub 2020 Mar 11.

Survey of senescent cell markers with age in human tissues

Affiliations

Survey of senescent cell markers with age in human tissues

M Laura Idda et al. Aging (Albany NY). .

Abstract

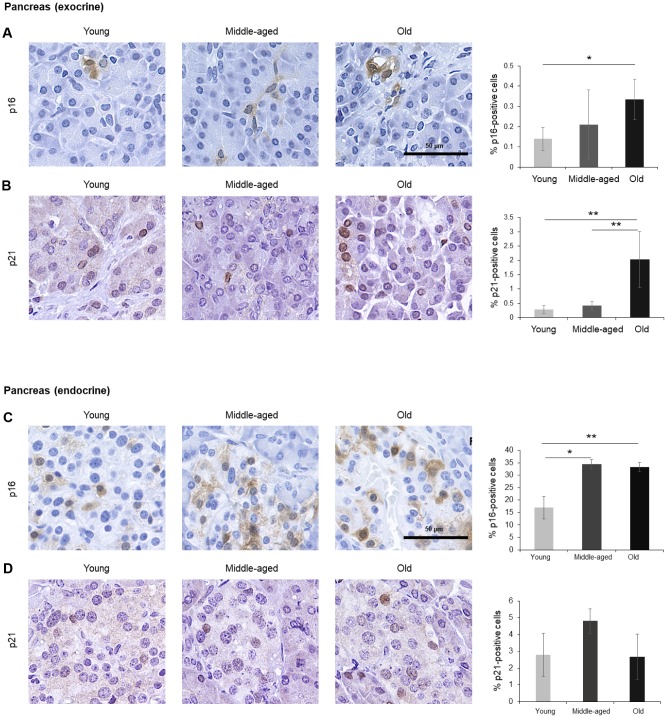
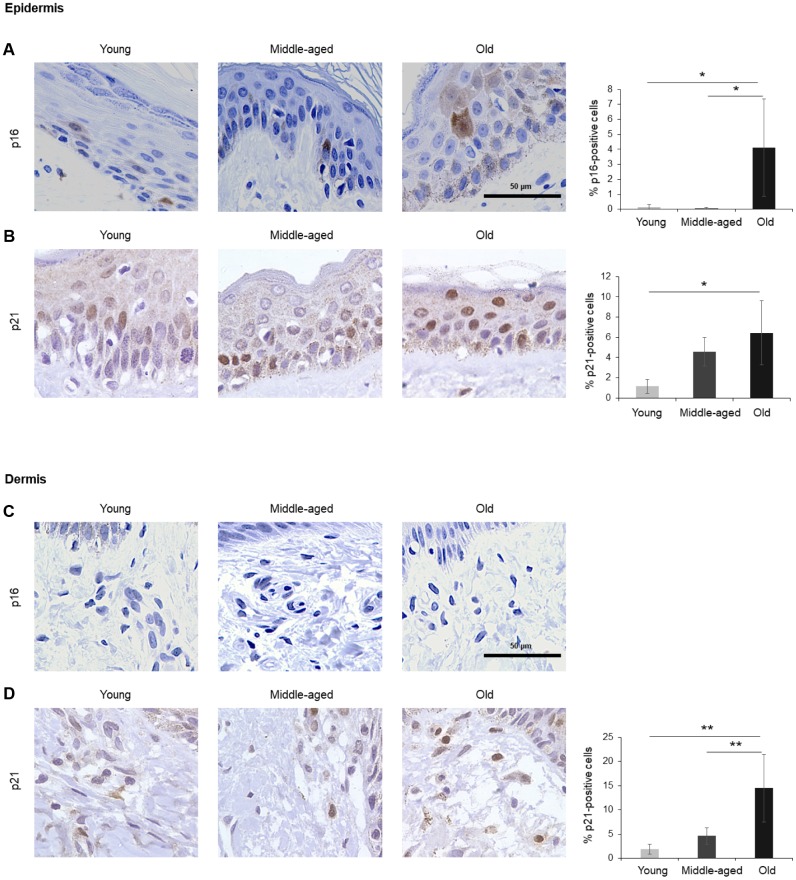
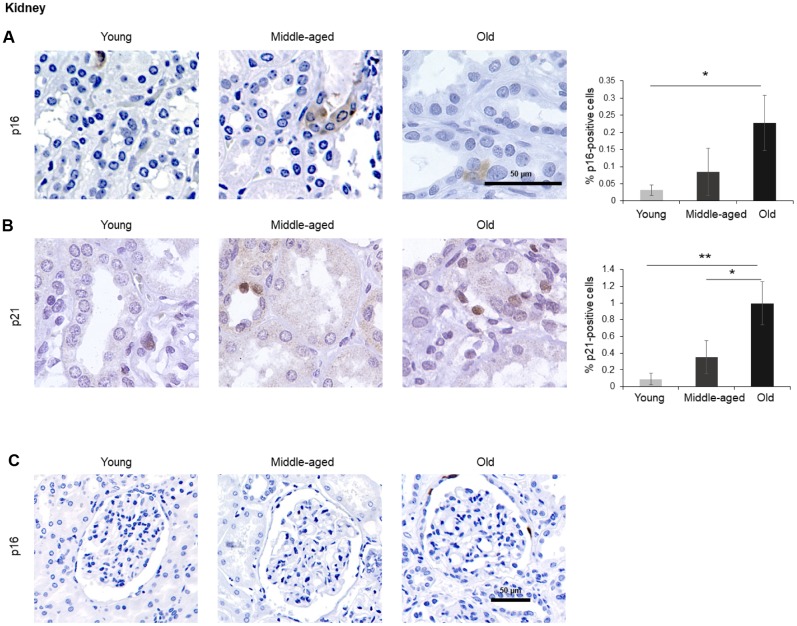
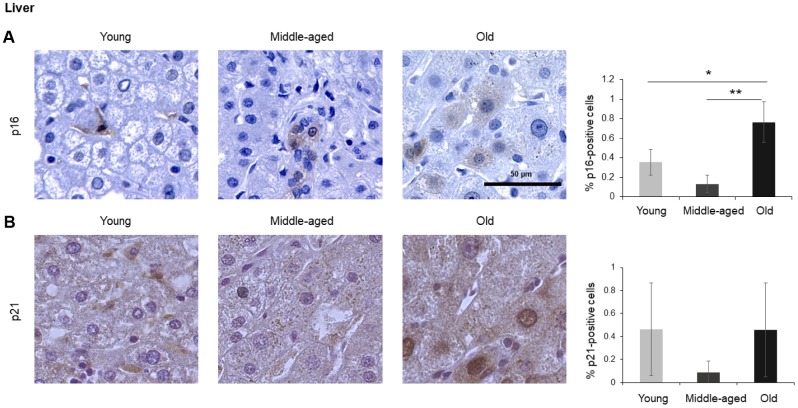
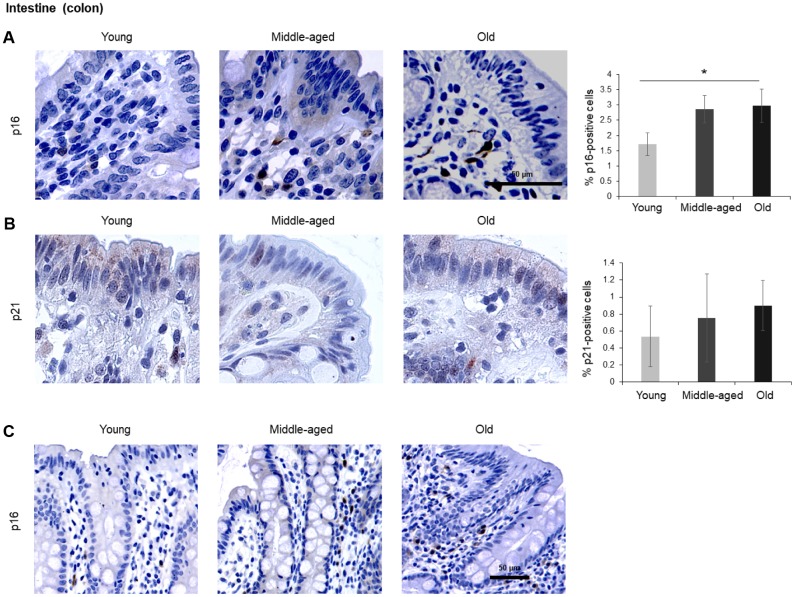
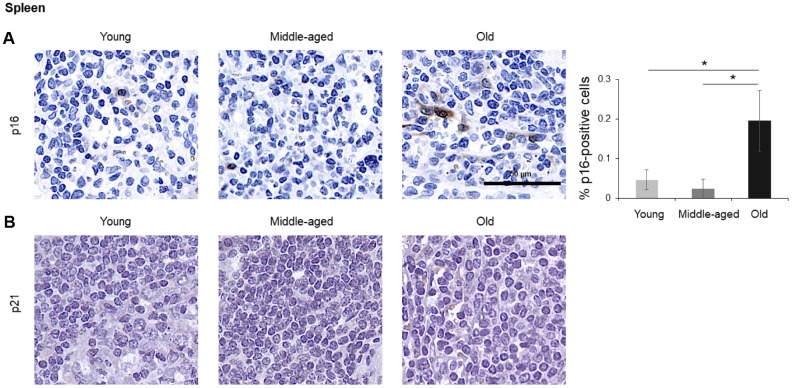
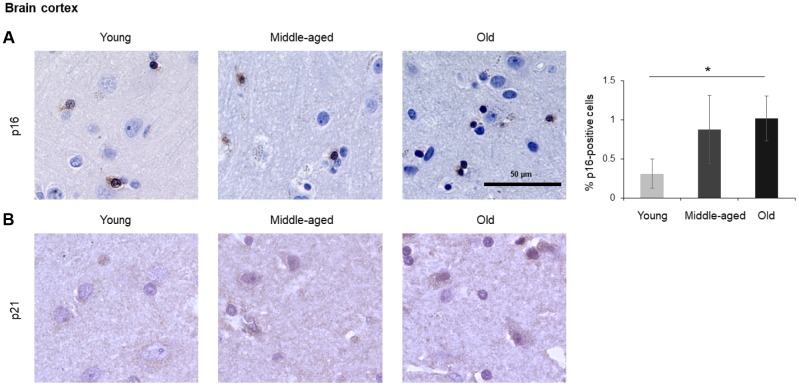
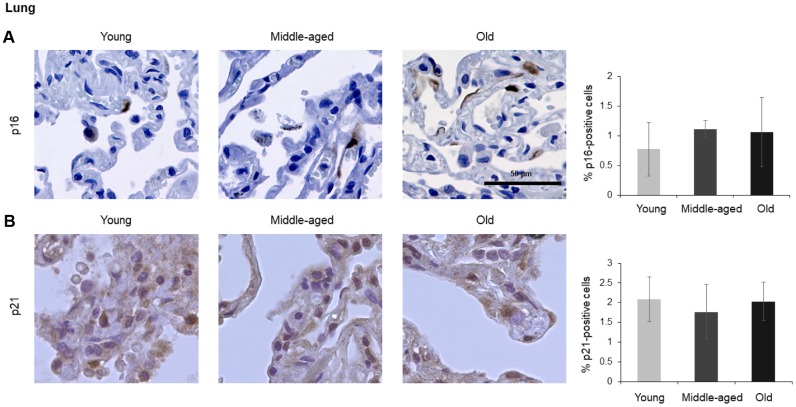
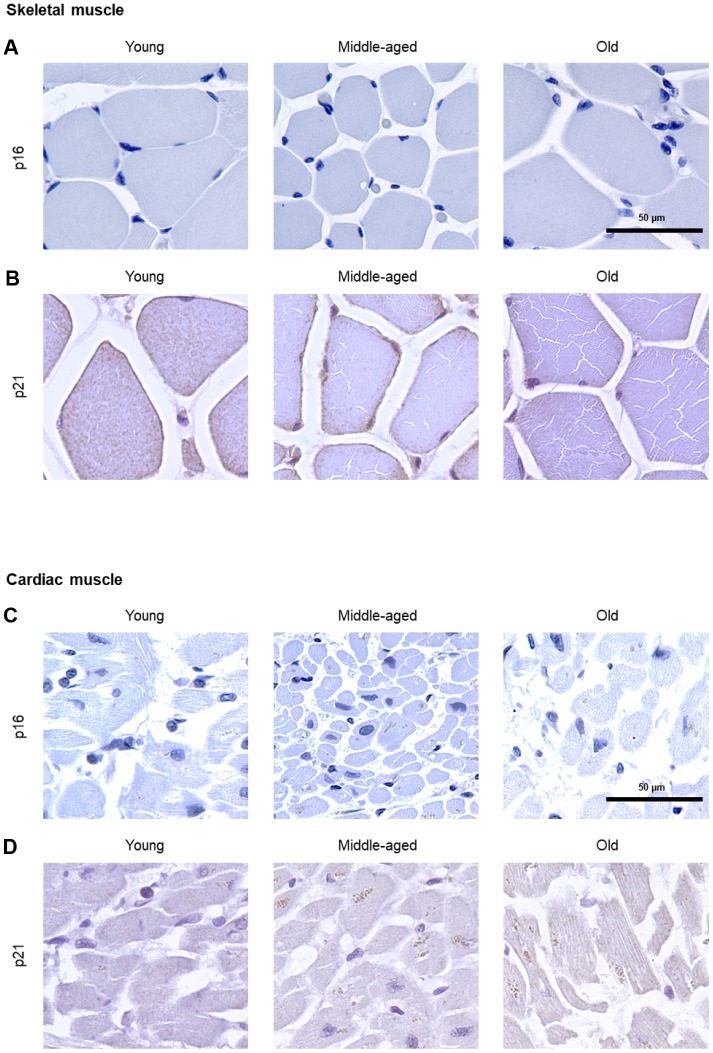
Cellular senescence, triggered by sublethal damage, is characterized by indefinite growth arrest, altered gene expression patterns, and a senescence-associated secretory phenotype. While the accumulation of senescent cells during aging decreases tissue function and promotes many age-related diseases, at present there is no universal marker to detect senescent cells in tissues. Cyclin-dependent kinase inhibitors 2A (p16/CDKN2A) and 1A (p21/CDKN1A) can identify senescent cells, but few studies have examined the numbers of cells expressing these markers in different organs as a function of age. Here, we investigated systematically p16- and p21-positive cells in tissue arrays designed to include normal organs from persons across a broad spectrum of ages. Increased numbers of p21-positive and p16-positive cells with donor age were found in skin (epidermis), pancreas, and kidney, while p16-expressing cells increased in brain cortex, liver, spleen and intestine (colon), and p21-expressing cells increased in skin (dermis). The numbers of cells expressing p16 or p21 in lung did not change with age, and muscle did not appear to have p21- or p16-positive cells. In summary, different organs display different levels of the senescent proteins p16 and p21 as a function of age across the human life span.

Keywords: aging; p16; p21; senescence in tissues.


Conflict of interest statement

CONFLICTS OF INTEREST: The authors declare that they have no conflicts of interest.

Figures

Figure 1
Figure 1
Pancreas. (A, B) Cells expressing p16 (A) or p21 (B) were identified by IHC staining in exocrine regions of the pancreas of Young, Middle-aged, and Old donors. (C, D) Cells expressing p16 (C) or p21 (D) were identified by IHC staining in the endocrine regions of the pancreas from Young, Middle-aged, and Old donors. Graphs represent the quantification (%) of p16-positive (A, C) and p21-positive (B, D) cells from 5 tissue cores from independent donors per organ and age group; data represent the means ±SD from 5 different donors. p values were determined by one-way ANOVA with Tukey adjustments for multiple comparisons where appropriate. **, p < 0.01; *, p < 0.05.
Figure 2
Figure 2
Skin. (A, B) Cells expressing p16 (A) or p21 (B) were identified by IHC staining in the epidermis of Young, Middle-aged, and Old donors. (C, D) Cells expressing p16 (C) or p21 (D) were identified by IHC staining in the dermis from Young, Middle-aged, and Old donors. Graphs represent the quantification (%) of p16-positive (A) and p21-positive (B, D) cells from 5 tissue cores from independent donors per organ and age group; data represent the means ±SD from 5 different donors. p values were determined by one-way ANOVA with Tukey adjustments for multiple comparisons where appropriate. **, p < 0.01; *, p < 0.05.
Figure 3
Figure 3
Kidney. (A, B) Cells expressing p16 (A) or p21 (B) were identified by IHC staining in the renal cortex of kidney of Young, Middle-aged, and Old donors. (C) Decreased magnification images showing p16-positive cells in the Bowman capsule of Old donors. Graphs represent the quantification (%) of p16-positive (A) and p21-positive (B) cells from 5 tissue cores from independent donors per organ and age group; data represent the means ±SD from 5 different donors. p values were determined by one-way ANOVA with Tukey adjustments for multiple comparisons where appropriate. **, p < 0.01; *, p < 0.05.
Figure 4
Figure 4
Liver. Cells expressing p16 (A) or p21 (B) were identified by IHC staining in the liver of Young, Middle-aged, and Old donors. Graphs represent the quantification (%) of p16-positive (A) and p21-positive (B) cells from 5 tissue cores from independent donors per organ and age group; data represent the means ±SD from 5 different donors. p values were determined by one-way ANOVA with Tukey adjustments for multiple comparisons where appropriate. **, p < 0.01; *, p < 0.05.
Figure 5
Figure 5
Intestine (colon). (A, B) Cells expressing p16 (A) or p21 (B) were identified by IHC staining in the colon of Young, Middle-aged, and Old donors. (C) p16-expressing cells in colon shown at lower magnification (20x). Graphs represent the quantification (%) of p16-positive (A) and p21-positive (B) cells from 5 tissue cores from independent donors per organ and age group; data represent the means ±SD from 5 different donors. p values were determined by one-way ANOVA with Tukey adjustments for multiple comparisons where appropriate. *, p < 0.05.
Figure 6
Figure 6
Spleen. Cells expressing p16 (A) or p21 (B) were identified by IHC staining in the spleen of Young, Middle-aged, and Old donors. Graph represents the quantification (%) of p16-positive cells from 5 tissue cores from independent donors per organ and age group; data represent the means ±SD from 5 different donors. p values were determined by one-way ANOVA with Tukey adjustments for multiple comparisons where appropriate. *, p < 0.05.
Figure 7
Figure 7
Brain cortex. Cells expressing p16 (A) or p21 (B) were identified by IHC staining in the brain cortex from Young, Middle-aged, and Old donors. Graph represents the quantification (%) of p16-positive cells from 5 tissue cores from independent donors per organ and age group; data represent the means ±SD from 5 different donors. p values were determined by one-way ANOVA with Tukey adjustments for multiple comparisons where appropriate. *, p < 0.05.
Figure 8
Figure 8
Lung. Cells expressing p16 (A) or p21 (B) were identified by IHC staining in the lung from Young, Middle-aged, and Old donors. Graph represents the quantification (%) of p16-positive cells (A) and p21-positive cells (B) from 5 tissue cores from independent donors per organ and age group; data represent the means ±SD from 5 different donors.
Figure 9
Figure 9
Muscle. IHC analysis to detect cells expressing p16 (A) or p21 (B) in skeletal muscle of Young, Middle-aged, and Old donors. IHC analysis to detect cells expressing p16 (C) or p21 (D) in cardiac muscle of Young, Middle-aged, and Old donors. These proteins were undetectable in these muscle biopsies (5 cores per organ and age group).

References

    1. Gorgoulis V, Adams PD, Alimonti A, Bennett DC, Bischof O, Bishop C, Campisi J, Collado M, Evangelou K, Ferbeyre G, Gil J, Hara E, Krizhanovsky V, et al.. Cellular Senescence: Defining a Path Forward. Cell. 2019; 179:813–27. 10.1016/j.cell.2019.10.005 - DOI - PubMed
    1. Kuilman T, Michaloglou C, Mooi WJ, Peeper DS. The essence of senescence. Genes Dev. 2010; 24:2463–79. 10.1101/gad.1971610 - DOI - PMC - PubMed
    1. Coppé JP, Desprez PY, Krtolica A, Campisi J. The senescence-associated secretory phenotype: the dark side of tumor suppression. Annu Rev Pathol. 2010; 5:99–118. 10.1146/annurev-pathol-121808-102144 - DOI - PMC - PubMed
    1. Kuilman T, Peeper DS. Senescence-messaging secretome: SMS-ing cellular stress. Nat Rev Cancer. 2009; 9:81–94. 10.1038/nrc2560 - DOI - PubMed
    1. Dimri GP, Lee X, Basile G, Acosta M, Scott G, Roskelley C, Medrano EE, Linskens M, Rubelj I, Pereira-Smith O. A biomarker that identifies senescent human cells in culture and in aging skin in vivo. Proc Natl Acad Sci USA. 1995; 92:9363–67. 10.1073/pnas.92.20.9363 - DOI - PMC - PubMed

Publication types

Substances