. 2020 May 8;126(10):1346-1359.
doi: 10.1161/CIRCRESAHA.119.316206. Epub 2020 Mar 12.

Atherogenic Lipoprotein(a) Increases Vascular Glycolysis, Thereby Facilitating Inflammation and Leukocyte Extravasation

Affiliations

Atherogenic Lipoprotein(a) Increases Vascular Glycolysis, Thereby Facilitating Inflammation and Leukocyte Extravasation

Johan G Schnitzler et al. Circ Res. .

Abstract

Rationale: Patients with elevated levels of lipoprotein(a) [Lp(a)] are hallmarked by increased metabolic activity in the arterial wall on positron emission tomography/computed tomography, indicative of a proinflammatory state.

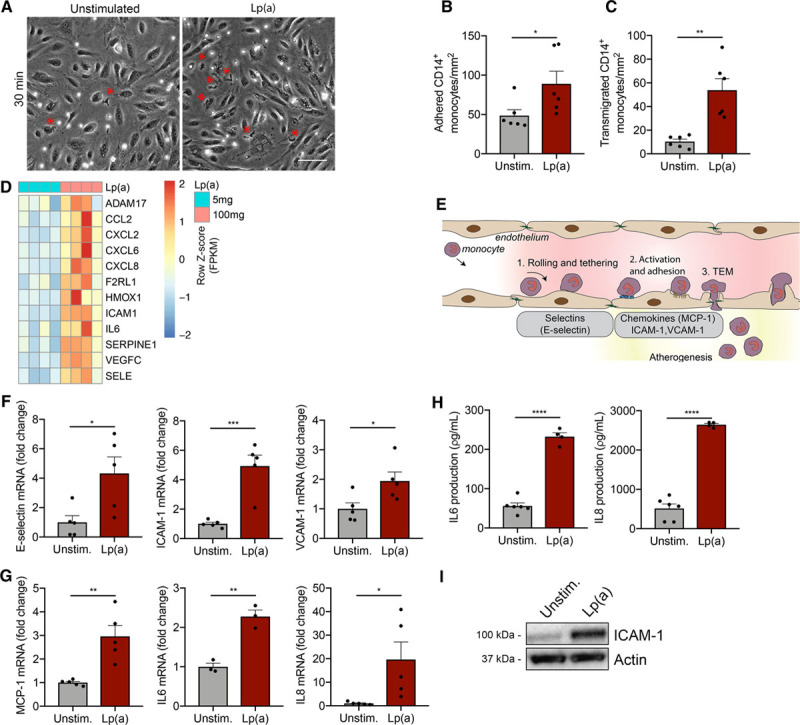
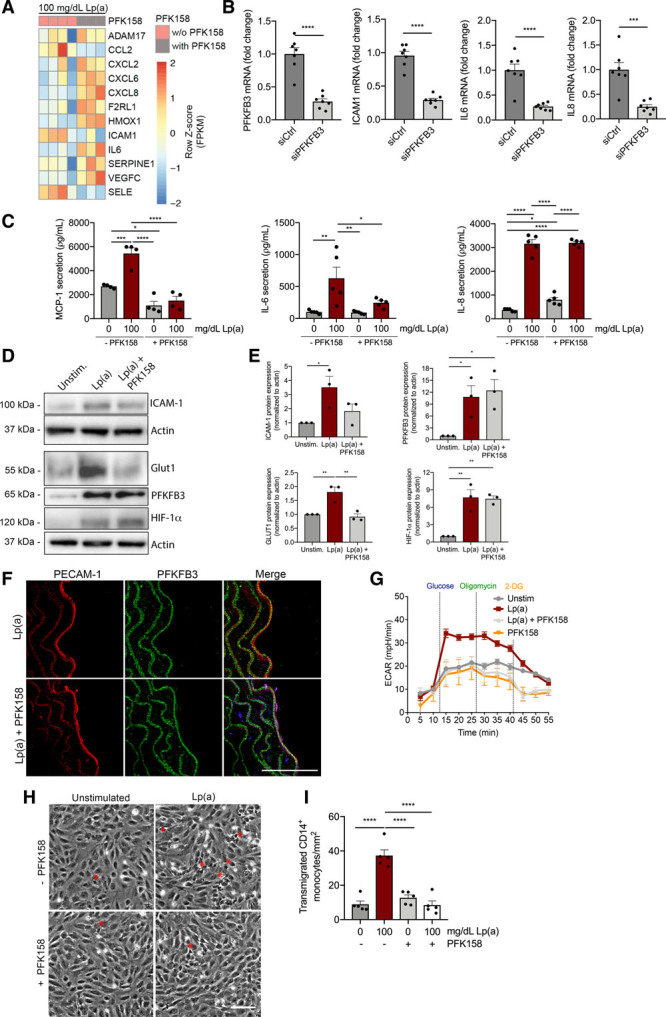
Objective: We hypothesized that Lp(a) induces endothelial cell inflammation by rewiring endothelial metabolism.

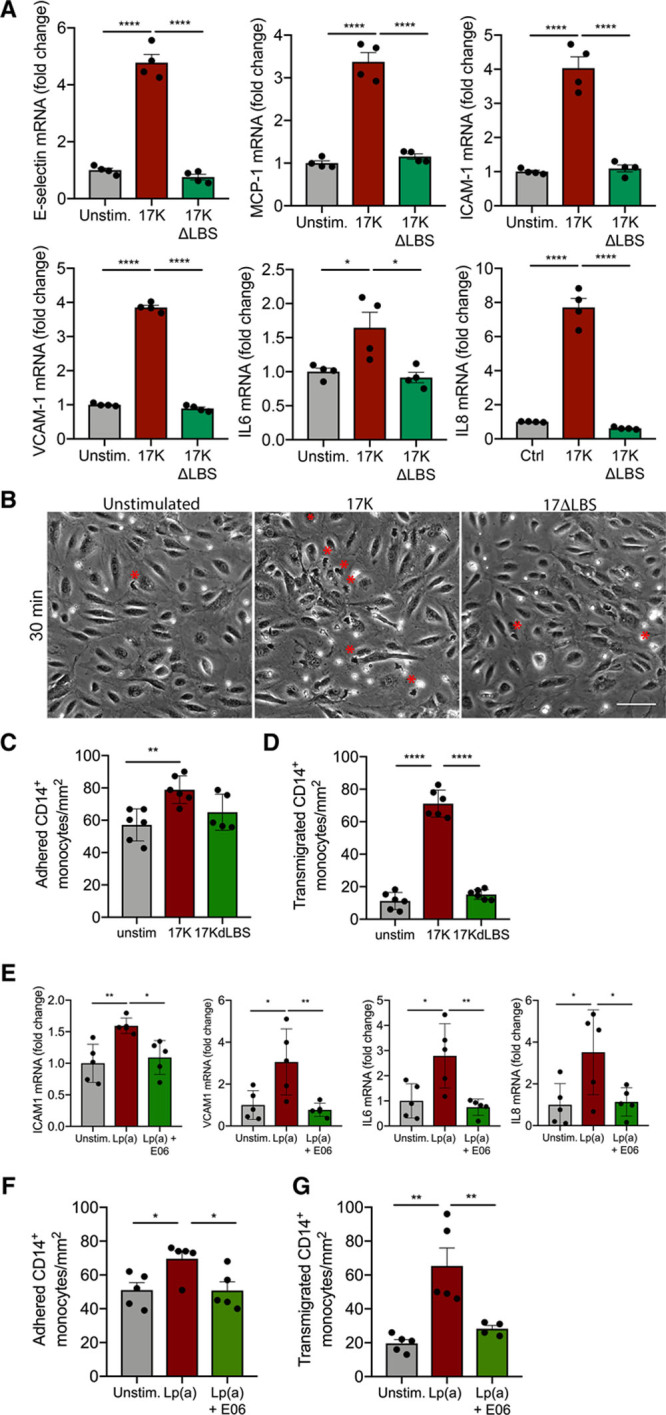
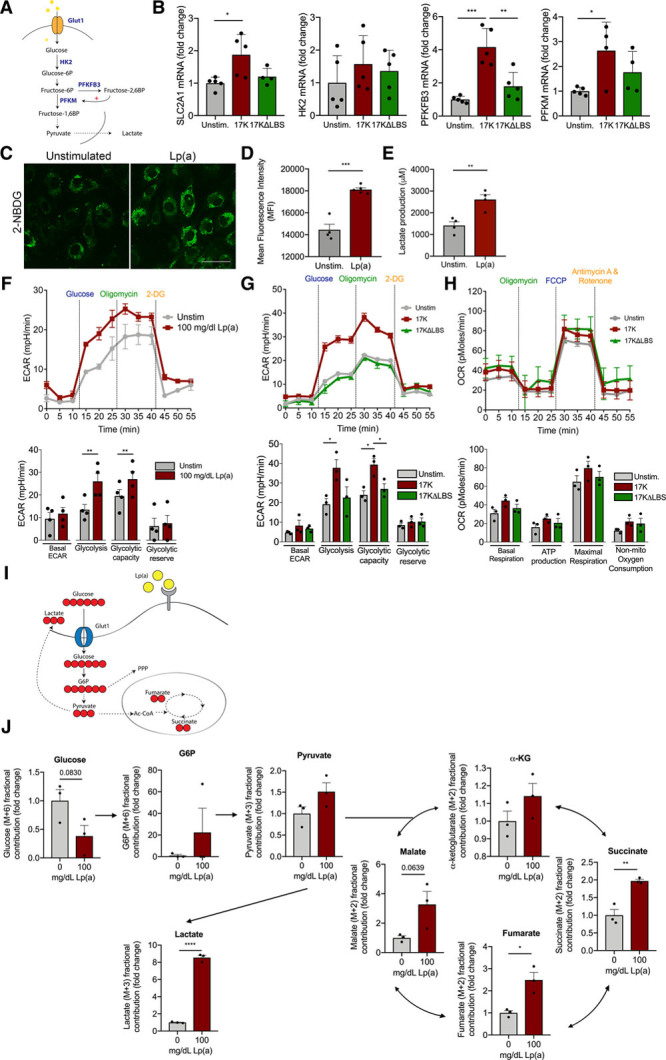
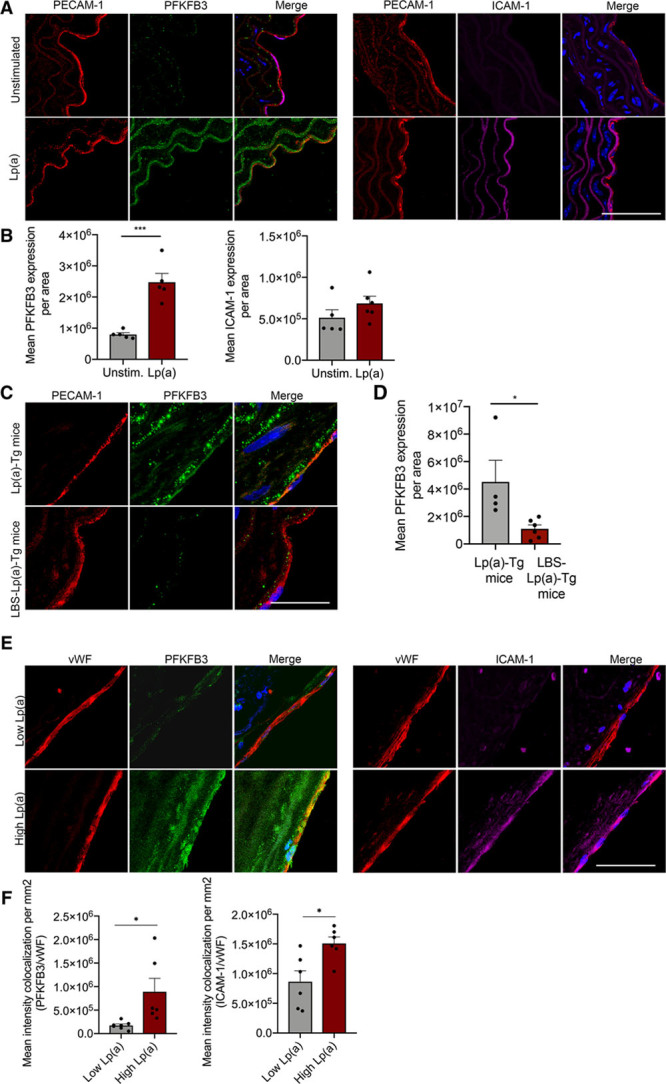
Methods and results: We evaluated the impact of Lp(a) on the endothelium and describe that Lp(a), through its oxidized phospholipid content, activates arterial endothelial cells, facilitating increased transendothelial migration of monocytes. Transcriptome analysis of Lp(a)-stimulated human arterial endothelial cells revealed upregulation of inflammatory pathways comprising monocyte adhesion and migration, coinciding with increased 6-phophofructo-2-kinase/fructose-2,6-biphosphatase (PFKFB)-3-mediated glycolysis. ICAM (intercellular adhesion molecule)-1 and PFKFB3 were also found to be upregulated in carotid plaques of patients with elevated levels of Lp(a). Inhibition of PFKFB3 abolished the inflammatory signature with concomitant attenuation of transendothelial migration.

Conclusions: Collectively, our findings show that Lp(a) activates the endothelium by enhancing PFKFB3-mediated glycolysis, leading to a proadhesive state, which can be reversed by inhibition of glycolysis. These findings pave the way for therapeutic agents targeting metabolism aimed at reducing inflammation in patients with cardiovascular disease.

Keywords: endothelial cell; glycolysis; inflammation; lipoprotein(a); metabolism.


Figures

Figure 1.
Figure 1.
Increased inflammation in Lp(a) (lipoprotein(a))-vs endothelial cells (ECs) facilitates excessive monocyte transmigration. A, Representative differential interference contrast images of transendothelial migration (TEM) in unstimulated ECs (left) compared with Lp(a)-stimulated ECs [Lp(a)-EC] for 18 h. Transmigrated monocytes are visualized as black cells with a red asterisk and adhered monocytes as white cells. White bar=200 μm. B, Quantification of adhered (n=6; P=0.0466) and (C) transmigrated monocytes (n=6; P=0.0014). Data were analyzed using 2-tailed Student unpaired t test. D, Heat map of selected genes involved in TEM and leukocyte chemotaxis of 5 mg/dL Lp(a)-EC compared with 100 mg/dL Lp(a)-EC (6 h stimulation; n=4). E, Schematic overview of the key steps and molecules involved in leukocyte TEM. F, Genes important in rolling and tethering of leukocytes are upregulated in Lp(a)-ECs relative to unstimulated ECs. Data were analyzed using 2-tailed Student unpaired t test (6 h stimulation; n=5; P=0.0253 for E-selectin; P=0.0008 for ICAM1; P=0.0333 for VCAM1). G, Chemotactic gene expression is elevated in Lp(a)-ECs compared with unstimulated ECs. Data were analyzed using 2-tailed Student unpaired t test (6 h stimulation; n=3 for IL6 and rest is n=5; P=0.0030 for MCP1; P=0.0025 for IL6; P=0.0368 for IL8). H, IL (interleukin)-6 and IL-8 cytokine secretion in cell medium increased in Lp(a)-ECs (n=4) vs unstimulated ECs (n=6). Data were analyzed using 2-tailed Student unpaired t test (P<0.0001 for IL-6; P<0.0001 for IL-8; 18 h stimulation). I, Representative immunoblot revealing increased EC ICAM (intercellular adhesion molecule)-1 protein expression after incubation with 100 mg/dL Lp(a) compared with unstimulated ECs (18 h stimulation). All data are mean±SEM. MCP-1 indicates monocyte chemoattractant protein 1; and VCAM-1, vascular adhesion molecule 1. *P<0.05, **P<0.005, ***P<0.0005, ****P<0.00005.
Figure 2.
Figure 2.
Oxidized phospholipids induce a proinflammatory EC phenotype and thereby facilitate monocyte transendothelial migration (TEM). A, Recombinant 17K apo(a) (apolipoprotein(a)) induces increased expression of TEM-associated genes (50 μg/mL; red bars). No differences were observed in ECs stimulated with 17KΔLBS (50 μg/mL; green bars). Data were analyzed using 1-way ANOVA with Tukey correction (for E-selectin, P<0.0001 for unstimulated vs 17K, P<0.0001 for 17K vs 17KΔLBS; for MCP1, P<0.0001 for unstimulated vs 17K, P<0.0001 for 17K vs 17KΔLBS; for ICAM1, P<0.0001 for unstimulated vs 17K, P<0.0001 for 17K vs 17KΔLBS; for VCAM1, P<0.0001 for unstimulated vs 17K, P<0.0001 for 17K vs 17KΔLBS; for IL6, P=0.037 for unstimulated vs 17K, P=0.0156 for 17K vs 17KΔLBS; for IL8, P<0.0001 for unstimulated vs 17K, P<0.0001 for 17K vs 17KΔLBS 6 h stimulation; n=4). B, Representative differential interference contrast (DIC) images of unstimulated ECs, 17K-stimulated ECs, and 17KΔLBS-stimulated HAECs. Transmigrated monocytes are visualized as black cells with a red asterisk and adhered monocytes as white cells (18 h stimulation; n=6; white bar=200 μm). C, Quantification of adhered monocytes. Data were analyzed using 1-way ANOVA with Tukey correction. P=0.0049 for unstimulated vs 17K (17K, red bars; 17KΔLBS, green bars) and (D) transmigrated monocytes. Data were analyzed using 1-way ANOVA with Tukey correction. P<0.0001 for unstimulated vs 17K, P<0.0001 for 17K vs 17KΔLBS (18 h stimulation; n=6). E, Monoclonal antibody E06 (100 μg/mL), decreased expression of ICAM1, VCAM1, IL6, and IL8 in Lp(a) (lipoprotein(a))-ECs (green bars) vs Lp(a)-ECs (red bars). Data were analyzed using 1-way ANOVA with Tukey correction. For ICAM1, P=0.0059 for unstimulated vs Lp(a), P=0.0173 for Lp(a) vs Lp(a)+E06; for VCAM1, P=0.0187 for unstimulated vs Lp(a), P=0.0099 for Lp(a) vs Lp(a)+E06; for IL6, P=0.0162 for unstimulated vs Lp(a), P=0.0070 for Lp(a) vs Lp(a)+E06; for IL8, P=0.0324 for unstimulated vs Lp(a), P=0.0431 for Lp(a) vs Lp(a)+E06 (6 h stimulation; n=5). F, ECs incubated with 100 mg/dL Lp(a) increased monocyte adhesion (red bars) but coincubation with E06 diminished Lp(a)-induced adhesion (green bars). Data were analyzed using 1-way ANOVA with Tukey correction. P=0.0342 for unstimulated vs Lp(a), P=0.0324 for Lp(a) vs Lp(a)+E06 (18 h stimulation; n=5). G, Monocyte TEM was increased when ECs were incubated with 100 mg/dL Lp(a) (red bars) and decreased after coincubation with E06 (green bars). Data were analyzed using 1-way ANOVA with Tukey correction. P=0.0014 for unstimulated vs Lp(a), P=0.0095 for Lp(a) vs Lp(a)+E06 (18 h stimulation; n=5). All data are mean±SEM. 17K indicates 17K recombinant apolipoprotein(a); 17KΔLBS, 17K recombinant apolipoprotein(a) with a mutation in the lysine-binding site; E06, murine IgM monoclonal antibody E06 that binds the PC moiety of oxidized phospholipids; ICAM-1, intercellular adhesion molecule 1; IL, interleukin 6; MCP-1, monocyte chemoattractant protein 1; and VCAM-1, vascular adhesion molecule 1. *P<0.05, **P<0.005, ***P<0.0005, ****P<0.00005.
Figure 3.
Figure 3.
Glycolysis drives inflammation in Lp(a) (lipoprotein(a))-ECs. A, Schematic overview of the EC glycolytic pathway and its key enzymes in blue. B, Glycolytic gene expression profiles of unstimulated EC (gray bars) vs 17K- (red bars) vs 17KΔLBS-stimulated ECs (green bars). Data were analyzed using 1-way ANOVA with Tukey correction. For SLC2A1, P=0.0204 for unstimulated vs 17K; for PFBFB3, P=0.0002 for unstimulated vs 17K, P=0.0013 for 17K vs 17KΔLBS; for PFKM(6-phosphofructokinase, muscle), P=0.0332 for unstimulated vs 17K (18 h incubation; n=5). C, Representative image of unstimulated ECs (left) and Lp(a)-ECs (right), incubated with 50 μM 2-(N-[7-nitrobenz-2-oxa-1,3-diazol-4-yl]amino)-2-deoxyglucose (2-NBDG) for 2 h (18 h incubation with Lp(a); n=4; white bar=200 μm). D, Flow cytometric analysis of 2-NBDG uptake (2 h) of unstimulated (gray bar) and Lp(a)-stimulated ECs (red bar). Data were analyzed using 2-tailed Student unpaired t test, P=0.0001 (18 h incubation with Lp(a); 2 h incubation with 50 μM 2-NBDG; n=4). E, Lactate production of unstimulated ECs (gray bars) compared with Lp(a)-ECs. Data were analyzed using 2-tailed Student unpaired t test, P=0.0052 (red bars; n=4). F, Glycolytic flux measurement by Seahorse Flux Analysis of unstimulated ECs (gray line) and Lp(a)-ECs (red line) by recording extracellular acidification rate (ECAR) after injection of glucose, oligomycin, and 2-deoxyglucose (2-DG). Glycolytic rate plotted in a bar graph comparing unstimulated ECs (green bars) with Lp(a)-ECs (red bars). Data were analyzed using 2-tailed Student unpaired t test. For glycolysis, P=0.0075; for glycolytic capacity, P=0.0043 (18 h incubation; n=4). G, Graph (left) and bar graph of glycolytic flux of unstimulated (gray line; gray bars), 17K (red line; red bars), and 17KΔLBS (green line; green bars). Data were analyzed using 1-way ANOVA with Tukey correction. For glycolysis, P=0.0494 for unstimulated vs 17K; for glycolytic capacity, P=0.0139 for unstimulated vs 17K, P=0.0354 for 17K vs 17KΔLBS (18 h incubation; n=3). H, Oxidative phosphorylation parameters assessed by recording oxygen consumption rate (OCR) after injection of oligomycin, carbonyl cyanide-4-(trifluoromethoxy)phenylhydrazone (FCCP), and rotenone. Unstimulated (gray line; gray bars), 17K (red line; red bars), and 17KΔLBS (green line; green bars; 18 h incubation; n=3). I, Schematic overview of 13C-glucose flux analysis in ECs. J, Bar graphs showing the 13C metabolic flux analysis with and without 100 mg/dL Lp(a) stimulation after 30-min incubation with isotopically labeled glucose. Arrows indicate the flux. Normalized fractional contribution of intracellular glucose, glucose-6-phosphate (G6P), pyruvate, lactate, α-ketoglutarate (α-KG), succinate, malate, and fumarate. Data were analyzed using 2-tailed Student unpaired t test. For succinate, P=0.0047; for fumarate, P=0.0149; for lactate, P<0.0001 (18 h incubation with Lp(a); n=3). All data are mean±SEM. 17K indicates 17K recombinant apolipoprotein(a); 17KΔLBS, 17K recombinant apolipoprotein(a) with a mutation in the lysine-binding site; GLUT1, glucose transporter 1; HK2, hexokinase 2; MFI, mean fluorescent intensity; and PFKFB3, 6-phophofructo-2-kinase/fructose-2,6-biphosphatase. *P<0.05, **P<0.005, ***P<0.0005.
Figure 4.
Figure 4.
6-Phophofructo-2-kinase/fructose-2,6-biphosphatase (PFKFB3) expression is increased in murine vessels upon Lp(a) (lipoprotein(a)) stimulation. A, Representative images of murine WT (wild type) aortas ex vivo stimulated with (lower images; n=5) and without (upper images; n=6) 100 mg/dL Lp(a) stimulation. Nuclei were stained with DAPI (4′,6-diamidino-2-phenylindole; blue); ECs are stained with PECAM-1 (platelet endothelial cell adhesion molecule 1; red), PFKFB3 (green), and ICAM (intercellular adhesion molecule)-1 (magenta; 18 h incubation; white bar=200 μm). B, Quantification of A. Data were analyzed using 2-tailed Student unpaired t test, P=0.0004. C, Representative images of aortas derived from Lp(a) mice [Lp(a)-Tg; n=4] and mice lacking the lysine-binding site, which, therefore, cannot carry oxidized phospholipids (LBS-Lp(a)-Tg; n=6) stained for PECAM-1 (red) and PFKFB3 (green); nuclei were stained with DAPI (blue; white bar=200 μm). D, Quantification of C; EC PFKFB3 expression in aortas of Lp(a)-Tg and LBS-Lp(a)-Tg mice on a chow diet. Data were analyzed using 2-tailed Student unpaired t test, P=0.0354. E, Images representing human carotid plaques derived from patients with low Lp(a) vs high Lp(a) levels. Nuclei were stained with DAPI (blue); ECs are stained with vWF (von Willebrand factor; red), PFKFB3 (green), and ICAM-1 (magenta; n=6 per group; white bar=200 μm). F, Quantification of E. Data were analyzed using 2-tailed Student unpaired t test; for PFKFB3, P=0.0206; for ICAM-1, P=0.0134. All data are mean±SEM. *P<0.05, ***P<0.0005.
Figure 5.
Figure 5.
Inhibition with PFK158 suppresses the glycolytic tone of Lp(a) (lipoprotein(a))-ECs and thereby inflammation. A, Heat map of transendothelial migration (TEM)–associated genes in Lp(a)-ECs with (n=3) and without (n=4) inhibition by 5 μM PFK158 (6 h incubation). B, Gene expression of Lp(a)-ECs knocked down for 6-phophofructo-2-kinase/fructose-2,6-biphosphatase (PFKFB3; n=6) and treated with siCtrl (n=7). Data were analyzed using 2-tailed Student unpaired t test. For PFKFB3, P<0.00001; for ICAM1, P<0.00001; for IL6, P<0.00001; for IL8, P<0.0003 (100 mg/dL Lp(a); 6 h incubation). C, Cytokine production of unstimulated (gray bars) and 100 mg/dL stimulated ECs (red bars) with and without 5 μM PFK158. Data were analyzed using 2-way ANOVA with Tukey correction. For MCP-1 (monocyte chemoattractant protein 1), P=0.0004 0 vs 100 mg/dL Lp(a) (−PFK158); P=0.0170 0 (−PFK158) vs 0 (+PFK158) mg/dL Lp(a); P<0.0001 100 (−PFK158) vs 0 (+PFK158) mg/dL Lp(a); P<0.0001 100 (−PFK158) vs 100 (+PFK158) mg/dL Lp(a). For IL (interleukin)-6, P=0.0044 0 vs 100 mg/dL Lp(a) (−PFK158); P=0.0039 100 (−PFK158) vs 0 (+PFK158) mg/dL Lp(a); P=0.0353 100 (−PFK158) vs 100 (+PFK158) mg/dL Lp(a). For IL-8, P<0.0001 0 vs 100 (−PFK158) mg/dL Lp(a); P=0.0476 0 (−PFK158) vs 0 (+PFK158) mg/dL Lp(a); P<0.0001 0 (−PFK158) vs 100 (+PFK158) mg/dL Lp(a); P<0.0001 100 (−PFK158) vs 0 (+PFK158) mg/dL Lp(a); P<0.0001 0 (+PFK158) vs 100 (+PFK158) mg/dL Lp(a) (18 h incubation; n=4 for MCP-1; n=5 for IL-6 and IL-8). D, Representative immunoblots of ICAM (intercellular adhesion molecule)-1, Glut1, PFKFB3, and HIF1α (hypoxia inducible factor 1α) protein expression. E, Quantification of immunoblots of ICAM-1 (upper left graph), GLUT1 (glucose transporter 1; lower left graph), PFKFB3 (upper right graph), and HIF-1α (lower right graph) in Lp(a)-ECs (red bars) and 5 μM PFK158-treated Lp(a)-ECs (light gray bars). Actin was used as loading control (100 mg/dL Lp(a); 18 h incubation; n=3). Data were analyzed using 1-way ANOVA with Tukey correction. For ICAM-1, P=0.0315 unstimulated vs Lp(a); for PFKFB3, P=0.0226 unstimulated vs Lp(a) and P=0.0416 unstimulated vs Lp(a)+PFK158; for GLUT1, P=0.0065 unstimulated vs Lp(a) and P=0.0040 Lp(a) vs Lp(a)+PFK158; for HIF-1α, P=0.0021 unstimulated vs Lp(a) and P=0.0026 Lp(a) vs Lp(a)+PFK158. F, Aortas of WT (wild type) mice ex vivo incubated with 100 mg/dL Lp(a) and 100 mg/dL Lp(a)+5 μM PFK158 (nuclei were stained with DAPI [4′,6-diamidino-2-phenylindole; blue], ECs with PECAM-1 [platelet endothelial cell adhesion molecule 1; red], and PFKFB3 was stained [green]; 18 h incubation; n=5; white bar=100 μm). G, Extracellular acidification rate (ECAR) of unstimulated ECs (gray line/bar), Lp(a)-ECs (red line/bar), Lp(a)-ECs+PFK158 (light gray line/bar), and ECs stimulated with only 5 μM PFK158 (orange line/bar; 100 mg/dL Lp(a); 18 h incubation; n=3). H, Representative DIC images TEM assay with unstimulated ECs (upper left), 100 mg/dL ECs (upper right), Lp(a)+PFK158-stimulated ECs (lower right), and ECs incubated with 5 μM PFK158 (lower left; 18 h incubation; white bar=200 µm). I, Quantification of H; transmigrated monocytes through Lp(a)-ECs coincubated with and without 5 μM PFK158. Gray bars indicate unstimulated ECs, red bar shows Lp(a)-ECs, light gray indicates Lp(a)-ECs coincubated with PFK158, and white bars represent PFK158-stimualted ECs. Data were analyzed using 2-way ANOVA with Tukey correction. P<0.0001 0 vs 100 (−PFK158) mg/dL Lp(a); P<0.0001 100 (−PFK158) vs 0 (+PFK158) mg/dL Lp(a); P<0.0001 100 (−PFK158) vs 100 (+PFK158) vs 100 mg/dL Lp(a) (18 h incubation; n=5). All data are mean±SEM. 2-DG indicates 2-deoxyglucose. *P<0.05, **P<0.005, ***P<0.0005, ****P<0.00005.
Figure 6.
Figure 6.
A strong Lp(a) (lipoprotein(a)) decrease in human serum partly reduces inflammatory and glycolytic mediators in ECs. A, Gene expression of ECs incubated with serum derived from subjects with elevated Lp(a) of the IONIS-APO(a)Rx study (1:1 incubation with endothelial growth medium). Data were analyzed using repeated measures 1-way ANOVA with Tukey correction. For ICAM1, P=0.0026 D01 vs D190; for VCAM1, P=0.0338 D01 vs D85; for MCP1, P=0.0026 D01 vs D85 and P=0.0474 D85 vs D190; for IL6, P=0.0234 D01 vs D85 and P=0.0006 D01 vs D190 (black bars, D01; gray bars, D85; anthracite bars, D190; n=6; 6 h incubation). B, Glycolytic gene expression of PFKFB3, SLC2A1, and PFKM (6-phosphofructokinase, muscle) revealed a decrease after Lp(a) lowering in human serum (1:1 incubation with endothelial growth medium). Data were analyzed using repeated measures 1-way ANOVA with Tukey correction. For 6-phophofructo-2-kinase/fructose-2,6-biphosphatase (PFKFB3), P=0.0196 D01 vs D85 and P=0.0276 D01 vs D190 (n=6; 6 h incubation). C, MCP (monocyte chemoattractant protein 1)-1, IL (interleukin)-6, and IL-8 secretion in medium of ECs incubated with human serum before and after Lp(a) lowering. Data were analyzed using repeated measures 1-way ANOVA with Tukey correction. For MCP-1, P=0.0180 D01 vs D85 and P=0.0017 D85 vs D190; for IL-6, P=0.0238 D01 vs D85 (n=6; 18 h incubation). D, Lactate secretion in medium of ECs incubated with human serum before and after Lp(a)-lowering therapy. Data were analyzed using repeated measures 1-way ANOVA with Tukey correction. P=0.0160 D01 vs D85 (n=6; 18 h incubation). All data are mean±SEM. D01 indicates baseline; D85, day 85; D190, day 190; ICAM-1, intercellular adhesion molecule 1; and VCAM-1, vascular adhesion molecule 1. *P<0.05, **P<0.005, ***P<0.0005.

Comment in

  • Lipoprotein(a) Gets Worse.
    Pamir N, Fazio S. Pamir N, et al. Circ Res. 2020 May 8;126(10):1360-1362. doi: 10.1161/CIRCRESAHA.120.316980. Epub 2020 May 7. Circ Res. 2020. PMID: 32379575 Free PMC article. No abstract available.

References

    1. Bergmark C, Dewan A, Orsoni A, Merki E, Miller ER, Shin MJ, Binder CJ, Hörkkö S, Krauss RM, Chapman MJ, et al. A novel function of lipoprotein [a] as a preferential carrier of oxidized phospholipids in human plasma. J Lipid Res. 2008;49:2230–2239. doi: 10.1194/jlr.M800174-JLR200. - PubMed
    1. Tsimikas S. A test in context: lipoprotein(a): diagnosis, prognosis, controversies, and emerging therapies. J Am Coll Cardiol. 2017;69:692–711. doi: 10.1016/j.jacc.2016.11.042. - PubMed
    1. Que X, Hung MY, Yeang C, Gonen A, Prohaska TA, Sun X, Diehl C, Määttä A, Gaddis DE, Bowden K, et al. Oxidized phospholipids are proinflammatory and proatherogenic in hypercholesterolaemic mice. Nature. 2018;558:301–306. doi: 10.1038/s41586-018-0198-8. - PMC - PubMed
    1. van der Valk FM, Bekkering S, Kroon J, Yeang C, Van den Bossche J, van Buul JD, Ravandi A, Nederveen AJ, Verberne HJ, Scipione C, et al. Oxidized phospholipids on lipoprotein(a) elicit arterial wall inflammation and an inflammatory monocyte response in humans. Circulation. 2016;134:611–624. doi: 10.1161/CIRCULATIONAHA.116.020838. - PMC - PubMed
    1. Nordestgaard BG, Langsted A. Lipoprotein (a) as a cause of cardiovascular disease: insights from epidemiology, genetics, and biology. J Lipid Res. 2016;57:1953–1975. doi: 10.1194/jlr.R071233. - PMC - PubMed

Publication types

MeSH terms