

Geographical tracking and mapping of coronavirus disease COVID-19/severe acute respiratory syndrome coronavirus 2 (SARS-CoV-2) epidemic and associated events around the world: how 21st century GIS technologies are supporting the global fight against outbreaks and epidemics
- PMID: 32160889
- PMCID: PMC7065369
- DOI: 10.1186/s12942-020-00202-8
Geographical tracking and mapping of coronavirus disease COVID-19/severe acute respiratory syndrome coronavirus 2 (SARS-CoV-2) epidemic and associated events around the world: how 21st century GIS technologies are supporting the global fight against outbreaks and epidemics
Abstract
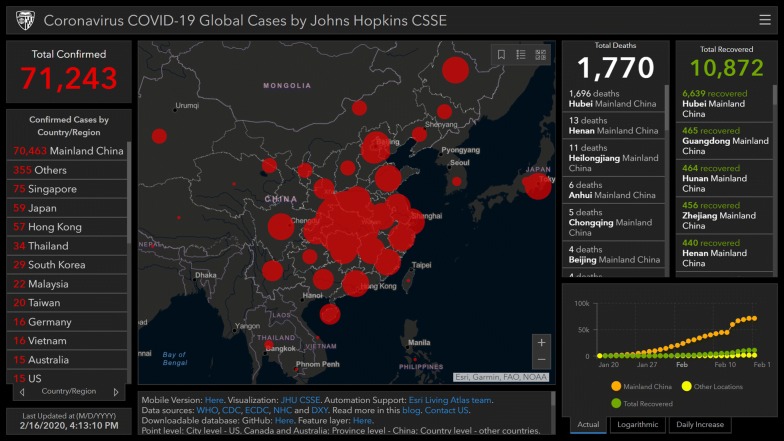
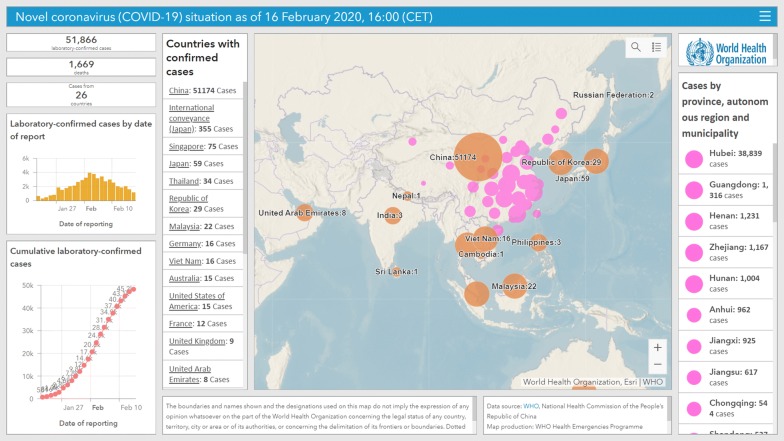
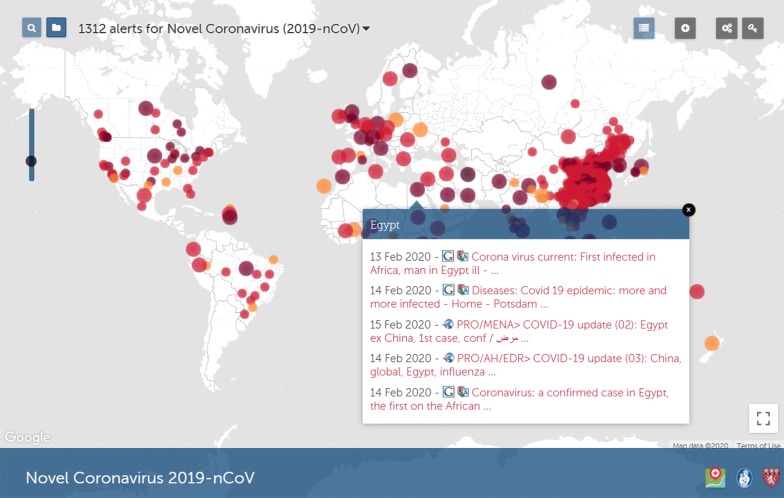
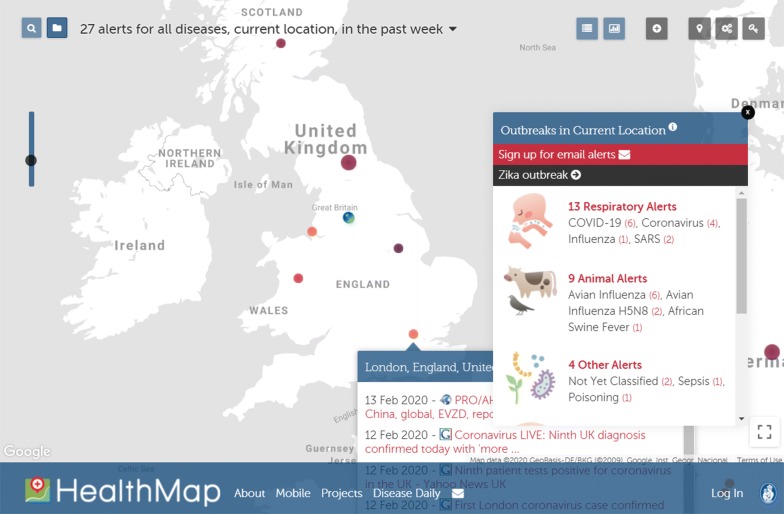
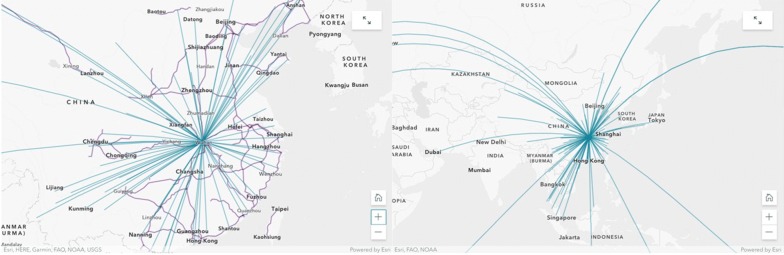
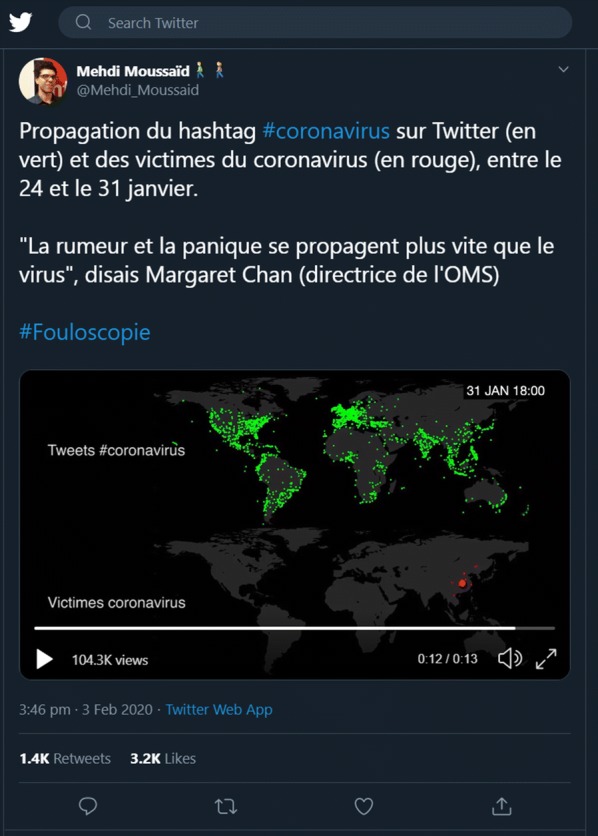
In December 2019, a new virus (initially called 'Novel Coronavirus 2019-nCoV' and later renamed to SARS-CoV-2) causing severe acute respiratory syndrome (coronavirus disease COVID-19) emerged in Wuhan, Hubei Province, China, and rapidly spread to other parts of China and other countries around the world, despite China's massive efforts to contain the disease within Hubei. As with the original SARS-CoV epidemic of 2002/2003 and with seasonal influenza, geographic information systems and methods, including, among other application possibilities, online real-or near-real-time mapping of disease cases and of social media reactions to disease spread, predictive risk mapping using population travel data, and tracing and mapping super-spreader trajectories and contacts across space and time, are proving indispensable for timely and effective epidemic monitoring and response. This paper offers pointers to, and describes, a range of practical online/mobile GIS and mapping dashboards and applications for tracking the 2019/2020 coronavirus epidemic and associated events as they unfold around the world. Some of these dashboards and applications are receiving data updates in near-real-time (at the time of writing), and one of them is meant for individual users (in China) to check if the app user has had any close contact with a person confirmed or suspected to have been infected with SARS-CoV-2 in the recent past. We also discuss additional ways GIS can support the fight against infectious disease outbreaks and epidemics.
Keywords: COVID-19; GIS; SARS-CoV-2.
Conflict of interest statement
MNKB is Editor-in-Chief of International Journal of Health Geographics. EG is Chief Medical Officer of Esri, whose ArcGIS products have been used in some of the dashboard examples described in this article.
Figures


References
-
- Chinese Center for Disease Control and Prevention (CCDC). The Epidemiological Characteristics of an Outbreak of 2019 Novel Coronavirus Diseases (COVID-19)–China. 2020. http://weekly.chinacdc.cn/en/article/id/e53946e2-c6c4-41e9-9a9b-fea8db1a...17 Feb 2020.
-
- World Health Organization. Statement on the second meeting of the International Health Regulations Emergency Committee regarding the outbreak of novel coronavirus (2019-nCoV), Geneva, Switzerland, 30 January 2020. 2005. https://www.who.int/news-room/detail/30-01-2020-statement-on-the-second-...).
-
- U.S. Centers for Disease Control and Prevention (CDC). 2019–2020 U.S. Flu Season: Preliminary Burden Estimates. https://www.cdc.gov/flu/about/burden/preliminary-in-season-estimates.htm.
-
- Public Health England. Weekly national flu reports: 2019 to 2020 season. https://www.gov.uk/government/statistics/weekly-national-flu-reports-201....
Publication types
MeSH terms
LinkOut - more resources
Full Text Sources
Other Literature Sources
Miscellaneous
