. 2020 Mar 24;117(12):6640-6650.
doi: 10.1073/pnas.1921445117. Epub 2020 Mar 11.

Tumor cell-intrinsic PD-1 receptor is a tumor suppressor and mediates resistance to PD-1 blockade therapy

Affiliations

Tumor cell-intrinsic PD-1 receptor is a tumor suppressor and mediates resistance to PD-1 blockade therapy

Xiaodong Wang et al. Proc Natl Acad Sci U S A. .

Abstract

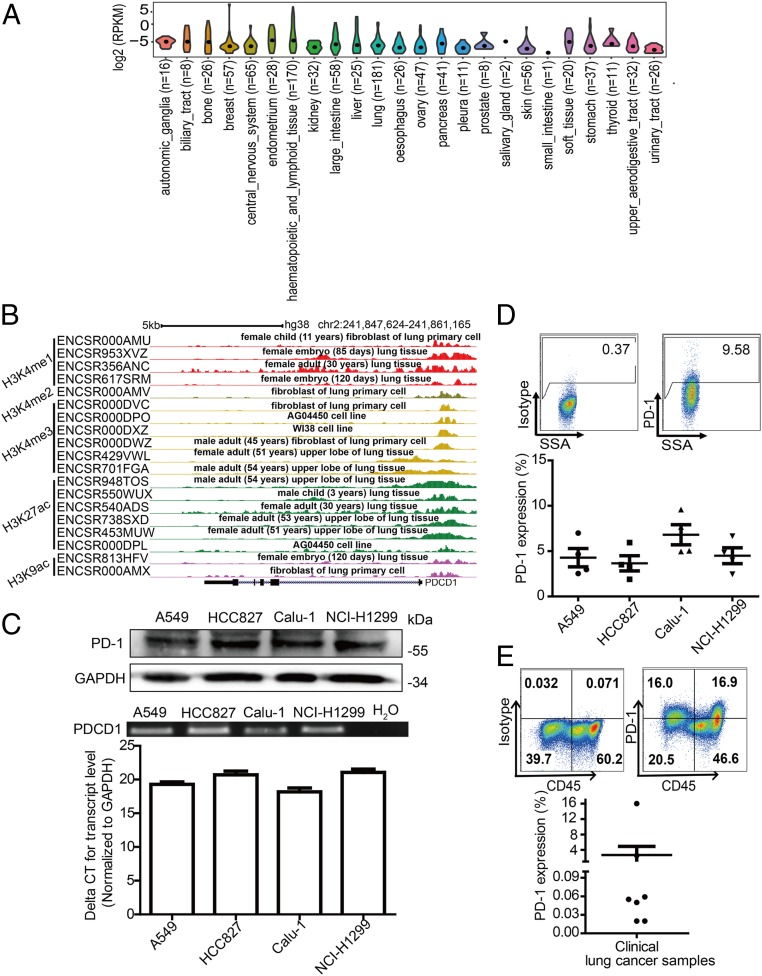
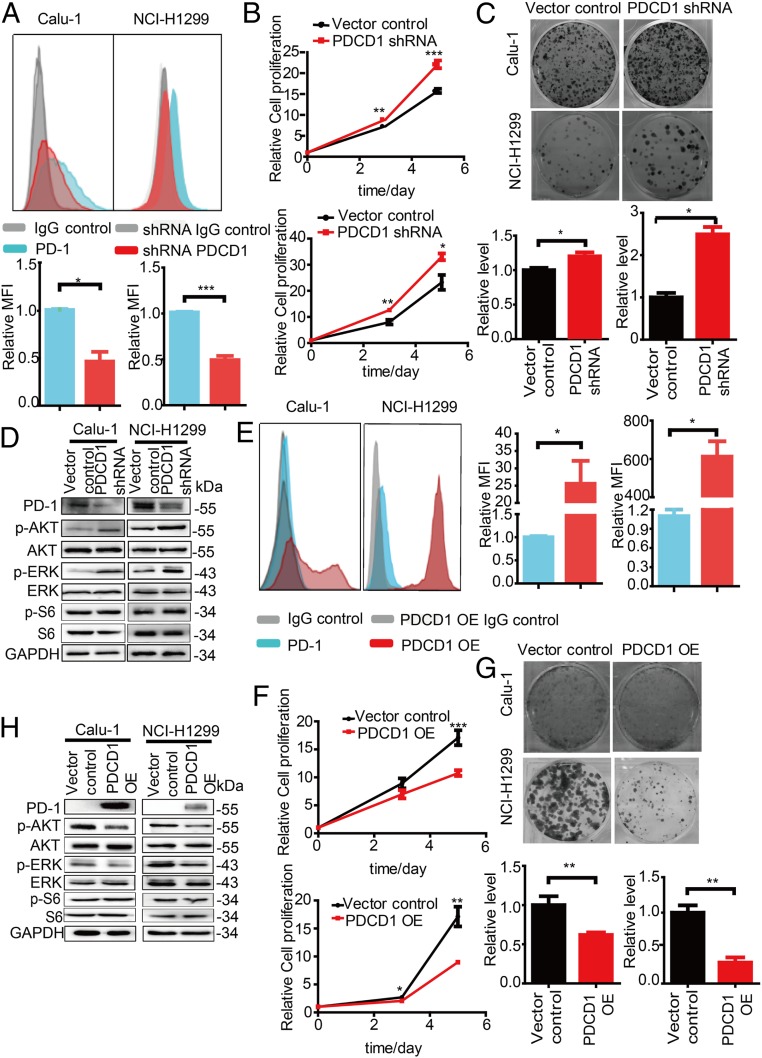
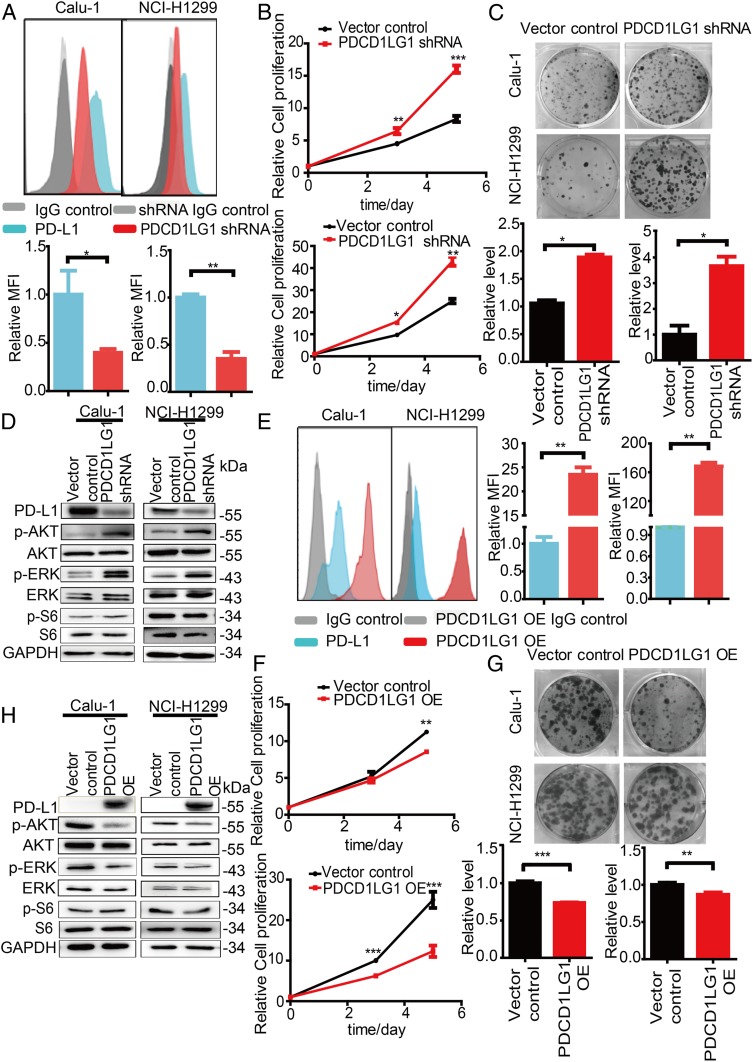
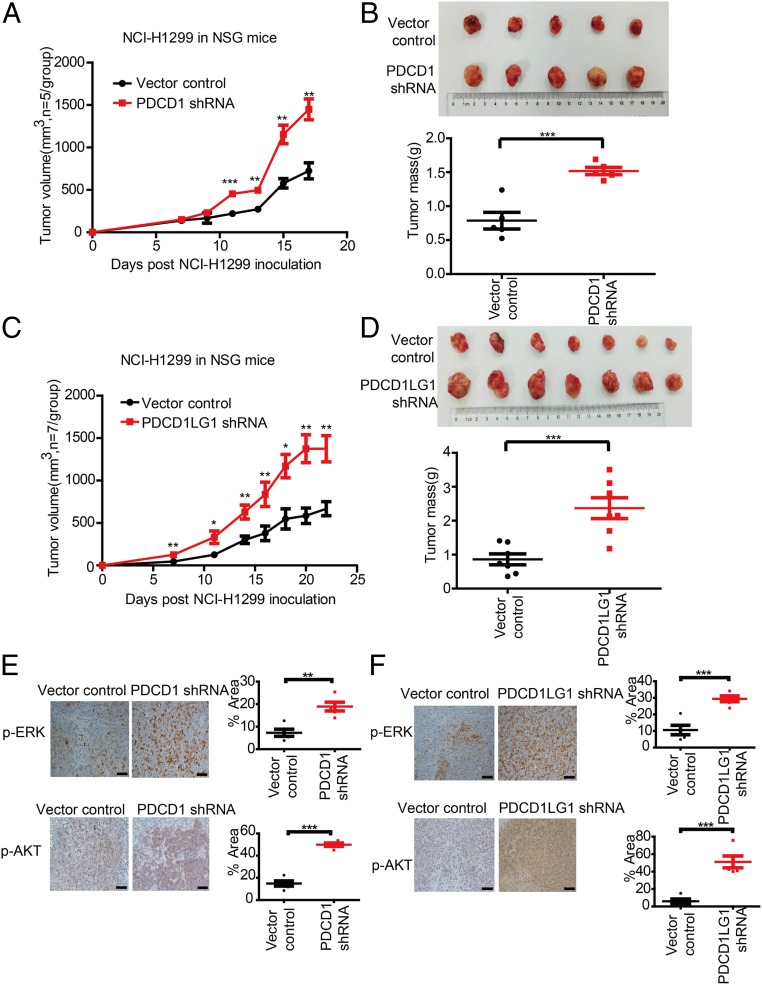
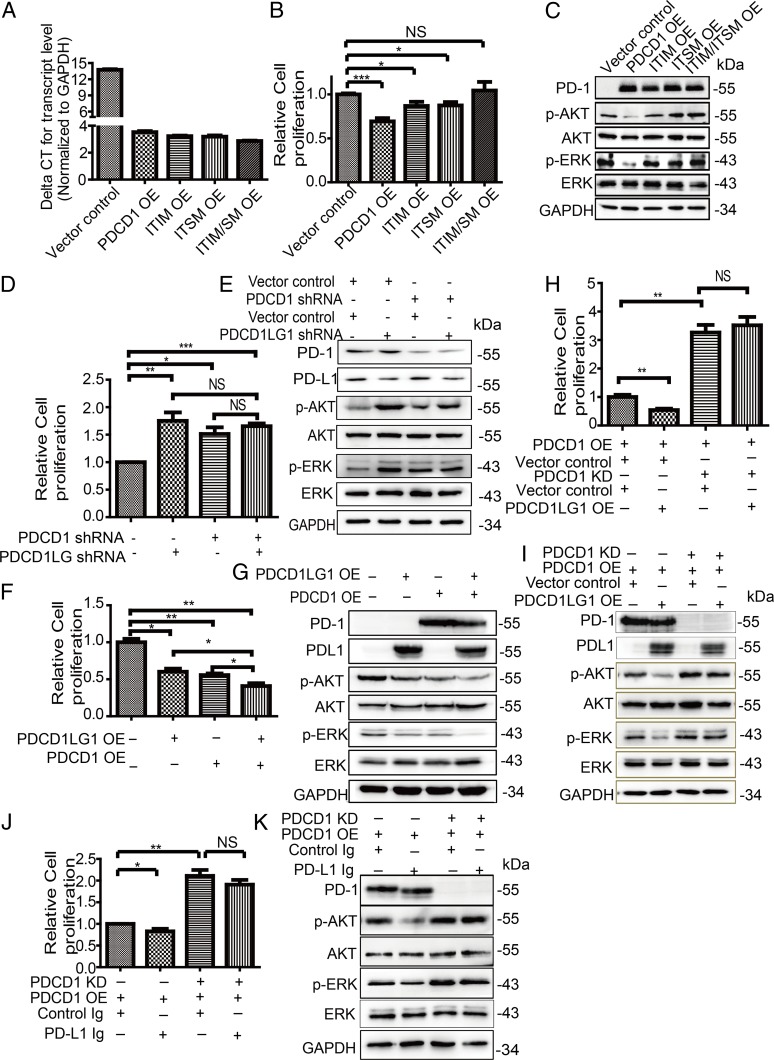
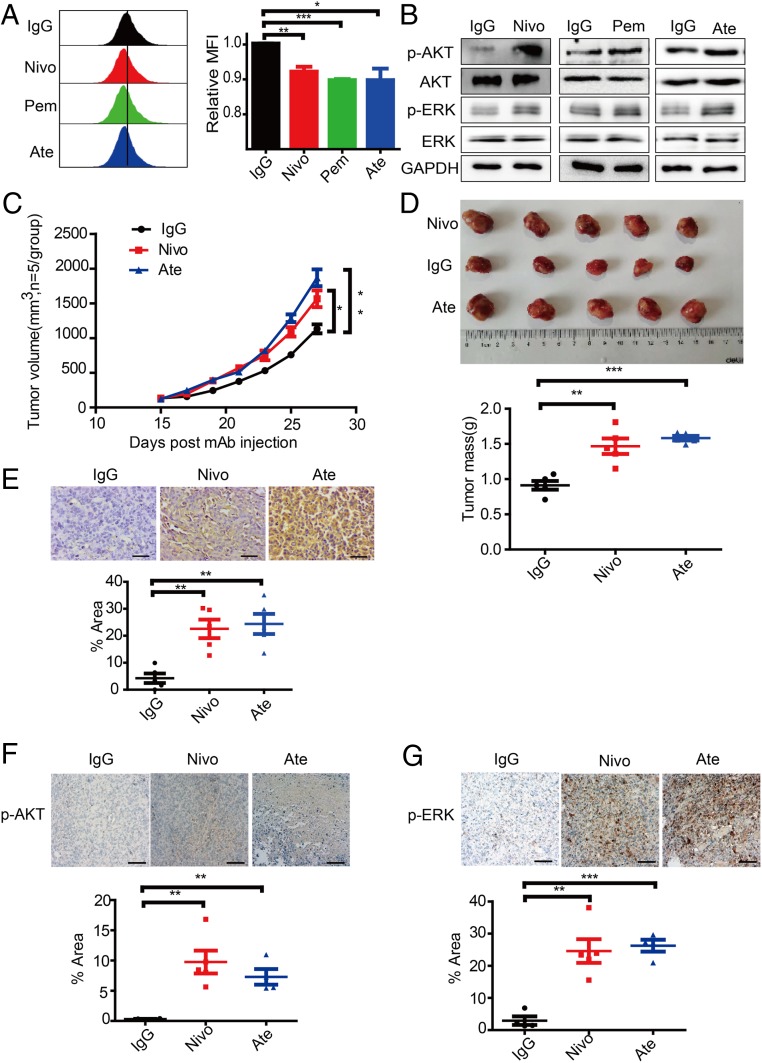
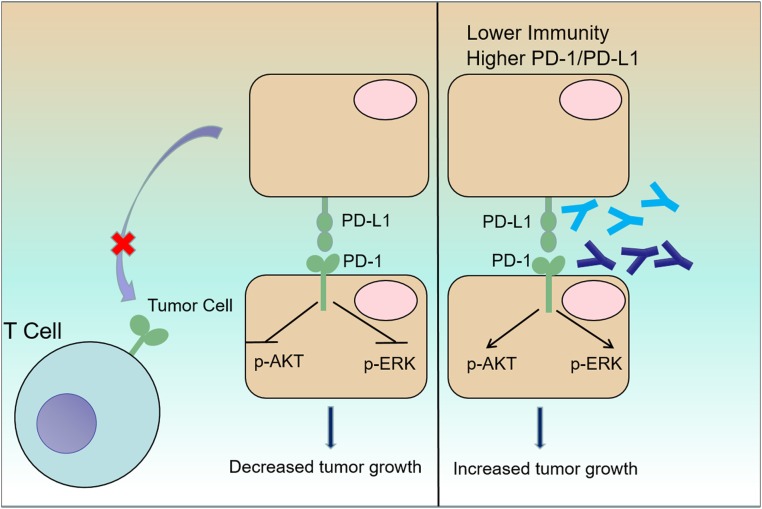
The programmed cell death 1 (PD-1) receptor on the surface of immune cells is an immune checkpoint molecule that mediates the immune escape of tumor cells. Consequently, antibodies targeting PD-1 have shown efficacy in enhancing the antitumor activity of T cells in some types of cancers. However, the potential effects of PD-1 on tumor cells remain largely unknown. Here, we show that PD-1 is expressed across a broad range of tumor cells. The silencing of PD-1 or its ligand, PD-1 ligand 1 (PD-L1), promotes cell proliferation and colony formation in vitro and tumor growth in vivo. Conversely, overexpression of PD-1 or PD-L1 inhibits tumor cell proliferation and colony formation. Moreover, blocking antibodies targeting PD-1 or PD-L1 promote tumor growth in cell cultures and xenografts. Mechanistically, the coordination of PD-1 and PD-L1 activates its major downstream signaling pathways including the AKT and ERK1/2 pathways, thus enhancing tumor cell growth. This study demonstrates that PD-1/PD-L1 is a potential tumor suppressor and potentially regulates the response to anti-PD-1/PD-L1 treatments, thus representing a potential biomarker for the optimal cancer immunotherapeutic treatment.

Keywords: biomarker; drug resistance; tumor cell-intrinsic PD-1; tumor cell-intrinsic PD-L1; tumor suppressor.


Conflict of interest statement

Competing interest statement: G.F.G. and C.X. are both members of the Strategic Priority Research Program of the Chinese Academy of Sciences (CAS). G.F.G. and C.X. have not collaborated directly in this position.

Figures

Fig. 1.
Fig. 1.
PD-1 expression by tumor cells. (A) Violin plots showing the expression levels of PDCD1 in various kinds of cancer cells based on data from Cancer Cell Line Encyclopedia (CCLE). The black dot indicates the median. (B) The relative binding enrichments of H3K4me1, H3K4me2, H3K4me3, H3K27ac, and H3K9ac around the PDCD1 gene determined from the indicated datasets of the Encyclopedia of DNA Elements (ENCODE) database. (C) Immunoblot for PD-1 protein expression (Top), and RT-PCR (Middle) and qRT-PCR (Bottom) expression analysis of PDCD1 mRNA levels in lung cancer cell lines. (D) Representative flow cytometry plots (Top) and percentages (mean ± SDs [SD], Bottom) of PD-1 surface protein expression on human lung cancer cell lines (n = 4 independent experiments, respectively). Different shapes represent different cancer cell lines. (E) Representative flow cytometry plots (Top) and percentages (mean ± SD, Bottom) of PD-1 surface protein expression on clinical tumor biopsy-derived lung cancer cells from n = 7 distinct lung cancer patients.
Fig. 2.
Fig. 2.
Inhibition of tumor growth by tumor cell-intrinsic PD-1. (A) Representative flow cytometry plots showing changes in the PD-1 levels on the cell surface of Calu-1 and NCI-H1299 cells 72 h after transfection with the indicated plasmids (Top). Quantitation of PD-1 surface levels is shown as the mean fluoresce intensity (MFI) (Bottom). (B) A Cell Titer-Glo Luminescent Cell Viability (CTG) assay for the cell proliferation of Calu-1 (Top) and NCI-H1299 (Bottom) cells transfected with the indicated shRNAs. (C) Representative images of a colony formation assay (Top) and quantification data (down) for Calu-1 (Left) and NCI-H1299 (Right) cells transfected with the indicated shRNAs. (D) Immunoblot analysis of the indicated proteins in cells transfected with the indicated plasmids. (E) Representative flow cytometry plots showing changes in the PD-1 levels on the cell surface of Calu-1 and NCI-H1299 cells 72 h after transfection with the indicated plasmids (Left). Quantitation of PD-1 surface levels is shown as MFI (Right). (F) The CTG assay assessing the cell proliferation of Calu-1 (Top) and NCI-H1299 (Bottom) cells transfected with the indicated shRNAs. (G) Representative images of a colony formation assay (Top) and quantification data (down) for Calu-1 (Left) and NCI-H1299 (Right) cells transfected with the indicated shRNAs. (H) Immunoblot analysis of the indicated proteins in cells transfected with the indicated plasmids. Data are presented as the mean ± SD from three independent experiments. *P < 0.05, **P < 0.01, ***P < 0.01.
Fig. 3.
Fig. 3.
Inhibition of tumor growth by tumor cell-intrinsic PD-L1. (A) Representative flow cytometry plots showing changes in the PD-L1 levels on the cell surface of Calu-1 and NCI-H1299 cells 72 h after transfection with the indicated plasmids (Top). Quantitation of PD-L1 surface levels is shown as the MFI (Bottom). (B) The CTG assay assessing the cell proliferation of Calu-1 (Top) and NCI-H1299 (Bottom) cells transfected with the indicated shRNAs. (C) Representative images from a colony formation assay (Top) and quantification data (Bottom) for Calu-1 (Left) and NCI-H1299 (Right) cells transfected with the indicated shRNAs. (D) Immunoblot analysis of the indicated proteins for cells transfected with the indicated plasmids. (E) Representative flow cytometry plots showing changes in the PD-L1 levels on the cell surface of Calu-1 and NCI-H1299 cells 72 h after transfection with the indicated plasmids (Left). Quantitation of PD-L1 surface levels is shown as the MFI (Right). (F) The CTG assay assessing the cell proliferation of Calu-1 (Top) and NCI-H1299 (Bottom) cells transfected with the indicated shRNAs. (G) Representative images of a colony formation assay (Top) and quantification data (Bottom) for Calu-1 (Left) and NCI-H1299 (Right) cells transfected with the indicated shRNAs. (H) Immunoblot analysis of the indicated proteins in cells transfected with the indicated plasmids. Data are presented as mean ± SD from three independent experiments. *P < 0.05, **P < 0.01, ***P < 0.001.
Fig. 4.
Fig. 4.
Knockdown of PDCD1/PDCD1LG1 promotes in vivo tumor growth and enhances AKT and ERK1/2 activities. (A and C) Effects of the indicated plasmids transfected into NCI-H1299 cells on tumor growth in s.c. implanted NSG mice. (B and D) Tumor size (Top) and mass (Bottom) in NSG mice s.c. implanted with NCI-H1299 cells transfected with PDCD1 (n = 5) and PDCD1LG1 (n = 7) knockdown versus those s.c. implanted with control NCI-H1299 cells at the end point. (E and F) Representative images of p-ERK and p-AKT IHC (Left) and quantification of the signal intensities (Right) of tumor biospecimens from the indicated xenografts. Data represent the mean ± SD. (Scale bars, 20 μm.) *P < 0.05, **P < 0.01, ***P < 0.001.
Fig. 5.
Fig. 5.
Effects of PD-1 depends on PD-L1. (AC) Relative PDCD1 mRNA expression (A), relative cell proliferation (B), and immunoblot analysis of the indicated proteins (C) of cells expressing the indicated plasmids. (DI) Relative cell proliferation (D, F, and H) and immunoblot analysis of the indicated proteins (E, G, and I) of cells expressing the indicated plasmids. (J and K) Relative cell proliferation (J) and immunoblot analysis of the indicated proteins (K) of cells expressing the indicated plasmids and/or treated with control Ig and/or PD-L1 Ig. Three independent experiments were performed for each analysis. Data represent the mean ± SEM (SEM). NS, no significance. *P < 0.05, **P < 0.01, ***P < 0.001.
Fig. 6.
Fig. 6.
Effects of clinical antibodies targeting PD-1/PD-L1. (A) Representative CFSE assay assessing the relative proliferation of Calu-1 cells after treatment with the indicated antibodies (100 µg/mL) for 48 h (Left). Quantification data are shown as MFI (Right) (n = 3). (B) Immunoblot analysis (Right) of cells after treatment with the indicated antibody (100 µg/mL) for 6 h. (C) Treatment effects of the indicated antibodies on s.c. NCI-H1299 tumor growth (n = 5). (D) Tumor size (Top) and quantification of tumor weight mass (Bottom) of the experiments in C at the end point. (E) Representative PD-1 and PD-L1 IHC (Top) and quantification of the signal intensities (Bottom) of tumor biospecimens obtained from the above-mentioned experiments. (Scale bars, 50 μm.) (F and G) Representative images of p-AKT (E) and p-ERK (F) IHC (Top) and quantification of the signal intensities (Bottom) of tumor biospecimens obtained from the above experiments. (Scale bars, 200 μm.) Data represent the mean ± SD or SEM. *P < 0.05, **P < 0.01, ***P < 0.001.
Fig. 7.
Fig. 7.
A proposed model of the mechanism underlying the impact of the PD-1/PD-L1 axis on tumor growth. Tumor cells express PD-1/PD-L1, which inhibit tumor cell growth through deregulation of canonical signaling pathways, including the AKT and ERK1/2 pathways, and prevent the interaction with PD-1-expressing T cells. Clinically available antibodies targeting PD-1 (blue) or PD-L1 (cyan) enhance tumor cell growth via activation of AKT and ERK1/2 in the absence of adaptive immunity, which may be associated with HPD and PPD in the clinic.

References

    1. Bray F., et al. , Global cancer statistics 2018: GLOBOCAN estimates of incidence and mortality worldwide for 36 cancers in 185 countries. CA Cancer J. Clin. 68, 394–424 (2018). - PubMed
    1. Hanahan D., Weinberg R. A., Hallmarks of cancer: The next generation. Cell 144, 646–674 (2011). - PubMed
    1. Vinay D. S., et al. , Immune evasion in cancer: Mechanistic basis and therapeutic strategies. Semin. Cancer Biol. 35 (suppl.), S185–S198 (2015). - PubMed
    1. Sharma P., Allison J. P., Immune checkpoint targeting in cancer therapy: Toward combination strategies with curative potential. Cell 161, 205–214 (2015). - PMC - PubMed
    1. Pardoll D. M., The blockade of immune checkpoints in cancer immunotherapy. Nat. Rev. Cancer 12, 252–264 (2012). - PMC - PubMed

Publication types

MeSH terms