. 2020 May 4;94(10):e02049-19.
doi: 10.1128/JVI.02049-19. Print 2020 May 4.

Novel Insights into the Roles of Bcl-2 Homolog Nr-13 (vNr-13) Encoded by Herpesvirus of Turkeys in the Virus Replication Cycle, Mitochondrial Networks, and Apoptosis Inhibition

Affiliations

Novel Insights into the Roles of Bcl-2 Homolog Nr-13 (vNr-13) Encoded by Herpesvirus of Turkeys in the Virus Replication Cycle, Mitochondrial Networks, and Apoptosis Inhibition

Vishwanatha R A P Reddy et al. J Virol. .

Abstract

The Bcl-2 (B cell lymphoma 2)-related protein Nr-13 plays a major role in the regulation of cell death in developing avian B cells. With over 65% sequence similarity to the chicken Nr-13, herpesvirus of turkeys (HVT) vNr-13, encoded by the HVT079 and HVT096 genes, is the first known alphaherpesvirus-encoded Bcl-2 homolog. HVT-infected cells were reported to be relatively more resistant to serum starvation, suggested that vNr-13 could be involved in protecting the cells. Here, we describe CRISPR/Cas9-based editing of exon 1 of the HVT079 and HVT096 genes from the HVT genome to generate the mutant HVT-ΔvNr-13 to gain insights into its functional roles. Overall, wild-type HVT and HVT-ΔvNr-13 showed similar growth kinetics; however, at early time points, HVT-ΔvNr-13 showed 1.3- to 1.7-fold-lower growth of cell-associated virus and 3- to 6.2-fold-lower growth of cell-free virus. In transfected cells, HVT vNr-13 showed a mainly diffuse cytoplasmic distribution with faint nuclear staining. Further, vNr-13 localized to the mitochondria and endoplasmic reticulum (ER) and disrupted mitochondrial network morphology in the transfected cells. In the wild-type HVT-infected cells, vNr-13 expression appeared to be directly involved in the disruption of the mitochondrial network, as the mitochondrial network morphology was substantially restored in the HVT-ΔvNr-13-infected cells. IncuCyte S3 real-time apoptosis monitoring demonstrated that vNr-13 is unequivocally involved in the apoptosis inhibition, and it is associated with an increase of PFU, especially under serum-free conditions in the later stages of the viral replication cycle. Furthermore, HVT blocks apoptosis in infected cells but activates apoptosis in noninfected bystander cells.IMPORTANCE B cell lymphoma 2 (Bcl-2) family proteins play important roles in regulating apoptosis during homeostasis, tissue development, and infectious diseases. Several viruses encode homologs of cellular Bcl-2-proteins (vBcl-2) to inhibit apoptosis, which enable them to replicate and persist in the infected cells and to evade/modulate the immune response of the host. Herpesvirus of turkeys (HVT) is a nonpathogenic alphaherpesvirus of turkeys and chickens that is widely used as a live vaccine against Marek's disease and as recombinant vaccine viral vectors for protecting against multiple avian diseases. Identical copies of the HVT genes HVT079 and HVT096 encode the Bcl-2 homolog vNr-13. While previous studies have identified the potential ability of vNr-13 in inhibiting apoptosis induced by serum deprivation, there have been no detailed investigations on the functions of vNr-13. Using CRISPR/Cas9-based ablation of the vNr-13 gene, we demonstrated the roles of HVT vNr-13 in early stages of the viral replication cycle, mitochondrial morphology disruption, and apoptosis inhibition in later stages of viral replication.

Keywords: Bcl-2; Bcl-2 family; CRISPR; HVT-ΔvNr-13; apoptosis; vNr-13; wild-type HVT.


Figures

FIG 1
FIG 1
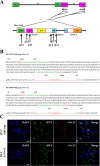
HVT vNr-13 structural analysis and sequence alignments with viral and cellular Bcl-2 orthologs of various mammalian and avian species. (A) Two identical copies of vNr-13, HVT079 in the reverse direction and HVT096 in the forward direction, are present in inverted repeat sequences (IRS) and terminal repeat sequences (TRS) of the HVT genome, respectively. HVT vNr-13 has two exons and one intron. Bcl-2 homology domains (BH4, BH3, BH1, and BH2) and a transmembrane (TM) domain are present in exons in the 5′ to 3′ direction of the gene. (B) Qualitative analysis of sequence identity and similarity was performed using the ESPript 3.0 online tool. Helices 1 to 8 (α1 to α8) are shown above the sequence along with helix 9 of the TM domain, based on the vNr-13 predicted three-dimensional (3D) structural model. Strictly conserved residues are boxed in black on a yellow background. BH domains (BH4, BH3, BH1, and BH2) and the TM domain are marked above the sequence in the 5′ to 3′ direction. (C) Maximum-likelihood phylogenetic trees based on amino acid sequences of HVT vNr-13 in relation to other mammalian and viral orthologs. Bootstrap values of 1,000 replicates were assigned for the analysis. HVT vNr-13 was grouped separately with other Nr-13 orthologs. (D) Similar 3D homology of vNr-13 with zebrafish Nr-13, Bax, and Mcl-1, represented as a cartoon structural diagram. The 3D structures of vNr-13 (raspberry red), zebrafish Nr-13 (yellow), Bax (green), and Mcl-1 (magenta/hot pink) have identical orientations with eight α-helices, labeled α1 to α8. TM, transmembrane domain of vNr-13 and Mcl-1. All views are same as for vNr-13.
FIG 2
FIG 2
In vitro characterization of HVT vNr-13 by confocal microscopy and Western blotting. (A) Representative confocal image illustrating vNr-13 in DF-1 cells. Immunofluorescence staining was carried out in DF-1 cells transfected with expression construct pcDNA3.1-vNr-13. Cells were fixed after 48 h and stained with monoclonal F878 EG2 antibody (green). HVT vNr-13-transfected cells appeared to show diffuse staining throughout the cytoplasm and a relatively faint nuclear staining with apparent labeling of the nuclear envelope (white arrows). The cyan blue color shows vNr-13 colocalization with the nuclear envelope or membrane of the nuclei (yellow arrows). Scale bars, 20 μm. (B) Western blot analysis demonstrates that the F878 EG2 antibody specifically recognizes an ∼19-kDa band of HVT vNr-13. (C) Representative Western blot images of cytosolic and nuclear fractions. The purity of subcellular fractions was assayed with anti-α-tubulin or anti-histone H3 antibodies for the cytosolic or nuclear fraction, respectively.
FIG 3
FIG 3
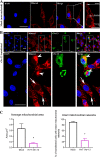
HVT vNr-13 localizes to the mitochondria and endoplasmic reticulum of transfected DF-1 cells. (A) The probability of subcellular localization of HVT vNr-13 was predicted by the DeepLoc-1.0 online algorithm. The hierarchical tree suggests that vNr-13 is localized predominantly to the mitochondrial membrane (0.84) and in a small portion to the ER membrane (0.10). According to immunofluorescence staining, HVT vNr-13 localizes with the mitochondrial network and ER of transfected DF-1 cells. (B and C) The yellow color indicates HVT vNr-13 colocalization with the mitochondrial network (white arrow) and ER (white arrowhead). The second-row images correspond to a higher magnification of the area within the white squares in the first-row images. HVT vNr-13 was stained with monoclonal antibody F878 EG2 (green for mitochondria and red for ER), mitochondria were stained with MitoTracker dye (red), the ER was stained with ER-Tracker dye (green), and nuclei were stained with DAPI (blue). All confocal image scale bars represent 20 μm. (D) The HVT vNr-13 Manders overlap coefficients with nuclei, mitochondria, and ER were 0.21 ± 0.24, 0.49 ± 0.19, and 0.62 ± 0.20, respectively. The data are shown as mean ± standard deviation (SD).
FIG 4
FIG 4
Efficient deletion of HVT vNr-13 by CRISPR/Cas9 technology. (A) Exon 1 of both HVT079 and HVT096 was targeted by three unique guide RNAs at the 5′ (gN1, gN2, and gN3) and 3′ (gC1, gC2, and gC3) ends in nine combinations, and gN3gC2 was found to be the best combination for efficient deletion. (B) Confirmation of deletion of 312 bp (highlighted in red) in exon 1 of both HVT079 and HVT096 at the gN3 and gC2 target sites by PCR sequencing. In gN3 and gC2, PAM sequences are highlighted in red and guide RNA sequences in green. (C) Confirmation of deletion of HVT vNr-13 sequences by immunofluorescence staining with anti-vNr-13 monoclonal antibody F878 EG2 (red) and anti-HVT polyclonal serum (green) as an infection control. Scale bar, 25 μm.
FIG 5
FIG 5
In vitro growth kinetics of wild-type HVT and HVT-ΔvNr-13 on chicken embryo fibroblasts (CEFs). In each experiment, CEF monolayers seeded at 1.3 × 106 were inoculated with wild-type HVT and HVT-ΔvNr-13, and viral titers were determined at 0, 12, 24, 48, 72, 96 and 120 h postinoculation (hpi). Growth curves were determined with 100, 1,000, and 10,000 PFU per well, which correspond to multiplicities of infection of 0.00007, 0.0007, and 0.007, respectively. Growth kinetics (means ± SD) were evaluated with three biologically independent experiments. (A) Replication of HVT-ΔvNr-13 was significantly lower than that of wild-type HVT at 12 hpi in cells inoculated with 100 PFU. (B) In cells inoculated with 1,000 PFU, HVT-ΔvNr-13 replication was significantly lower than that of wild-type HVT at 12, 24, and 48 hpi. (C) HVT-ΔvNr-13 showed significantly lower replication than wild-type HVT at 24 hpi in cells inoculated 10,000 PFU. (D) Viral titers were determined in supernatant (cell-free virus) of the samples inoculated with 10,000 PFU to understand the cell-free viral kinetics of wild-type HVT and HVT-ΔvNr-13. Cell-free HVT-ΔvNr-13 showed significantly reduced viral titers compared to those of cell-free wild-type HVT at 12, 24, and 48 hpi. The green dotted line represents the mean values of the wild-type HVT, and the red line represents the mean values of HVT-ΔvNr-13. An asterisk indicates a significant difference of viral titers between wild-type HVT and HVT-ΔvNr-13 (P < 0.05). (F) The average plaque areas were determined for both cell-associated and cell-free wild-type HVT and HVT-ΔvNr-13. The plaque areas of cell-associated wild-type HVT and HVT-ΔvNr-13 were significantly higher than those of the cell free virus. Groups with different letters are significantly different from each other (P < 0.05).
FIG 6
FIG 6
HVT vNr-13 disrupts the mitochondrial network morphology in transfected DF-1 cells. (A) In the cytoplasm of untransfected cells, clearly dispersed staining of tubular, branched, and punctate structures was observed. Scale bar, 25 μm. The right panel shows a higher-magnification image with clear tubular, branched, and punctate structures labeled (scale bar, 10 μm). (B) After HVT vNr-13 transfection, changes in mitochondrial morphology were observed by confocal microscopy. A yellow color indicates HVT vNr-13 colocalization with the disrupted mitochondrial network (arrowhead) in vNr-13-transfected DF-1 cells. The second-row images correspond to a higher magnification of the area within the white squares in the first-row images. Clear tubular, branched, and punctate mitochondrial structures were observed in nontransfected cells (arrows). HVT vNr-13 was stained with monoclonal antibody F878 EG2 (green), and mitochondria were stained with MitoTracker dye (red). Scale bar, 25 μm. (C) The average mitochondrial area and intact mitochondrial networks in a cell were determined as described in Materials and Methods. The average mitochondrial area and intact mitochondrial networks were significantly lower in HVT vNr-13-transfected cells than in nontransfected cells. Data are shown as means from three biologically independent experiments ± standard deviation (SD). An asterisk indicates a significant difference (P < 0.05).
FIG 7
FIG 7
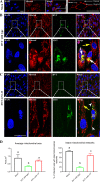
The mitochondrial network morphology is disrupted during wild-type HVT infection in CEFs. (A) Clearly dispersed tubular, branched, and punctate mitochondrial structures were observed in mock-infected CEFs. (B) After wild-type HVT infection, the mitochondrial morphology was severely disrupted and aggregated near the nucleus (white arrows). A yellow color indicates vNr-13 colocalization with the mitochondrial network. The second-row images correspond to a higher magnification of the area within the white squares in the first-row images to show severe disruption of mitochondrial network morphology (white arrows). (C) HVT-ΔvNr-13 infection caused lower mitochondrial network disruption than wild-type HVT infection (arrowhead). The second-row images correspond to a higher magnification of the area within the white squares in the first-row images to show the better intact mitochondrial network morphology than with wild-type HVT (arrowhead). A clearly dispersed intact mitochondrial structure was observed in noninfected cells from both wild-type HVT and HVT-ΔvNr-13 conditions (yellow arrow). Chicken polyclonal anti-HVT antibodies were used to label HVT antigens (green), and mitochondria were stained with MitoTracker dye (red). All confocal image scale bars represents 25 μm. (D) The average mitochondrial area and intact mitochondrial networks in a cell were determined as described in Materials and Methods. The average mitochondrial area and intact mitochondrial networks were significantly lower in the wild-type-HVT-infected cells than in the HVT-ΔvNr-13-infected and mock-infected cells. Data are shown as means from three biologically independent experiments ± standard deviation (SD). Bars with different letters are significantly different from each other (P < 0.05).
FIG 8
FIG 8
HVT vNr-13 inhibits apoptosis compared to the strong apoptosis inducer apoptin. Apoptotic cell kinetics of HVT vNr-13-transfected cells were compared with those of apoptin- and Meq-transfected cells as inducer and inhibitor controls of apoptosis, respectively. Apoptosis kinetics were determined by noninvasive high-throughput IncuCyte S3 real-time monitoring. Fluorescent images from the IncuCyte S3 live-cell imaging system were collected with 5,000 and 10,000 transiently transfected cells at 2-h intervals for 84 h. HVT vNr-13-transfected cell apoptosis was significantly lower than that of apoptin-transfected cells between 28 and 84 h with 5,000 transiently transfected cells and between 36 and 84 h with 10,000 transiently transfected cells. In the Meq-transfected cells, the level of apoptosis was significantly lower than that in the apoptin-transfected cells between 10 and 84 h with 5,000 cells and between 34 and 84 h with 10,000 cells. The apoptosis kinetics of vNr-13- and Meq-transfected cells were significantly lower than those of transfection control cells between 74 and 84 h and of control cells between 60 and 84 h with 5,000 cells, while with 10,000 cells, the apoptosis kinetics of vNr-13-transfected cells were significantly lower than those of transfection control cells between 54 and 82 h and of control cells at 62, 82, and 84 h. In addition, with 10,000 cells, the Meq-transfected cell apoptosis kinetics were significantly lower than those of transfection control cells between 50 and 84 h and of control cells between 56 and 84 h. §, #, and ¥ indicate apoptosis kinetics of apoptin-transfected, transfection control, and control cells, respectively, that were significantly higher than those of vNr-13- and Meq-transfected cells (P < 0.05). Growth curves of transfected cells are shown as means from three biologically independent experiments ± standard deviation (SD). Transfection and caspase 3/7-positive controls were used.
FIG 9
FIG 9
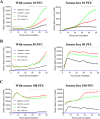
HVT vNr-13 inhibition of apoptosis varies with virus titer and serum deprivation. The apoptotic cell kinetics for wild-type HVT and HVT-ΔvNr-13 were monitored with serum or under serum-free conditions with the high-throughput IncuCyte S3 real-time system. CEFs (4.5 × 104 cells per well) in a 96-well plate were inoculated with wild-type HVT and HVT-ΔvNr-13 at 10, 50, and 100 PFU per well, which correspond to MOIs of 0.0002, 0.001, and 0.02, respectively, and then caspase 3/7 reagent was added to the cells. Real-time IncuCyte fluorescent images were captured every 1 h for wells inoculated with 10 PFU and every 2 h for wells inoculated with 50 and 100 PFU for 50 h. (A) Quantitation of green fluorescent images as an apoptosis indicator showed that apoptosis was significantly higher between 2 and 16 hpi in the HVT-ΔvNr-13-infected cells than in the cells infected with wild-type HVT at 10 PFU with serum, and no difference was observed under serum-free conditions. Further, after 25 hpi with serum and 28 hpi without serum, the apoptotic cells were significantly higher in the wild-type-HVT-infected cells than in the HVT-ΔvNr-13-infected cells when 10 PFU was used. (B) In wells inoculated with 50 PFU, the apoptosis was significantly higher in the HVT-ΔvNr-13 infected cells than in the wild-type-HVT-infected cells between 44 and 50 hpi with serum and between 14 and 50 hpi under serum-free conditions. (C) In wells inoculated with 100 PFU, the apoptosis was significantly higher between 26 and 50 hpi in the HVT-ΔvNr-13 infected cells than in the cells infected with the wild-type HVT both with serum and under serum-free conditions. Mean values for the wild-type HVT, HVT-ΔvNr-13, caspase 3/7 control, and negative control are represented as green, red, black, and blue lines, respectively. Apoptotic cell kinetics of infected cells are shown as means from nine biological independent experiments ± standard deviation (SD). An asterisk indicates a significant difference (P < 0.05).
FIG 10
FIG 10
Replication kinetics and viability of wild-type-HVT- and HVT-ΔvNr-13-infected cells determined by TUNEL assay. (A) Monolayers of CEFs were inoculated with wild-type HVT and HVT-ΔvNr-13 at 10 PFU per well, which corresponds to an MOI of 0.00007. After virus inoculation, large number of cells were infected. Wild-type-HVT-infected cells were significantly higher than HVT-ΔvNr-13-infected cells at 48 hpi. (B) TUNEL-positive cells were observed for both wild-type HVT and HVT-ΔvNr-13. TUNEL-positive cells with HVT-ΔvNr-13 were significantly higher at 12 hpi than those with wild-type HVT. (C) At 48 hpi, TUNEL-positive and infected TUNEL-positive cells were lower for HVT-ΔvNr-13 than for wild-type HVT. An asterisk indicates a significant difference (P < 0.05). (D) A representative confocal image illustrating TUNEL-positive cells (apoptotic; green) in the vicinity of HVT-infected cells (red) but not in the HVT-infected cells. HVT-infected cells were in general not apoptotic. Scale bar, 25 μm.

References

    1. Kawamura H, King DJ Jr, Anderson DP. 1969. A herpesvirus isolated from kidney cell culture of normal turkeys. Avian Dis 13:853–863. doi:10.2307/1588592. - DOI - PubMed
    1. Witter RL, Nazerian K, Purchase HG, Burgoyne GH. 1970. Isolation from turkeys of a cell-associated herpesvirus antigenically related to Marek’s disease virus. Am J Vet Res 31:525–538. - PubMed
    1. Purchase HG, Okazaki W. 1971. Effect of vaccination with herpesvirus of turkeys (HVT) on horizontal spread of Marek’s disease herpesvirus. Avian Dis 15:391–397. doi:10.2307/1588710. - DOI - PubMed
    1. Kvansakul M, Caria S, Hinds MG. 2017. The Bcl-2 family in host-virus interactions. Viruses 9:290. doi:10.3390/v9100290. - DOI - PMC - PubMed
    1. Suraweera CD, Caria S, Jarva M, Hinds MG, Kvansakul M. 2018. A structural investigation of NRZ mediated apoptosis regulation in zebrafish. Cell Death Dis 9:967. doi:10.1038/s41419-018-0992-0. - DOI - PMC - PubMed

Publication types

MeSH terms

LinkOut - more resources