. 2020 Mar 12;5(5):e133707.
doi: 10.1172/jci.insight.133707.

Integrative study of the upper and lower airway microbiome and transcriptome in asthma

Affiliations

Integrative study of the upper and lower airway microbiome and transcriptome in asthma

Yoojin Chun et al. JCI Insight. .

Abstract

Relatively little is known about interactions between the airway microbiome and airway host transcriptome in asthma. Since asthma affects and is affected by the entire airway, studying the upper (e.g., nasal) and lower (e.g., bronchial) airways together represents a powerful approach to understanding asthma. Here, we performed a systematic, integrative study of the nasal and bronchial microbiomes and nasal and bronchial host transcriptomes of children with severe persistent asthma and healthy controls. We found that (a) the microbiomes and host transcriptomes of asthmatic children are each distinct by site (nasal versus bronchial); (b) among asthmatic children, Moraxella and Alloiococcus are hub genera in the nasal microbiome, while there are no hubs among bronchial genera; (c) bronchial Actinomyces is negatively associated with bronchial genes for inflammation, suggesting Actinomyces may be protective; (d) compared with healthy children, asthmatic children express more nasal genes for ciliary function and harbor more nasal Streptococcus; and (e) nasal genera such as Corynebacterium are negatively associated with significantly more nasal genes for inflammation in healthy versus asthmatic children, suggesting a potentially stronger protective role for such nasal genera in healthy versus asthmatic children. Our systematic, integrative study provides a window into host-microbiome associations in asthma.

Keywords: Asthma; Bacterial infections; Microbiology; Pulmonology; Transcription.


Conflict of interest statement

Conflict of interest: The authors have declared that no conflict of interest exists.

Figures

Figure 1
Figure 1. Study design and analytic flow.
For each child with severe persistent asthma (n = 27), 4 matched samples were collected and profiled, including nasal transcriptome, nasal microbiome, bronchial transcriptome, and bronchial microbiome. For each healthy control (i.e., child without asthma, n = 27), samples for nasal transcriptome and nasal microbiome were collected and profiled; bronchial samples were not collected because bronchoscopy is not indicated in healthy children. The circled numbers, referred to as steps, represent the analytic steps taken in this systematic study. Among children with severe persistent asthma, we compared the nasal versus bronchial transcriptome (step 1), and the nasal versus bronchial microbiome (step 2). We also assessed positive and negative associations between genera abundances among nasal microbiota, among bronchial microbiota, and between nasal and bronchial microbiota in children with severe persistent asthma (step 2). Next, using the matched samples from these children with severe persistent asthma, we characterized associations between nasal transcriptome and nasal microbiota (step 3), as well as associations between bronchial transcriptome and bronchial microbiota (step 4). We then compared the nasal transcriptome of children with severe persistent asthma with that of healthy controls (step 5), as well as the nasal microbiome of children with severe persistent asthma with that of healthy controls (step 6). Finally, we characterized the associations between nasal transcriptome and nasal microbiota in healthy controls (step 7).
Figure 2
Figure 2. Nasal versus bronchial transcriptome in children with severe persistent asthma (step 1 in Figure 1).
Paired nasal and bronchial samples were collected from children with severe persistent asthma (n = 27), and RNA-seq was used for transcriptome profiling. (A) Principal Component Analysis (PCA) plot of nasal and bronchial transcriptomes of children with severe persistent asthma shows distinct clustering by anatomic site. Each point represents a sample. (B) Heatmap of genes differentially expressed (FDR ≤ 0.05, and |log2 fold change| > 1) between nasal and bronchial transcriptomes in children with severe asthma shows distinct clusters. Rows show the 2618 genes upregulated in the bronchial versus nasal transcriptome (cyan), and the 1904 genes upregulated in the nasal versus bronchial transcriptome (green). Columns show the 27 bronchial (red) and 27 nasal (blue) samples.
Figure 3
Figure 3. Nasal versus bronchial microbiome in children with severe persistent asthma (step 2 in Figure 1).
(A) Increased bacterial diversity of bronchial versus nasal microbiome in children with severe persistent asthma (n = 27). The α diversity was estimated by Shannon diversity index by subsampling 10 times for each sample at a rarefaction depth of 1950. P values were calculated using Wilcoxon signed-rank test and FDR correction. (B) Principal Coordinates Analysis (PCoA) plot of weighted UniFrac distance shows clear separation of bacterial composition between the nasal and bronchial microbiome of children with severe persistent asthma (n = 27). Each point represents a sample and is colored by airway site. P values were calculated using PERMANOVA with 1000 permutations. (C) Distinct mean relative abundances of bacterial genera in the nasal versus bronchial microbiomes of children with severe persistent asthma (n = 27). Genera representing < 1% of total abundance in each site are shown as Other. Sixteen of the 20 genera (80%) were differentially abundant by site (Wilcoxon signed-rank test FDR ≤ 0.05) and are marked with asterisks. For unnamed genera, the closest higher level named taxon is indicated. 1Prevotella genus affiliated with the Prevotellaceae family. 2Prevotella genus proposed as affiliated with Paraprevotellaceae by the Greengenes database v.13.8.
Figure 4
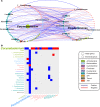
Figure 4. Associations among nasal microbiota and among bronchial microbiota in children with severe persistent asthma (step 2 in Figure 1).
(A) Network of associations among nasal microbiota in children with severe persistent asthma (n = 27). The network was built based on the ensemble4 method (see Methods). Each circular node represents a nasal genus and is colored by the phylum to which it belongs. Edges between nodes indicate significant associations between genera and are colored based on positive or negative associations between genera abundances. (B) Matrix of pairwise associations (FDR ≤ 0.05) between nasal microbiota in children with severe persistent asthma (n = 27). The top 3 most associated genera are shown in bigger font. (C) Network of associations between bronchial microbiota in children with severe persistent asthma (n = 27). The network was built using the ensemble4 method (see Methods). Each rhomboid node represents a bronchial genus and is colored by the phyla to which it belongs. Edges between nodes indicate significant associations (FDR ≤ 0.05) between genera and are colored based on positive or negative associations between genera abundances. 1Prevotella genus is affiliated with Prevotellaceae family. 2Prevotella genus proposed as affiliated with Paraprevotellaceae by the Greengenes database v.13.8. (D) Matrix of pairwise associations between bronchial microbiota in children with severe persistent asthma (n = 27). The top 3 most associated genera are shown in bigger font.
Figure 5
Figure 5. Associations between nasal and bronchial microbiota in children with severe persistent asthma (step 2 in Figure 1).
(A) Network of associations between nasal microbiota (circular nodes) and bronchial microbiota (rhomboid nodes) in children with severe persistent asthma (n = 27). The network was built using the ensemble4 method (see Methods). Nodes are colored by the phyla to which they belong. Edges indicate significant associations (FDR ≤ 0.05) between genera and are colored based on positive and negative associations between genera abundances. (B) Matrix of pairwise associations between nasal and bronchial microbial hubs and their associated genera in children with severe persistent asthma (n = 27). Nasal genera are along the rows, and bronchial genera are along the columns.
Figure 6
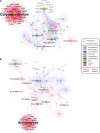
Figure 6. Associations between transcriptome and microbiome in the nasal (step 3 in Figure 1) and bronchial (step 4 in Figure 1) airways in children with severe persistent asthma.
(A) Network of associations between the nasal transcriptome and nasal microbiome in children with severe persistent asthma (n = 27). The network was built using the ensemble3 method (see Methods). Each circular node represents a nasal genus and is colored by the phylum to which it belongs. Each rectangular node represents a host gene. Edges show significant associations (FDR ≤ 0.05) between microbial abundance and gene expression level. (B) Network of associations between the bronchial transcriptome and bronchial microbiome in children with severe persistent asthma (n = 27). The network was built using the ensemble3 method (see Methods). Each rhomboid node represents a bronchial genus and is colored by the phylum to which it belongs. Each rectangular node represents a host gene. Edges show significant associations (FDR ≤ 0.05) between microbial abundance and gene expression level. 1Prevotella genus is affiliated with Prevotellaceae family. 2Prevotella genus proposed as affiliated with Paraprevotellaceae by Greengenes database v.13.8.
Figure 7
Figure 7. Nasal transcriptome (step 5 in Figure 1) and microbial composition (step 6 in Figure 1) of healthy children versus children with severe persistent asthma.
(A) Heatmap of nasal genes differentially expressed (FDR ≤ 0.05, and |log2 fold change| > 1) between healthy children (n = 27) and children with severe persistent asthma (n = 27). Rows represent 86 genes upregulated in healthy controls versus children with severe persistent asthma (cyan), and 266 genes upregulated in children with severe persistent asthma versus healthy controls (green). Columns indicate the 27 healthy control (light blue) and 27 severe persistent asthma (dark blue) nasal samples. (B) Relative abundance of nasal bacterial genera of healthy children (n = 27) versus children with severe persistent asthma (n = 27). Genera representing < 1% of total abundance are shown as Other.
Figure 8
Figure 8. Associations between nasal microbiota in healthy controls.
(A) Nasal microbial network in healthy children (n = 27). The network was built using the ensemble4 method (see Methods). Each circular node represents a nasal genus and is colored by the phylum to which it belongs. Edges between nodes indicate significant associations (FDR ≤ 0.05) between genera and are colored based on positive and negative associations between genera abundances. (B) Matrix of pairwise associations between nasal microbiota in healthy children (n = 27). The top 3 most associated genera are shown in bigger font.
Figure 9
Figure 9. The nasal transcriptome and nasal microbiome in healthy controls (step 7 in Figure 1).
Network of associations between the nasal transcriptome and nasal microbiome in healthy children (n = 27). The network was built using the ensemble3 method (see Methods). Each circular node represents a nasal genus and is colored by the phylum to which it belongs. Each rectangular node represents a host gene. Edges show significant associations (FDR ≤ 0.05) between microbial abundance and gene expression level.

References

    1. Global Burden of Disease Study 2013 Collaborators. Global, regional, and national incidence, prevalence, and years lived with disability for 301 acute and chronic diseases and injuries in 188 countries, 1990-2013: a systematic analysis for the Global Burden of Disease Study 2013. Lancet. 2015;386(9995):743–800. doi: 10.1016/S0140-6736(15)60692-4. - DOI - PMC - PubMed
    1. Chung KF, et al. International ERS/ATS guidelines on definition, evaluation and treatment of severe asthma. Eur Respir J. 2014;43(2):343–373. doi: 10.1183/09031936.00202013. - DOI - PubMed
    1. Fitzpatrick AM. Severe Asthma in Children: Lessons Learned and Future Directions. J Allergy Clin Immunol Pract. 2016;4(1):11. - PMC - PubMed
    1. Fitzpatrick AM, Moore WC. Severe Asthma Phenotypes - How Should They Guide Evaluation and Treatment? J Allergy Clin Immunol Pract. 2017;5(4):901–908. doi: 10.1016/j.jaip.2017.05.015. - DOI - PMC - PubMed
    1. Tyler SR, Bunyavanich S. Leveraging -omics for asthma endotyping. J Allergy Clin Immunol. 2019;144(1):13–23. doi: 10.1016/j.jaci.2019.05.015. - DOI - PMC - PubMed

Publication types