

High-Throughput, Temporal and Dose Dependent, Effect of Vitamins and Minerals on Chondrogenesis
- PMID: 32161755
- PMCID: PMC7053227
- DOI: 10.3389/fcell.2020.00092
High-Throughput, Temporal and Dose Dependent, Effect of Vitamins and Minerals on Chondrogenesis
Abstract
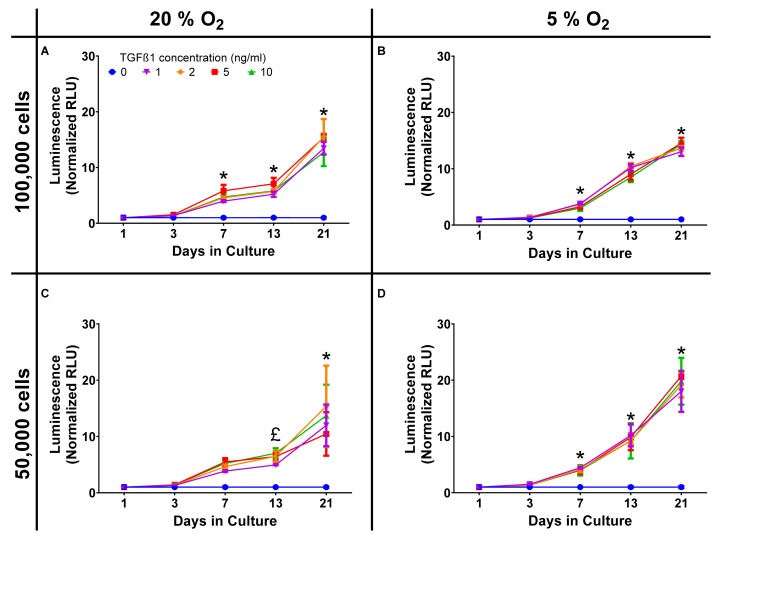
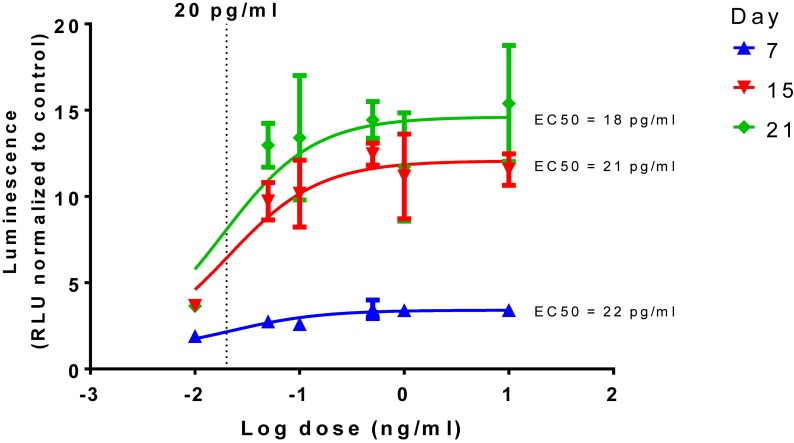
Tissue engineered hyaline cartilage is plagued by poor mechanical properties largely due to inadequate type II collagen expression. Of note, commonly used defined chondrogenic media lack 14 vitamins and minerals, some of which are implicated in chondrogenesis. Type II collagen promoter-driven Gaussia luciferase was transfected into ATDC5 cells to create a chondrogenic cell with a secreted-reporter. The reporter cells were used in an aggregate-based chondrogenic culture model to develop a high-throughput analytic platform. This high-throughput platform was used to assess the effect of vitamins and minerals, alone and in combination with TGFβ1, on COL2A1 promoter-driven expression. Significant combinatorial effects between vitamins, minerals, and TGFβ1 in terms of COL2A1 promoter-driven expression and metabolism were discovered. An "optimal" continual supplement of copper and vitamin K in the presence of TGFβ1 gave a 2.5-fold increase in COL2A1 promoter-driven expression over TGFβ1 supplemented media alone in ATDC5 cells.
Keywords: cartilage tissue engineering; defined chondrogenic media; defined media; high-throughput chondrogenesis; high-throughput organoid; in vitro chondrogenesis.
Copyright © 2020 Dennis, Splawn and Kean.
Figures
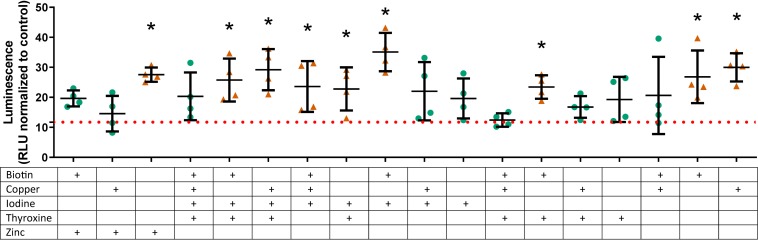
 ) indicate values that are significantly greater than those for basal media alone, and the dashed red line indicates the luminescence achieved with TGFβ1 supplementation at 1 ng/mL. An orange triangle (
 ) and an * indicate values that were discovered different, with false discovery rate set at 1%.
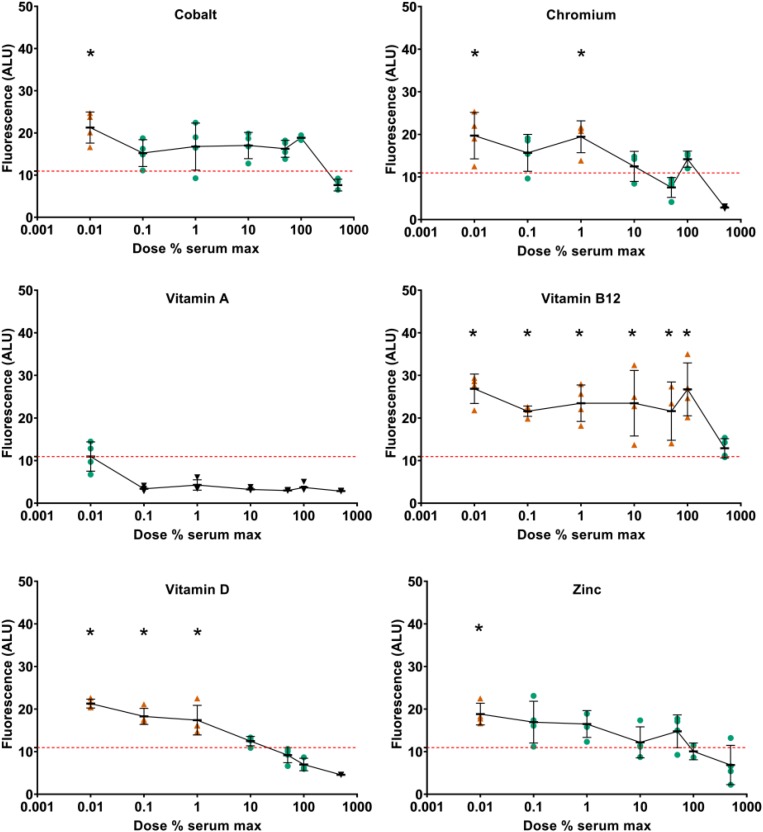
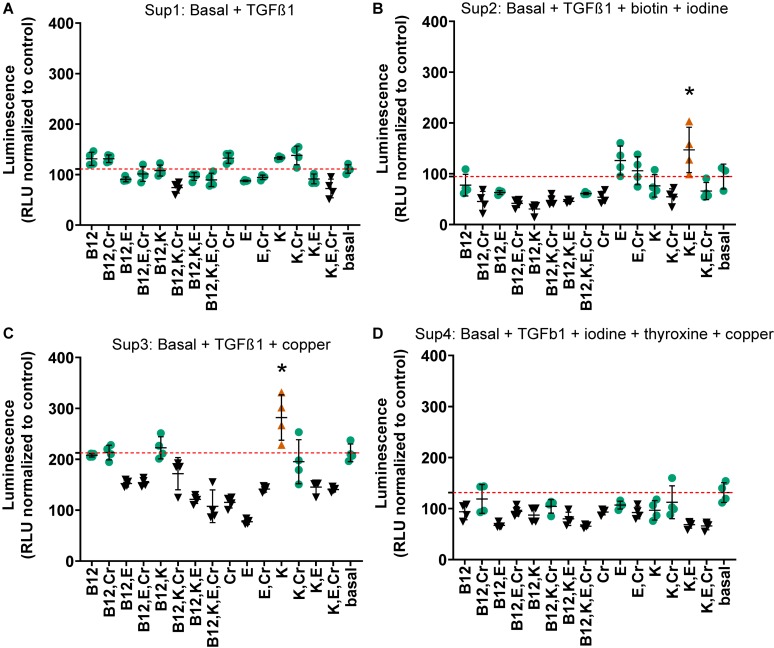 ) and an *, black symbols (▼) indicate that those values were lower than the respective supplemented media. n ≥ 3 ± S.D.
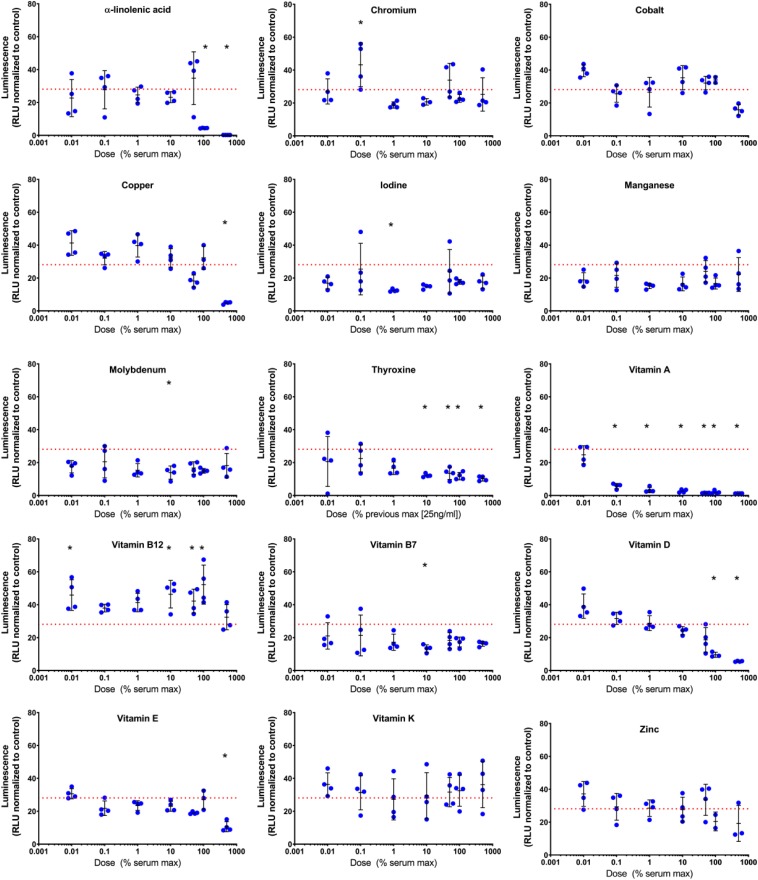
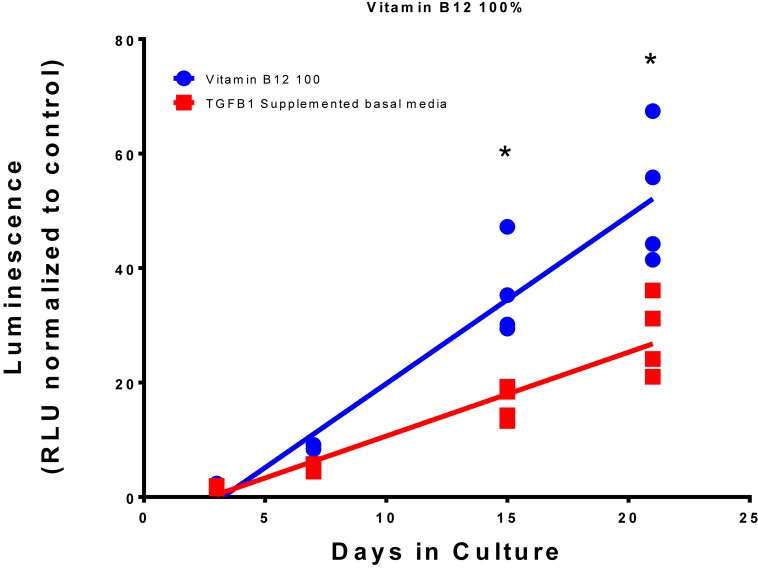
 ) and an * indicate greater than TGFβ1 supplemented basal medium; black triangles (▼) indicate lower vs. TGFβ1 supplemented basal medium, one-way ANOVA p < 0.05 Dunnett’s multiple comparison test. Conditions that were similar to TGFβ1 supplemented basal media are represented by a green circle ().
Similar articles
-
Micronutrient optimization for tissue engineered articular cartilage production of type II collagen.Front Bioeng Biotechnol. 2023 Jun 6;11:1179332. doi: 10.3389/fbioe.2023.1179332. eCollection 2023. Front Bioeng Biotechnol. 2023. PMID: 37346792 Free PMC article.
-
Screening of chondrogenic factors with a real-time fluorescence-monitoring cell line ATDC5-C2ER: identification of sorting nexin 19 as a novel factor.Arthritis Rheum. 2009 Nov;60(11):3314-23. doi: 10.1002/art.24878. Arthritis Rheum. 2009. PMID: 19877062
-
Sulfation patterns of exogenous chondroitin sulfate affect chondrogenic differentiation of ATDC5 cells.J Orthop Sci. 2014 Nov;19(6):1028-35. doi: 10.1007/s00776-014-0643-y. Epub 2014 Sep 11. J Orthop Sci. 2014. PMID: 25209441
-
Chondrogenic differentiation of ATDC5 and hMSCs could be induced by a novel scaffold-tricalcium phosphate-collagen-hyaluronan without any exogenous growth factors in vitro.J Biomed Mater Res A. 2014 Aug;102(8):2725-35. doi: 10.1002/jbm.a.34948. Epub 2013 Sep 24. J Biomed Mater Res A. 2014. PMID: 24026971
-
Chondrogenic differentiation of mesenchymal stem cells and its clinical applications.Yonsei Med J. 2004 Jun 30;45 Suppl:41-7. doi: 10.3349/ymj.2004.45.Suppl.41. Yonsei Med J. 2004. PMID: 15250049 Review.
Cited by
-
Systematic review on the application of 3D-bioprinting technology in orthoregeneration: current achievements and open challenges.J Exp Orthop. 2022 Sep 19;9(1):95. doi: 10.1186/s40634-022-00518-3. J Exp Orthop. 2022. PMID: 36121526 Free PMC article. Review.
-
Physioxia Stimulates Extracellular Matrix Deposition and Increases Mechanical Properties of Human Chondrocyte-Derived Tissue-Engineered Cartilage.Front Bioeng Biotechnol. 2020 Nov 13;8:590743. doi: 10.3389/fbioe.2020.590743. eCollection 2020. Front Bioeng Biotechnol. 2020. PMID: 33282851 Free PMC article.
-
Optimizing Bioink Composition for Human Chondrocyte Expression of Lubricin.Bioengineering (Basel). 2023 Aug 23;10(9):997. doi: 10.3390/bioengineering10090997. Bioengineering (Basel). 2023. PMID: 37760099 Free PMC article.
-
Micronutrient optimization for tissue engineered articular cartilage production of type II collagen.Front Bioeng Biotechnol. 2023 Jun 6;11:1179332. doi: 10.3389/fbioe.2023.1179332. eCollection 2023. Front Bioeng Biotechnol. 2023. PMID: 37346792 Free PMC article.
-
TGF-β1/BSA coating modulates multi-phasic scaffolds for osteochondral tissue regeneration.Mater Today Bio. 2025 May 17;32:101879. doi: 10.1016/j.mtbio.2025.101879. eCollection 2025 Jun. Mater Today Bio. 2025. PMID: 40502370 Free PMC article.
References
LinkOut - more resources
Full Text Sources
Research Materials