. 2020 Feb 25:8:109.
doi: 10.3389/fcell.2020.00109. eCollection 2020.

In vivo Environment Swiftly Restricts Human Pancreatic Progenitors Toward Mono-Hormonal Identity via a HNF1A/HNF4A Mechanism

Affiliations

In vivo Environment Swiftly Restricts Human Pancreatic Progenitors Toward Mono-Hormonal Identity via a HNF1A/HNF4A Mechanism

Thomas Aga Legøy et al. Front Cell Dev Biol. .

Abstract

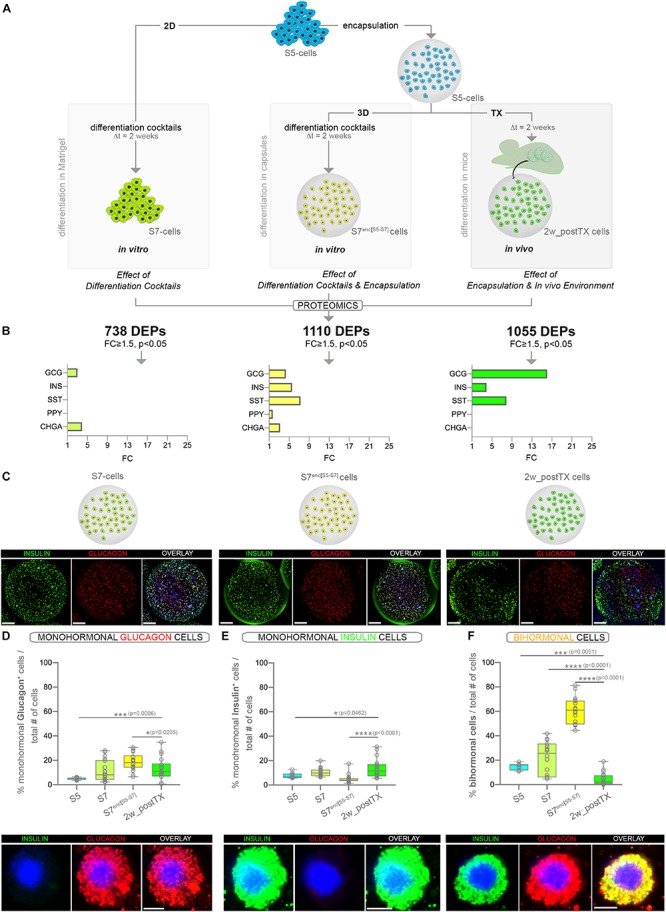
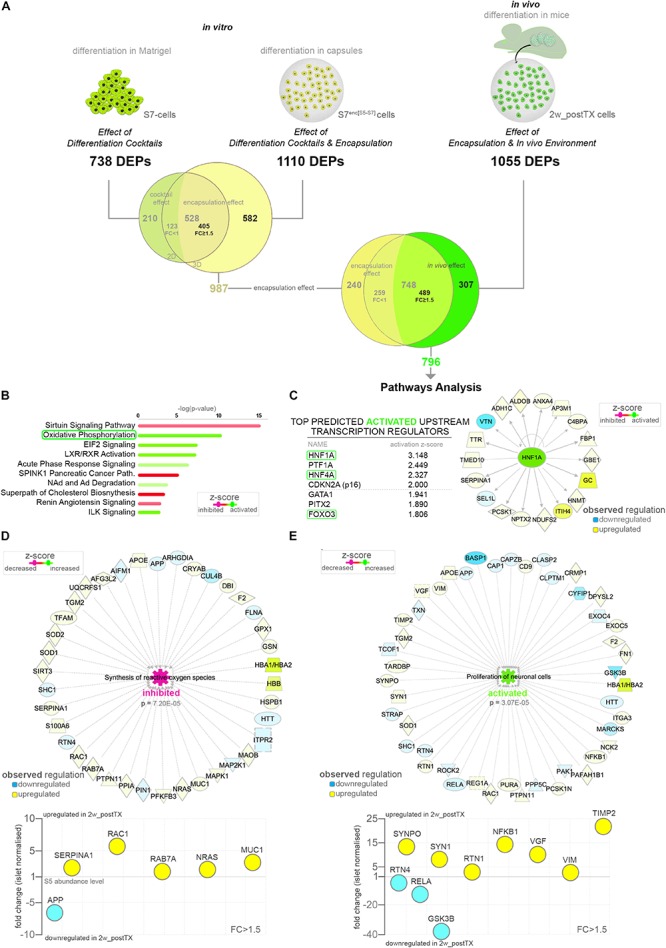
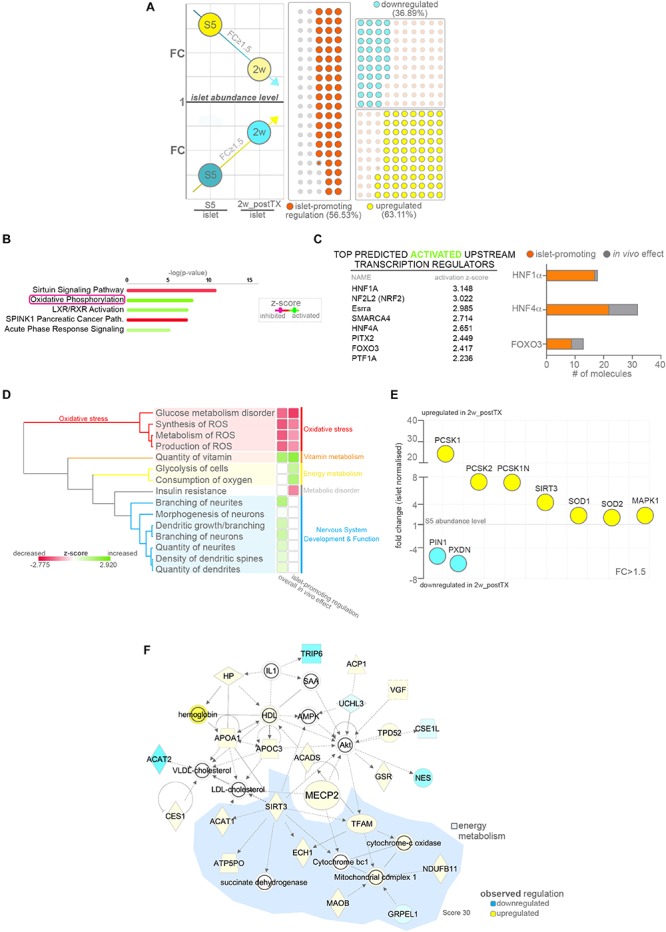
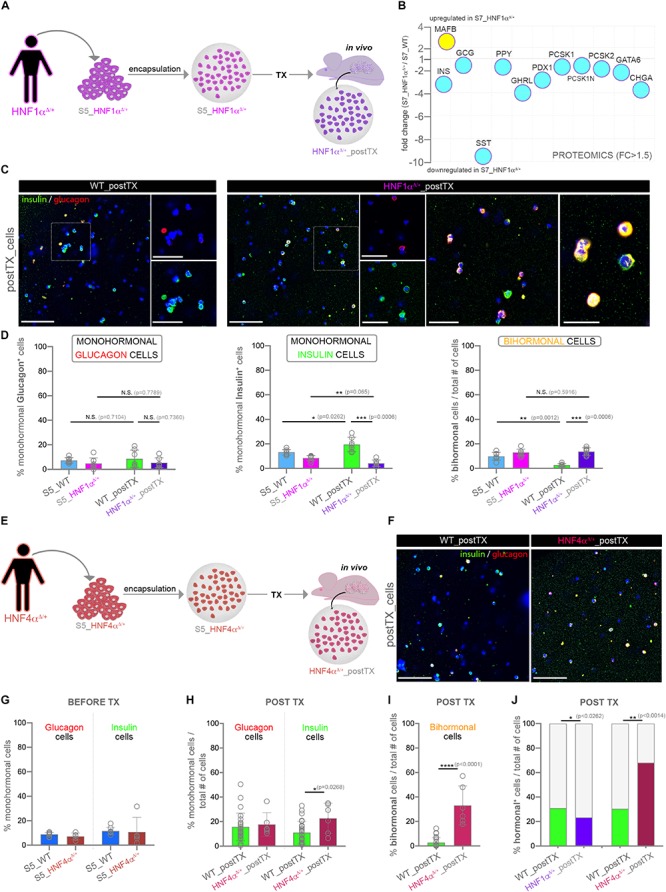
Generating insulin-producing β-cells from human induced pluripotent stem cells is a promising cell replacement therapy for improving or curing insulin-dependent diabetes. The transplantation of end-stages differentiating cells into living hosts was demonstrated to improve β-cell maturation. Nevertheless, the cellular and molecular mechanisms outlining the transplanted cells' response to the in vivo environment are still to be properly characterized. Here we use global proteomics and large-scale imaging techniques to demultiplex and filter the cellular processes and molecular signatures modulated by the immediate in vivo effect. We show that in vivo exposure swiftly confines in vitro generated human pancreatic progenitors to single hormone expression. The global proteome landscape of the transplanted cells was closer to native human islets, especially in regard to energy metabolism and redox balance. Moreover, our study indicates a possible link between these processes and certain epigenetic regulators involved in cell identity. Pathway analysis predicted HNF1A and HNF4A as key regulators controlling the in vivo islet-promoting response, with experimental evidence suggesting their involvement in confining islet cell fate following xeno-transplantation.

Keywords: cell fate; cell identity; differentiation; endocrine progenitors; pathway analyses; signaling.


Figures

FIGURE 1
FIGURE 1
Assessment of the pancreatic islet hormones expression by global proteomics and large-scale imaging following three distinct differentiation strategies (A) Experimental design depicting the three differentiation strategies considered. Numbers in bold represent differentially expressed proteins (DEPs) between the final differentiation stage (S7, S7enc[S5–S7], 2w_postTX) and pancreatic progenitors (S5), following islet-standard normalization (data represent two distinct TMT-11 plexes). (B) Graphs displaying the statistically significant (FC ≥ 1.5, p < 0.05) regulated islet hormones (colored bars) identified in the DEPs set characterizing each differentiation strategy (in vitro Matrigel differentiation – chartreuse, in vitro encapsulation – yellow and in vivo transplantation of encapsulated cells – light green). (C) 3D reconstructions of dragonfly imaged whole alginate capsules containing cells immunofluorescently labeled for insulin (green), glucagon (red) and DAPI (blue) in the four conditions analyzed (scale bar 200 μm, gamma correction 0.4). (D) Proportion of monohormonal glucagon cells in the four distinct populations analyzed (n = 9,18,18,18) and the high magnification of a representative encapsulated glucagon+ cell. (E) Proportion of monohormonal insulin in the four distinct populations analyzed (n = 9,18,18,18) and the high magnification of a representative encapsulated insulin+ cell. (F) Proportion of bihormonal cells (insulin+glucagon+ co-expressing) and a high magnification of a representative encapsulated bihormonal cell. High magnification scale bars: 5 μm. Graphs data are shown as box plot mean to max values. *p < 0.05, **p < 0.01, ***p < 0.001, ****p < 0.0001 (Mann–Whitney test). Abbreviations: TX, transplant; 2D, Matrigel differentiation; 3D, alginate encapsulation; DEPs, differentially expressed proteins; Dt, time interval; FC, fold change; S5-cells, stage 5 cells (pancreatic progenitor stage); S7-cells, stage 7 cells (maturing β-cells); S7enc[S5–S7], differentiated in capsules from stage 5 to stage 7; 2w_postTX, 2 weeks following transplantation (differentiation in mice).
FIGURE 2
FIGURE 2
Pathway analysis of the proteome landscape following in vivo exposure. (A) Analysis workflow depicting the strategy used for demultiplexing the in vivo effect (B) IPA-generated top canonical pathways with predicted regulation (z-score ≥ 1.1) characterizing the in vivo response. (C) Top predicted activated upstream transcription regulators and the HNF1A target molecules observed regulated in the in vivo effect DEPs dataset. (D,E) IPA-generated networks and graph representations of selected dataset DEPs characterizing the corresponding top disease and function processes. Abbreviations: TX, transplant; DEPs, differentially expressed proteins; FC, fold change; S5-cells, stage 5 cells (pancreatic progenitor stage); S7-cells, stage 7 cells (maturing β-cells); S7enc[S5–S7], differentiated in capsules from stage 5 to stage 7; 2w_postTX, 2 weeks following transplantation (differentiation in mice), Path, pathway. For abbreviations see Supplementary Table S3.
FIGURE 3
FIGURE 3
Pathway analysis of proteins following islet-promoting regulation patterns as result of the in vivo effect. (A) Scheme depicting the selection strategy and waffle charts reflecting the number of proteins showing a dynamic of regulations compatible with an islet-promoting pattern in response to the in vivo effect. The scheme circles reflect the regulation reported to the islet abundance levels. Arrows represent the generic mandatory direction of regulation for inclusion in the islet-promoting signature (blue – downregulation, yellow – upregulation). The waffle graph dots reflect the regulation dynamic following transplantation (similar to the scheme arrows) (B) IPA-generated top canonical pathways with predicted regulation (z-score ≥ 1.8) characterizing the protein subset exhibiting islet-promoting regulation. (C) Top predicted activated upstream transcription regulators and graph depicting the number of relevant target DEPs in the HNF1A, HNF4A and FOXO3 network following a regulation toward islet abundance levels. (D) IPA generated hierarchical clustering of the predicted disease and function processes for the conditions compared. (E) Selected signature-relevant DEPs exhibiting regulation toward islet abundance levels. (F) Selected top 5 organic network linking MECP2, lipid and energy metabolism. Abbreviations: DEPs, differentially expressed proteins; FC, fold change; S5, stage 5 cells (pancreatic progenitor stage); 2w_postTX, 2 weeks following transplantation (differentiation in mice), Path, pathway; ROS, reactive oxygen species). For abbreviations see Supplementary Table S3.
FIGURE 4
FIGURE 4
Assessment of hormone expression patterns in differentiating cells characterized by suboptimal HNF1A or HNF4A levels. (A) Experimental workflow. (B) Selected islet cell markers regulation in HNF1αΔ/+ (pool) following standard in vitro differentiation, identified by a pilot global proteomics experiment. (C) Confocal imaging of insulin (green), glucagon (red) and DAPI (blue) immunofluorescence staining of encapsulated HNF1αΔ/+ and WT cells following transplantation. (D) Manual counting of the proportion of monohormonal glucagon+ cells, monohormonal insulin+ cells and bihormonal glucagon+insulin+ in encapsulated HNF1αΔ/+ and WT samples before and after in vivo exposure (n = 7,8,8,7). (E) Experimental workflow. (F) Confocal imaging of insulin (green), glucagon (red) and DAPI (blue) immunofluorescence staining of encapsulated HNF1αΔ/+ and WT cells following transplantation. (G,H) The proportion of monohormonal glucagon + and monohormonal insulin + cells in HNF4αΔ/+ and WT samples (G) before (n = 9,5,9,5) and after (H) transplantation (n = 26,6,26,6) quantified by Imaris software. (I) The fraction of bihormonal glucagon+ insulin+ cells in HNF4αΔ/+ and WT samples after transplantation (n = 26,6). (J) The fraction of total hormonal+ cells in WT, HNF1αΔ/+ and HNF4αΔ/ + samples after transplantation. Scale bars: 100 μm and 50 μm (high magnifications). Graphs data are shown as mean and SD. *p < 0.05, **p < 0.01, ***p < 0.001, ****p < 0.0001 (Mann–Whitney test). Abbreviations: DEPs, differentially expressed proteins; FC, fold change; WT, wild type; D, mutated allele; S5_WT, control stage 5 cells; S5_HNF1α, Stage 5 cells bearing the HNF1αΔ/WT mutation; WT_postTX, control cells following transplantation, HNF1αΔ/WT _postTX, HNF1αΔ/WT cells after transplant; S5_HNF4α, Stage 5 cells bearing the HNF4αΔ/WT mutation; HNF1αΔ/WT _postTX, HNF1αΔ/WT cells after transplant.

Similar articles

Cited by

References

    1. Agulnick A. D., Ambruzs D. M., Moorman M. A., Bhoumik A., Cesario R. M., Payne J. K., et al. (2015). Insulin-producing endocrine cells differentiated in vitro from human embryonic stem cells function in Macroencapsulation devices In Vivo. Stem Cells Transl. Med. 4 1214–1222. 10.5966/sctm.2015-0079 - DOI - PMC - PubMed
    1. Balboa D., Otonkoski T. (2015). Human pluripotent stem cell based islet models for diabetes research. Best Pract. Res. Clin. Endocrinol. Metab. 29 899–909. 10.1016/j.beem.2015.10.012 - DOI - PubMed
    1. Barra J. M., Tse H. M. (2018). Redox-dependent inflammation in islet transplantation rejection. Front. Endocrinol. 9:175. 10.3389/fendo.2018.00175 - DOI - PMC - PubMed
    1. Bjorkhaug L., Sagen J. V., Thorsby P., Sovik O., Molven A., Njolstad P. R. (2003). Hepatocyte nuclear factor-1 alpha gene mutations and diabetes in Norway. J. Clin. Endocrinol. Metab. 88 920–931. 10.1210/jc.2002-020945 - DOI - PubMed
    1. Bjørlykke Y., Søviknes A. M., Hoareau L., Vethe H., Mathisen A. F., Chera S., et al. (2019). Reprogrammed cells display distinct proteomic signatures associated with colony morphology variability. Stem Cells Int. 2019:8036035. 10.1155/2019/8036035 - DOI - PMC - PubMed