. 2020 Mar 9;7(2):024301.
doi: 10.1063/1.5144518. eCollection 2020 Mar.

Liquid-phase mega-electron-volt ultrafast electron diffraction

Affiliations

Liquid-phase mega-electron-volt ultrafast electron diffraction

J P F Nunes et al. Struct Dyn. .

Abstract

The conversion of light into usable chemical and mechanical energy is pivotal to several biological and chemical processes, many of which occur in solution. To understand the structure-function relationships mediating these processes, a technique with high spatial and temporal resolutions is required. Here, we report on the design and commissioning of a liquid-phase mega-electron-volt (MeV) ultrafast electron diffraction instrument for the study of structural dynamics in solution. Limitations posed by the shallow penetration depth of electrons and the resulting information loss due to multiple scattering and the technical challenge of delivering liquids to vacuum were overcome through the use of MeV electrons and a gas-accelerated thin liquid sheet jet. To demonstrate the capabilities of this instrument, the structure of water and its network were resolved up to the 3 rd hydration shell with a spatial resolution of 0.6 Å; preliminary time-resolved experiments demonstrated a temporal resolution of 200 fs.


Figures

FIG. 1.
FIG. 1.
Schematic representation of the liquid-phase MeV UED experimental setup, illustrating a MeV electron beam (A) traversing a thin liquid sheet (D) and the scattered electron (E) being recorded as a diffraction pattern (G) at the detector (F). Species in the liquid sheet are excited by an optical pump (B) made to travel colinearly to the electron beam by a 90° holey-mirror (C). A detailed description of our MeV LUED instrument can be found in Sec. IV.
FIG. 2.
FIG. 2.
Panel (a) shows an average diffraction pattern and panel (b) the azimuthally averaged scattering signal for liquid water at 290 K, acquired over 350 s. The temperature of the water was determined using the method described in Sec. II C. The background signal (orange line) in panel (b) was acquired by switching off the flow of water and maintaining a constant flow of helium. Panels (c) and (d) show UED, x-ray and simulated scattering curves, and sM(s) curves for liquid water, respectively. The simulated sM(s) is generated under the independent atom model (IAM) approximation and assuming a water temperature of 290 K. Residual experimental background response contributions were subtracted from both the UED and x-ray scattering curves [panel (c)] using a third order polynomial curve fitted over the entire s range to obtain sM(s) curves [panel (d)]. The x-ray scattering data were measured for liquid water at the European Synchrotron Radiation Facility, using the conditions described in Ref. . Panel (e) shows UED, x-ray, and simulated pdf(r) curves for liquid water.
FIG. 3.
FIG. 3.
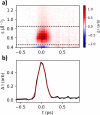
Upper-limit time resolution estimated from a low-s beam streaking effect in water excited at 800 nm, 1.1 J/cm2 fluence. (a) Difference scattering signal ΔS as a function of time delay and s, averaged over six 23-min scans. The negative signal at the lowest s and positive signal up to 1 Å−1 are a result of the main beam profile becoming elongated when passing through the ionized sample. (b) Time trace (black) of ΔS integrated between the dotted lines in panel (a), and fit (red). The FWHM of the feature is 209 ± 4 fs.
FIG. 4.
FIG. 4.
(a) and (b) Images taken at 30° from normal of liquid jet at 0.20 and 0.25 ml/min liquid flow rate, respectively, and equal He pressure; liquid flow is from top to bottom. Overlay: multiple scattering ratio, as defined in text, for a grid of electron beam positions. The scale bar is 100 μm; the FWHM electron beam size is also shown. (c) Thickness of jets (a) (blue) and (b) (red) as a function of distance from the nozzle, as measured by thin-film interference. Error bars represent 12.5 μm resolution of camera; the dotted line represents region where the jet is thinner than the sensitivity of the interference measurement (102 nm) as described in Sec. IV B 4. (d) Transmission and multiple scattering ratio at the center of the jet as a function of jet thickness for the two jet conditions. The shaded region corresponds to ±50 μm uncertainty in the vertical position of electrons on the jet.
FIG. 5.
FIG. 5.
Panel (a) shows the simulated scattering signal of water over the 1.5–4 Å−1 range for temperatures ranging between 250 and 400 K. Panel (b) shows the evolution of the first peak position in the scattering signal of water as a function of temperature. Panel (c) shows the first peak of water scattering data acquired at varying distances from the chip. Panel (d) shows the estimated water temperature as a function of distance to the chip.
FIG. 6.
FIG. 6.
Noise levels of difference scattering from pure water pumped with 3 μm light at 2 ps time delay. Inset: rms noise after 7 min of integration as a function of s. Main figure: noise in range s =0–0.75 Å−1 (red), s =0.75–6 Å−1 (blue), and s =6–10 Å−1 (green) as a function of integration time.
FIG. 7.
FIG. 7.
3D CAD model of the SLAC MeV beamline and LUED sample chamber. Typical operating pressure of various differentially pumped sections is presented in Torr above the beamline. The inset on the top right corner illustrates the geometry of the detector.
FIG. 8.
FIG. 8.
(a) CAD model of the inside of the SLAC MeV LUED chamber. (b) CAD model of the incoupling mirror and capillary assembly. (c) Photography of the liquid sheet in false color. (d) CAD model depiction of the interaction region geometry. The chamber walls are omitted for visualization purposes.

References

    1. Cheng Y.-C. and Fleming G. R., “ Dynamics of light harvesting in photosynthesis,” Annu. Rev. Phys. Chem. 60, 241–262 (2009).10.1146/annurev.physchem.040808.090259 - DOI - PubMed
    1. Schreier W. J., Schrader T. E., Koller F. O., Gilch P., Crespo-Hernández C. E., Swaminathan V. N., Carell T., Zinth W., and Kohler B., “ Thymine dimerization in DNA is an ultrafast photoreaction,” Science 315, 625–629 (2007).10.1126/science.1135428 - DOI - PMC - PubMed
    1. Polli D., Altoe P., Weingart O., Spillane K. M., Manzoni C., Brida D., Tomasello G., Orlandi G., Kukura P., Mathies R. A., Garavelli M., and Cerullo G., “ Conical intersection dynamics of the primary photoisomerization event in vision,” Nature 467, 440–443 (2010).10.1038/nature09346 - DOI - PubMed
    1. Turro N., Ramamurthy V., and Scaiano J., Modern Molecular Photochemistry of Organic Molecules ( University Science Books, Sausalito, CA, 2010).
    1. Kim K. H., Kim J., Lee J. H., and Ihee H., “ Topical review: Molecular reaction and solvation visualized by time-resolved X-ray solution scattering: Structure, dynamics, and their solvent dependence,” Struct. Dyn. 1, 011301 (2014).10.1063/1.4865234 - DOI - PMC - PubMed