

RNA profile diversity across arthropoda: guidelines, methodological artifacts, and expected outcomes
- PMID: 32161805
- PMCID: PMC6994094
- DOI: 10.1093/biomethods/bpy012
RNA profile diversity across arthropoda: guidelines, methodological artifacts, and expected outcomes
Abstract
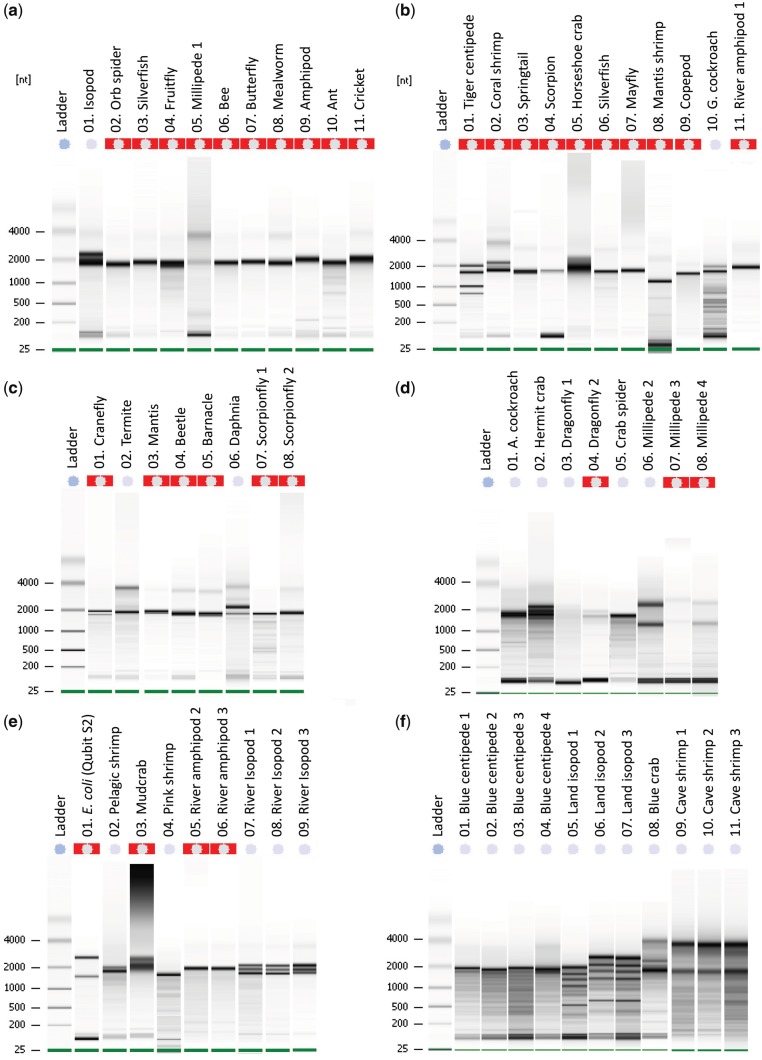
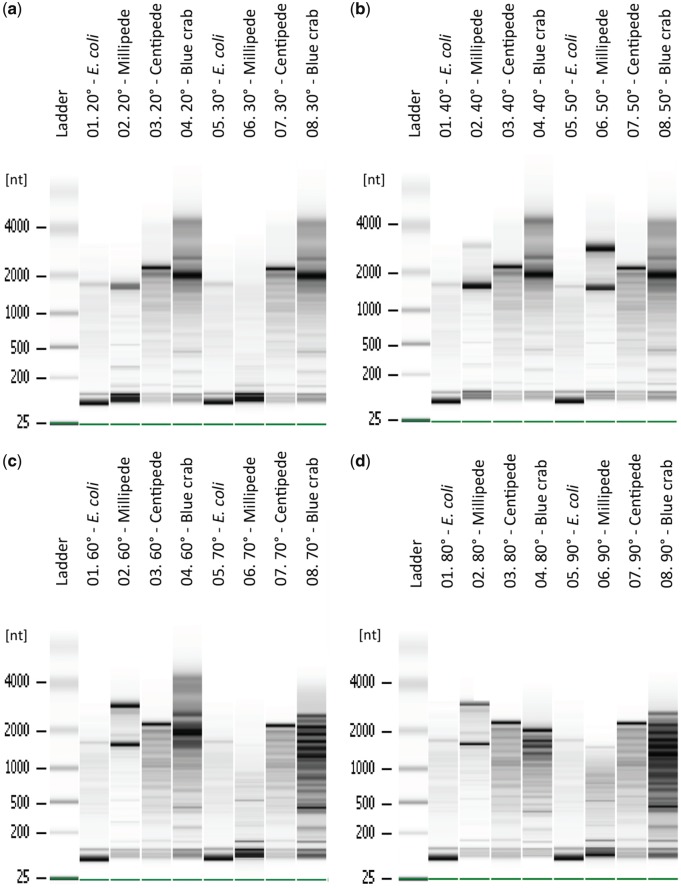
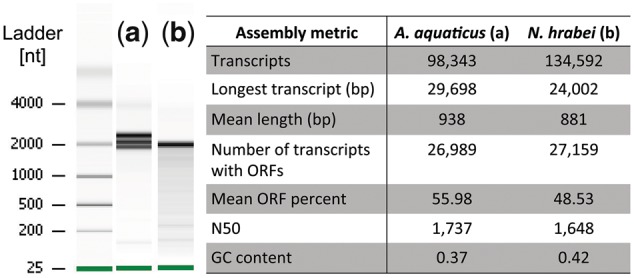
High-quality RNA is an important precursor for high-throughput RNA sequencing (RNAseq) and subsequent analyses. However, the primary metric used to assess RNA quality, the RNA Integrity Number (RIN), was developed based on model bacterial and vertebrate organisms. Though the phenomenon is not widely recognized, invertebrate 28S ribosomal RNA (rRNA) is highly prone to a form of denaturation known as gap deletion, in which the subunit collapses into two smaller fragments. In many nonmodel invertebrates, this collapse of the 28S subunit appears as a single band similar in size to the 18S rRNA subunit. This phenomenon is hypothesized to be commonplace among arthropods and is often misinterpreted as a "degraded" rRNA profile. The limited characterization of gap deletion in arthropods, a highly diverse group, as well as other nonmodel invertebrates, often biases RNA quality assessments. To test whether the collapse of 28S is a general pattern or a methodological artifact, we sampled more than half of the major lineages within Arthropoda. We found that the 28S collapse is present in ∼90% of the species sampled. Nevertheless, RNA profiles exhibit considerable diversity with a range of banding patterns. High-throughput RNAseq and subsequent assembly of high-quality transcriptomes from select arthropod species exhibiting collapsed 28S subunits further illustrates the limitations of current RIN proxies in accurately characterizing RNA quality in nonmodel organisms. Furthermore, we show that this form of 28S denaturation, which is often mistaken for true "degradation," can occur at relatively low temperatures.
Keywords: RNAseq; crustaceans; denaturation; gap deletion; genomics; insects; invertebrates; nucleic acids; transcriptomics.
© The Author(s) 2018. Published by Oxford University Press.
Figures
References
-
- Achim K, Pettit JB, Saraiva LR. et al. High-throughput spatial mapping of single-cell RNA-seq data to tissue of origin. Nat Biotechnol 2015;33:503.. - PubMed
LinkOut - more resources
Full Text Sources
Miscellaneous